

 CC-BY 4.0
In 2015, the Paris Agreement on Climate Change established the goal of holding “the increase in global average temperature to well below 2°C above pre-industrial levels and pursuing efforts to limit the temperature increase to 1.5°C above pre-industrial levels, recognising that this would significantly reduce the risks and impacts of climate change”.1 The Conference of the Parties to the United Nations Framework Convention on Climate Change, held in Paris in 2015 (COP21), also invited the Intergovernmental Panel on Climate Change (IPCC) to present a special report in 2018 on the consequences of global warming of 1.5°C above pre-industrial levels and the associated global greenhouse gas emission pathways. The IPCC responded to this invitation by publishing its special report “1.5°C” [IPCC 2018], the full title of which is “An IPCC Special Report on the impacts of global warming of 1.5°C above pre-industrial levels and related global greenhouse gas emission pathways, in the context of strengthening the global response to the threat of climate change, sustainable development, and efforts to eradicate poverty”. In this article, we will focus only on the elements of the report relating to global greenhouse gas emission pathways. The report summarised the global greenhouse gas emission pathways, produced by the scientific community, that are consistent with the goal of holding the increase in global average temperature to 1.5°C above the pre-industrial era (Figure 1). These pathways illustrate the urgency of taking actions to reduce emissions and reach CO2 neutrality over the next few decades, i.e. zero net CO2 emissions or, in other words, the fact that the sinks managed by human activities absorbing CO2 from the atmosphere (forests, soils) offset CO2 emissions due to human activities. The pathways of other greenhouse gases show rapid declines. In 2030, global emissions are approximately halved from their 2010 level in pathways consistent with 1.5°C, and reduced by about 25% in pathways consistent with 2°C. A second important thing this figure highlights is the years when net CO2 emissions become zero in the pathways. Regardless of the temperature stabilisation goal, this CO2 neutrality must be achieved, and the cumulative emissions up to the date on which neutrality is achieved condition the stabilisation temperature. For example, for 2°C, the year when net CO2 emissions become zero is in the second half of this century; for 1.5°C, it is around 2050.
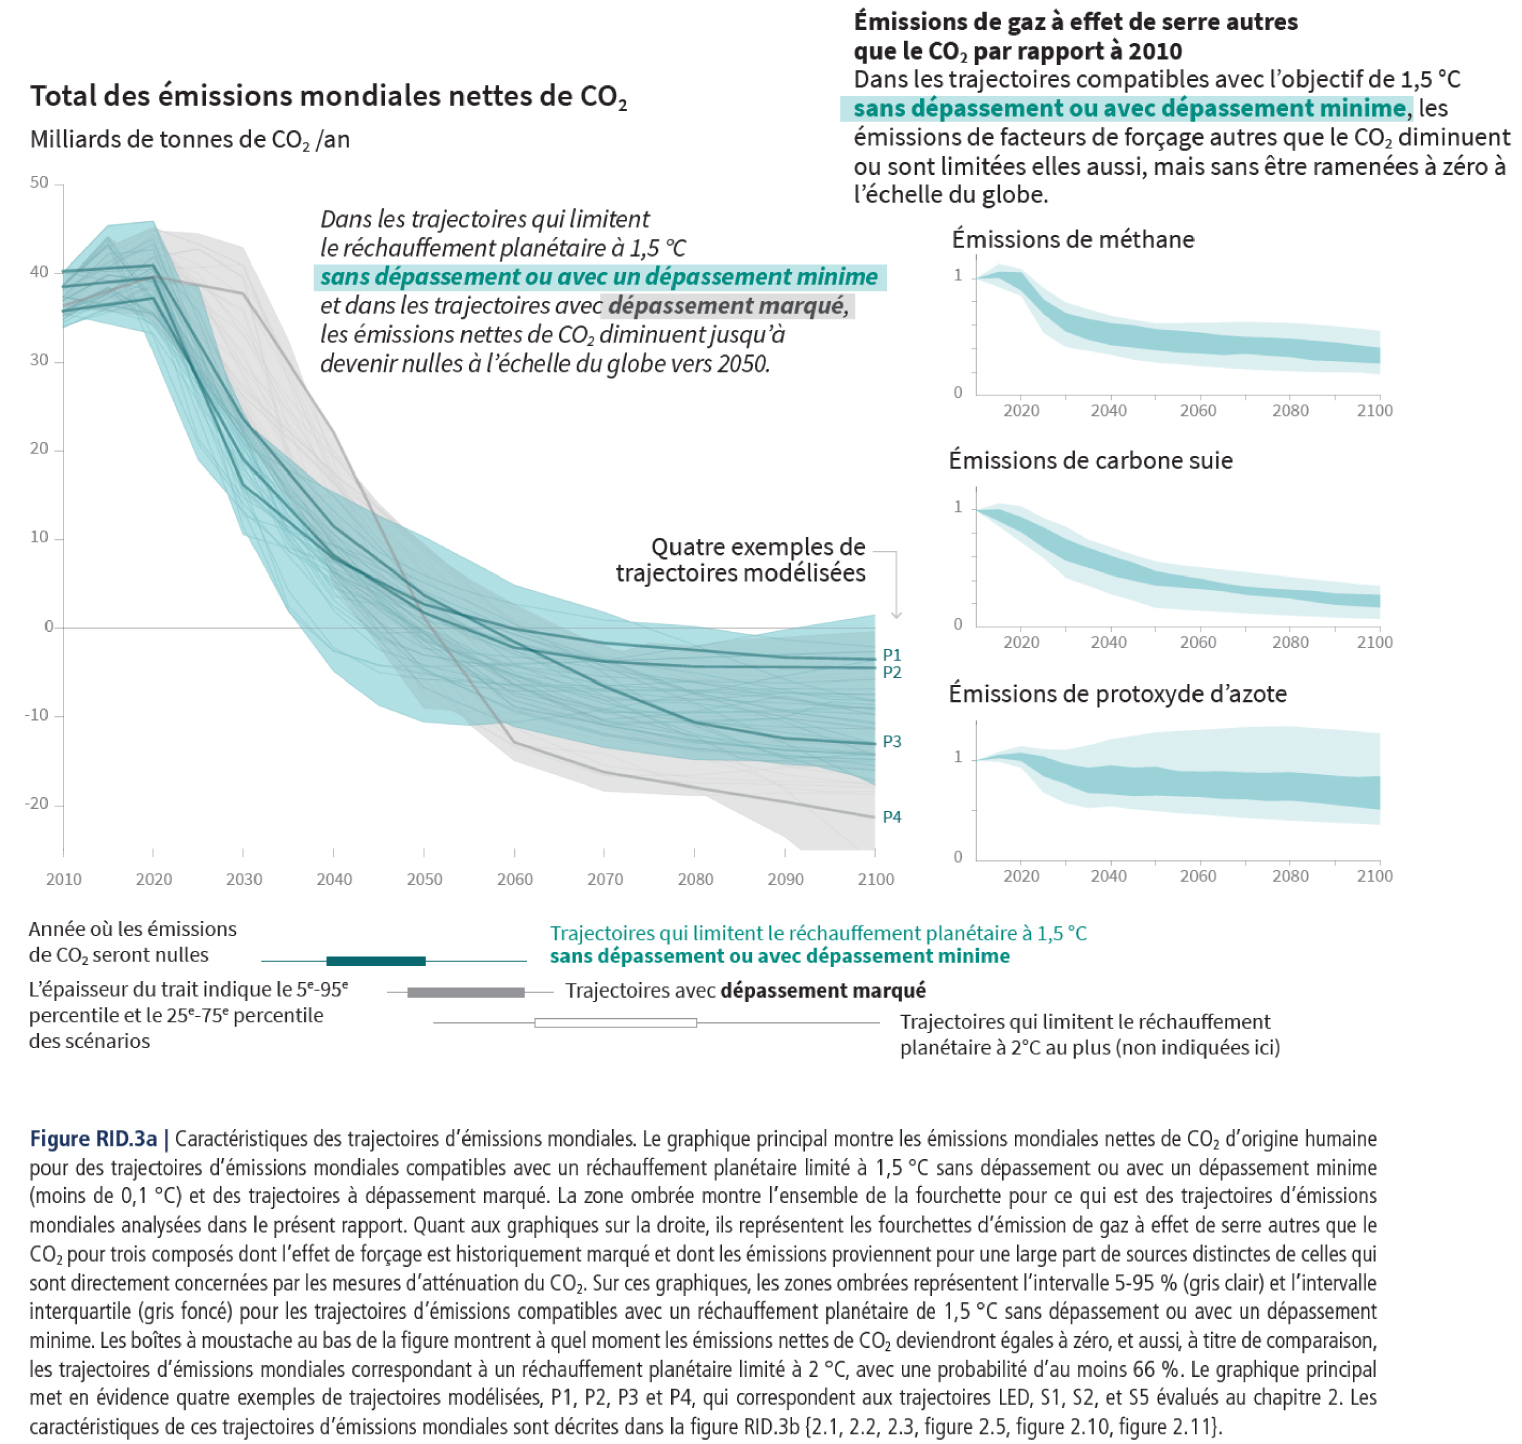
Source: Figure SPM.3a page 15 of the Summary for Policymakers of IPCC Special Report "1.5°C" www.ipcc.ch/sr15/.
These pathways, consistent with the long-term goal of the Paris Agreement, imply immediate, rapid and significant reductions in emissions in all major sectors. These are transformations of unprecedented scale. These are transformations of all major systems: energy systems, land-use and food systems, industrial systems, transport infrastructure, buildings and cities.
Greenhouse gas emissions of countries around the world
Greenhouse gas emissions are mainly related to the level of wealth and development of countries: the emissions in the United States, relative to the population, reach nearly 20 tCO2eq/person/year, those of the European Union and China are close to 8 t, those of India are about 2 t and those of Burkina Fasso for example are between 1 and 2 tCO2eq/person/year [Crippa et al. 2019; Ritchie and Roser 2017].
The richest countries (those classified as “high income” in the World Bank classification (https://datahelpdesk.worldbank.org/knowledgebase/articles/906519)), account for only 16% of the world's population but nearly 40% of CO2 emissions. While the two categories of countries with the lowest incomes represent nearly 60% of the world's population but less than 15% of emissions.
Inequalities in emissions between developed and developing countries widen if we move from territorial accounting of emissions to footprint accounting, in which emissions from the production of goods are reallocated to countries where the final goods are consumed. The majority of developed countries are indeed importers of emissions "embedded" in international trade, while most emerging and developing countries are exporters [Caro et al. 2014; Peters et al. 2011]. For example, for France, territorial emissions per capita represent 6.7 tCO2eq per capita per year, while the "consumption" footprint (by subtracting the emissions related to the production of goods that are exported, and adding the emissions occurring abroad for the production of goods imported into France) amounts to 11 tCO2eq per capita per year. The global average is 6.2 tCO2eq per capita per year.
Finally, in terms of the historical responsibility for global warming observed today, the contribution of developed countries is greater than their share of current emissions because, having initiated their industrial revolution earlier, they have participated in the accumulation of greenhouse gases in the atmosphere for longer. Consequently, while China is currently the world's largest emitter of greenhouse gases, with CO2 emissions corresponding to 27% of global emissions (in territorial accounting), ahead of the United States (15% of CO2 emissions), and the European Union (10%), its cumulative emissions since 1850 represent less than 13% of the total, behind the United States (25%) and the European Union (22%).
The rapid development of emerging economies, especially China, has reduced emissions inequalities between countries in recent years, but emissions inequalities within countries have increased at the same time. As a result, on a global scale, the 10% of households with the highest emissions are currently responsible for about 40% of greenhouse gas emissions, while emissions from the 40% with the lowest emissions represent less than 8% of the total [Pan et al. 2019].
Translating these global pathways into national emission pathways means distributing emissions among countries, explicitly or implicitly establishing a criterion for the distribution of emissions. Defining a criterion for the distribution of mitigation actions (i.e. reduction of emissions), and their financing, between countries, is a delicate exercise, given the different visions of what would be a fair criterion [Pottier et al. 2017]. Many proposals have been made (e.g. convergence of per capita emissions to the same level, equality of cumulative per capita emissions, or mitigation actions proportional to countries' GDP), but none have been successful in the context of international climate negotiations. Under the Paris Agreement, each country defines its contribution to emission reductions, through Nationally Determined Contributions (NDCs). If these NDCs were exactly achieved, they would lead by 2030 to a reduction in inequalities in per capita emissions between countries, with a decrease in per capita emissions for the main rich countries and an increase for emerging and developing countries [Benveniste et al. 2018]. However, the level of global emissions resulting in 2030 would be too high to be consistent with the Paris Agreement's goal of holding the increase in global average temperature well below +2°C compared to the pre-industrial era. Indeed, estimates suggest that if NDCs were strictly implemented, global emissions in 2030 would be in the range of 52-59 GtCO2-equivalent, i.e. above pathway levels consistent with the long-term goals of 2°C and 1.5°C, highlighting a "gap2"of about 15 GtCO2-equivalent for 2°C and about 30 GtCO2-equivalent for 1.5°C [UNEP 2019]. Therefore, the ambition of the NDCs must be increased to be consistent with the long-term goal of the Paris Agreement. In this perspective of NDCs revision, several studies [Kartha et al. 2018; Robiou du Pont et al. 2017; van den Berg et al. 2019] assessed the current NDCs against the proposed main criteria for sharing mitigation actions. For a given country, what constitutes a "fair" contribution to climate change mitigation, a "fair" ambition, depends on the criterion of fairness used, and comes back to the question of the allocation of global emissions between countries, with different visions of what is "fair". Depending on the criterion used, the emissions allocated to a given country vary greatly. Some criteria, such as an equal cumulative per capita emissions criterion, lead to negative emission budgets for developed countries.
Following the Paris Agreement, France revised its emission reduction target in the National Low-Carbon Strategy.3 By 2050, the “factor 4” goal (a 4-fold division of greenhouse gas emissions from 1990 levels) becomes an all greenhouse gas neutrality goal, also known as net zero emissions (NZE). This is slightly more ambitious than the CO2 neutrality for global emissions in emission pathways consistent with the 1.5°C target, since carbon sinks must then offset not only the residual emissions of CO2, but also those of methane, nitrous oxide and other greenhouse gases. An ambition greater than the world average is expected, because France has both a greater responsibility for the climate change observed today (it has contributed to accumulating greenhouse gases in the atmosphere for longer, as it was one of the first countries to carry out the industrial revolution) and a greater capacity to act. Nevertheless, it should be noted that some of the criteria considered for "allocating" emissions between countries would lead to lower pathways for France and negative net emissions in 2050.4
The National Low-Carbon Strategy also defines a pathway for reducing greenhouse gas emissions between now and 2050 and sets short and medium-term objectives, "steps" over periods of 5 years along the pathway, called "carbon budgets". A breakdown of the pathway emissions by major sectors is shown (Figure 2). As with global pathways, it involves major and rapid transformations in all sectors. Transformations are major as emissions become virtually zero or very low in the long term in all sectors. The transformations are rapid because, in view of the lifespan of infrastructures, industrial installations and buildings, 30 years remain a relatively short horizon. It should be noted that the land sector is a carbon sink throughout the proposed pathway, and in the long term it offsets all remaining positive emissions. This sink is constituted by the increase of forests, and agricultural practices allowing more carbon to be stored in the soil.
In the following paragraphs, we analyse recent trends, with regard to the pathway defined in the National Low-Carbon Strategy.
It should be remembered that France is part of a group of eighteen countries whose GHG emissions peaked in the past and have now been decreasing for several years or even decades [LeQuere et al. 2019], in this case for France since the 1970s. Global emissions, on the other hand, have been rising until 2019,5 although the rate of increase has slowed in the last decade [Friedlingstein et al. 2019].
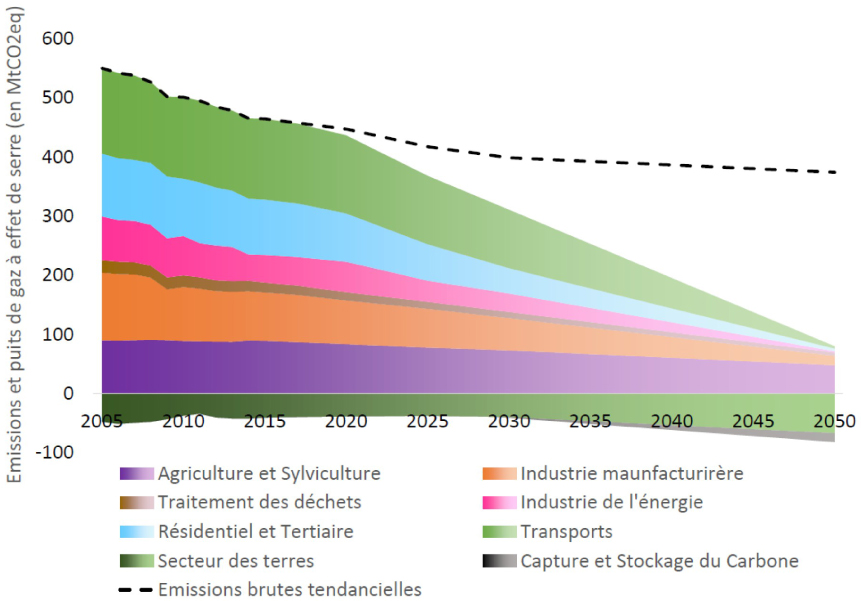
Trajectory of greenhouse gas emissions on the French territory of the "National Low-Carbon Strategy". Source: National Low-Carbon Strategy https://www.ecologique-solidaire.gouv.fr/strategie-nationale-bas-carbone-snbc.
Since 1990, a reference point particularly in international climate negotiations, French territorial emissions have fallen by 19% (Figure 3). Over the first period of the National Low-Carbon Strategy (2015–2018), they experienced an average decline of 1.1% per year. This decline was not enough to meet the short-term goal, the first carbon budget, the first step on the pathway towards carbon neutrality 2050, which was therefore missed. An average annual decline of 1.9% over the period would have been necessary to achieve these short-term goals. In order to comply with the next "step", the next "carbon budget", the rate of decline in emissions must triple by 2025.
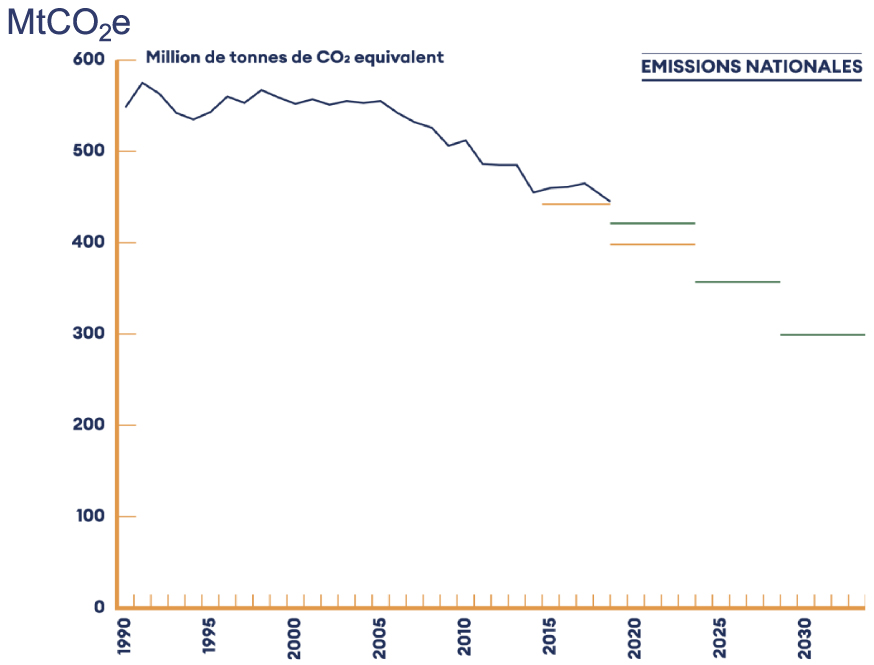
Trajectory of French territorial emissions of greenhouse gases since 1990, and "carbon budgets" by 5-year periods of the National Low-Carbon Strategy (in orange the carbon budgets of the NLCS1, and in green the carbon budgets of the NLCS2). Source: 2019 Annual Report of the High Council on Climate www.hautconseilclimat.fr/publications/rapport-2019/.
The largest greenhouse gas emitting sector in France is the transport sector, which accounts for more than 30% of emissions, half of which comes from private cars and 40% from trucks and commercial vehicles. Next, the buildings sector6 accounts for 19% of territorial emissions, of which 60% comes from residential buildings and the remaining 40% from tertiary buildings. This is followed by the agricultural and industrial sectors, each accounting for approximately 18% of territorial emissions.
The year 2020 will surely be a year that breaks with trends, due to the Covid health crisis and the associated economic crisis. Initial analyses estimate that France's emissions could be reduced by 5-15% in 2020 compared to 2019,7 but obviously remain very uncertain due to the duration and scale of the crisis, which remains unknown to date (June 2020).
However, we can seek to analyse recent trends up to 2019.8
Transport emissions have been stagnating for about 10 years, and this is the only sector whose emissions in 2019 are above their 1990 level. Several underlying factors explain this stagnation: (i) a continued increase in the distances travelled, particularly between home and work, reflecting a continuation of the phenomenon of urban sprawl; (ii) a delay in the electrification of vehicles compared to the planned pathway; (iii) a lack of modal shift, as this was contemplated in the National Low-Carbon Strategy, particularly for the transport of goods from road to rail; and (iv) a slowdown in the improvements in vehicle energy efficiency: in recent years, engine efficiency gains have been completely erased by the increase in the weight of vehicles (with the surge in SUV sales in particular). In essence, these developments indicate the levers for reducing transport emissions: reducing the distances travelled, switching to less emitting modes (public transport, train) or non-emitting modes (cycling, walking), better filling of vehicles, choosing efficient, light, low-consumption vehicles... collective spatial planning and investment choices that precisely enable this reduction of distances travelled and the shift to less emitting modes. Pulling these levers is partly a matter of individual choices, but above all of collective choices at local, regional, national and even European level, since, for example, regulations regarding car manufacturers are decided at European level.
In the buildings sector, emissions are decreasing, but three times slower than expected in the pathway of the National Low-Carbon Strategy. This is due to: (i) a stagnation in the energy consumption of buildings; (ii) numerous but inefficient energy renovations; (iii) a delay in the elimination of the most high carbon heating systems, in particular oil heaters. The major lever in this sector is the acceleration of energy renovations of the existing building stock, by making efficient renovations, i.e. achieving very low energy consumption. Pulling this lever requires dealing with the issue of financing these energy renovations, but also developing a thermal renovation sector, and the necessary skills, so it is also a training and employment issue.
To complete the picture, let us address the issue of carbon sinks — forests and land use change. In recent years, sinks have weakened, although they still offset around 7% of territorial emissions. This weakening has two underlying causes. On the one hand, the artificialisation of soils continues, and artificialised soils store less carbon. On the other hand, changes in the forest sink (changes in forest area, forest stand growth and exploitation), while still capable of capturing CO2, did not allow to capture as much as in previous years. This change highlights a significant risk along the projected path towards carbon neutrality: that of forest resilience to climate change. With increased risks of fires, pests and diseases, whose spread is amplified by climate change, the permanence of the forest sink is threatened. Here the levers lie in stopping soil artificialisation, preserving the forest sink, changing agricultural practices to store more carbon in the soil.
The pathway of the National Low-Carbon Strategy mentioned so far involves the so-called "territorial" emissions of France, i.e. those that take place on French territory, but they do not represent the entire French responsibility in terms of emissions. First, they exclude emissions from international transport. These emissions from international transport, if added to territorial emissions, would "only" increase the total by 6% (75% of which correspond to non-domestic air transport, and 25% to non-domestic sea transport). However, in the absence of measures on international transport, and if the other sectors follow the projected pathways, they would become responsible for the majority of the remaining emissions in 2050. Hence the need for action.
Moreover, if we correct the territorial emissions of exports and imports, i.e. if we subtract the emissions occurring in the territory to produce goods that are exported and add the emissions occurring in other countries to produce goods that are imported into France, France's carbon footprint amounts to more than 700 million tCO2 equivalent per year, or nearly 60% more than the volume of territorial emissions. France's carbon footprint has stagnated since 2005.
There are wide disparities in the carbon footprint of household consumption (Figure 4). The level of wealth of an individual is the primary determinant of his or her emissions (other determinants being urban/rural location, age, etc.) As a result, the average carbon footprint of households in the highest income decile is almost three times higher than that of households in the lowest decile [Malliet 2020]. Within a decile, household carbon footprints can nevertheless vary significantly, and geographic inequalities — especially between urban, peri-urban and rural — are also significant.
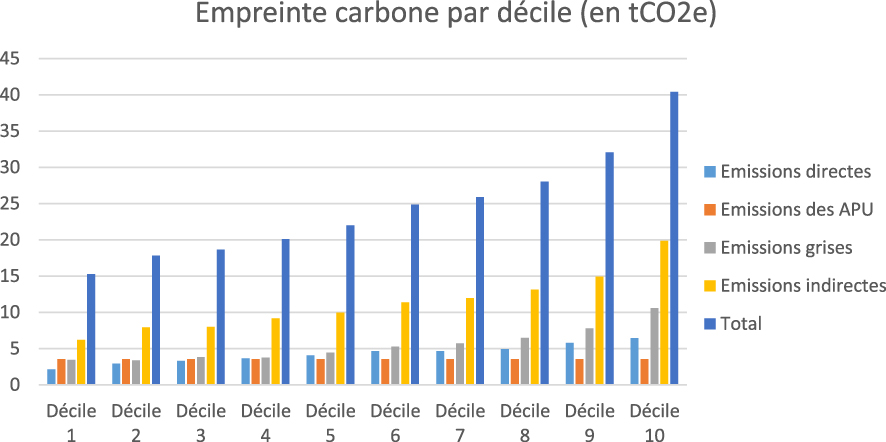
The carbon footprint of French households by income decile. The footprint is broken down into direct emissions (emitted at the time of consumption), indirect emissions (emitted during the production of the good or service consumed), grey emissions (induced by all activities upstream of the value chain), and Public Administration (APU) emissions. Footprints are calculated per household to account for compositional effects within the household. When considering individuals, the difference between the deciles is slightly reduced. Data: Malliet [2020]. Source: Guivarch and Taconet [2020].
Reducing greenhouse gas emissions implies a profound transformation of production and consumption patterns, travel and food systems. But this can also exacerbate inequalities,9 or create situations of energy poverty or poverty altogether. For instance, mitigation policies influence energy or food prices, with an impact on living standards. An increase in the price of fuel or transport is unfair to households that had to move away from areas where jobs and public transport are concentrated in order to afford housing. It has been shown, for example, that carbon taxation, as implemented in France and without any measure of redistribution of the revenue it generates, is regressive, i.e. the share of the household budget it represents decreases on average with household income — it therefore disproportionately affects the lowest income households [Berry 2019]. However, Berry [2019] has also shown that the redistribution of part of the revenue generated by carbon taxes can turn it into a progressive system and improve situations of energy poverty.
Consequently, to be fair, climate action must not neglect its own impact on inequalities, and the measures put in place must serve the broader goals of development, reducing poverty and inequalities, creating decent jobs, improving air quality and health.
Conclusion
In conclusion, it should be remembered that whatever the goal of stabilising the effects of climate change, carbon neutrality must be achieved. Additionally, it is never too late to reduce greenhouse gas emissions, and each emission reduction can prevent some of the impacts of climate change. However, as long as long-lived greenhouse gas emissions (primarily CO2) are positive, they continue to accumulate in the atmosphere and the longer mitigation actions are delayed, the greater the impacts of climate change. To achieve the same climate goal, the longer actions are delayed, the faster the rate of emission reduction will have to be. Delayed actions also mean continuing emissions-generating investments, which would represent even more stranded assets when mitigation actions are implemented.
Achieving the net-zero emissions target that France has set for itself for 2050 requires immediate and strong action, including the whole of society, for a fair transition. This involves all the actors and all our activities: how we travel, how we house and heat ourselves, how we produce and consume... It is a matter of implementing a transformation of all the major systems (energy, food, infrastructure) on a scale without historical precedent. The necessary mitigation actions are not marginal, not one-sided, and are not only individual. It is about focusing on actions that make it possible to move towards emission neutrality, collectively, in a fair and inclusive way.
There is no single miracle "recipe", but a combination of actions and instruments to be mobilised in a systemic and coherent way (carbon prices, regulations, investments, research and development, training, etc.). International climate negotiations organise cooperation between countries on the subject. But emission reductions come from national and local policies, measures and actions. Every action, every choice of consumption, production or investment, whether collective or individual, public or private, counts.
1See the full text of the Paris Agreement: https://unfccc.int/sites/default/files/french_paris_agreement.pdf
2Note that this "gap" between the ambition of the NDCs and the pathways consistent with the long-term goal of the Paris Agreement is not the only difference that exists. Indeed, Roelfsema et al. [2020] also highlight a gap in the implementation of NDCs: the assessment of mitigation policies and measures currently implemented in the different countries around the world shows that they would result in global emissions that are about 7 GtCO2-equivalent higher than the NDCs range. The policies and measures in place are therefore insufficient, on a global scale, to even achieve the ambition of the NDCs as announced.
3https://www.ecologique-solidaire.gouv.fr/strategie-nationale-bas-carbone-snbc
4See for example http://www.paris-equity-check.org
5The existing estimates for 2020 anticipate a reduction in global CO2 emissions in the order of 8% (https://www.iea.org/reports/global-energy-review-2020), and in the order of 5–6% for all greenhouse gases (https://www.carbonbrief.org/analysis-coronavirus-set-to-cause-largest-ever-annual-fall-in-co2-emissions). These first estimates — made in May 2020 — are obviously to be taken with caution given the significant uncertainties regarding the developments of the health and economic crisis in the remainder of 2020.
6The buildings sector here covers emissions from the use of buildings, while emissions from construction are included in the "industry" sector.
7See Annex to the High Council on Climate report "Climate, health: better prevention, better healing" https://www.hautconseilclimat.fr/publications/climat-sante-mieux-prevenir-mieux-guerir/
8See the High Council on Climate's 2019 annual report for a detailed analysis: https://www.hautconseilclimat.fr/publications/rapport-2019/
9See Guivarch and Taconet [2020] for a literature review on the links between inequality and climate change.