

1 Introduction
The year 2000 marked the 20th anniversary of the discovery of the first human retrovirus: human T-cell lymphotropic virus-I (HTLV-I) (see [1]). Its discovery has had several notable implications. First, this retrovirus provided clear proof of a relationship between viruses and cancer. Second, the obvious association of HTLV-I with a neurologic disease similar to multiple sclerosis (MS) created an opportunity to study the mechanisms that lead to chronic demyelinating disease. Finally, its identification clearly facilitated the discovery and isolation of the human immunodeficiency virus (HIV), which has caused a global epidemic of a rapidly progressing fatal illness: acquired immune deficiency syndrome (AIDS) [2].
Infection with HTLV-I is now a global epidemic, affecting 10 million to 20 million people. This virus has been linked to life-threatening, incurable diseases: adult T-cell leukemia (ATL) and HTLV-I-associated myelopathy/tropical spastic paraparesis (HAM/TSP). These syndromes are important causes of mortality and morbidity in the areas where HTLV-I is endemic, mainly in the tropics and subtropics [3]: Caribbean, southern Japan, Central and South Africa, and South America. The virus is also present in USA, especially in southeastern United States, in certain immigrant groups. There is neither a vaccine against the virus, nor a satisfactory treatment for the malignancy or the inflammatory syndromes. The main transmission routes of HTLV-I are sexual transmission, vertical transmission from mother to child, infection by blood transfusion, and needle-sharing among drug users [4]. Primary infection leads to a chronic infection that seems to last life-long. However, only a small fraction of infected individuals progress to disease, about 3% of infected people develop symptoms of ATL and another 3% develop symptoms of HAM/TSP. Coinfection with HTLV-I and HIV has been shown to accelerate the progression of AIDS [2,5,6], etc.
The transmission and dynamics of HTLV-I feature several biological characteristics that are of interest to epidemiologists, mathematicians, and biologists, see, for example, [5,7–13,20], etc. Like HIV, HTLV-I targets CD4+ T-cells, the most abundant white cells in the immune system, decreasing the body's ability to fight infection. Primary infection leads to chronic infection, the proviral load of which can be extremely high, approximately 30–50% [7]. Unlike in the case of HIV infection, however, only a small percentage of infected individuals develop the disease and 2–5% percent of HTLV-I carriers develop symptoms of ATL [14]. Also, there is very little cell-free virus in the plasma. Almost all viral genetic material resides, in DNA form, integrated within the host genome of infected cells. HTLV-I infection is achieved primarily through cell-to-cell contact [6].
HTLV-I is a single-stranded RNA retrovirus, the activity of which produces a DNA copy of the viral genome that is integrated into the DNA of the host genome. After this takes place, the latency period can persist for a long period of time. Latently infected cells contain the virus, but do not produce DNA and are incapable of contagion. When such cells are stimulated by antigen, they can become active and infect healthy cells. Actively infected cells may also convert to ATL cells [15].
Taking these factors into consideration, Stilianakis and Seydel [14] proposed a model that formulates a system of nonlinear differential equations that divides CD4+ T-cells into four compartments: uninfected CD4+ T-cells, latently infected cells, actively infected cells, and leukemia cells. An analogous model for HIV was proposed by Perelson et al. [16] and was simplified by Culshaw and Ruan [17] in their incorporation of a time delay to describe the time between infection of a CD4+ T-cell and the emission of viral particles on a cellular level. In general, delay-differential equations exhibit more complicated dynamics than systems of ODEs, since a time delay can destabilize equilibria. Discrete delays have been used to model the intracellular delay in HIV models. A gamma distribution delay has been considered a more realistic approach to model the intracellular delay (see [18] and references cited therein). Most recently, Banks et al. [19] developed methods for incorporating arbitrary variability for temporal delays in HIV pathogenesis into systems that cannot be reduced to a finite number of coupled differential equations. The importance of their method lies in the fact that delay can in fact be introduced into various stages of cellular mutation; from healthy to latently infectious, latent to actively infectious, and active to leukemic. This idea, however, is not pursued here.
In this paper, we first alter the classic model proposed by Stilianakis and Seydel [14] to distinguish, in terms of parameters, between contact and infectivity rates. This is done in order to take into account the probabilistic nature of infection (though stochastic modeling of HTLV-I infection, given the unusually high proviral load, has and should be pursued further). The existence and stability of the infected equilibrium are considered. We then incorporate a discrete delay to describe the time between the emission of contagious particles by actively infected cells and the infection of a CD4+ T-cell. In other words, we introduce a delay into the stage when the cell mutates from healthy to latent. The biological rationale for introducing a delay at this stage lies in the fact that there is a waiting period between the time when the virus contacts the cell and the time when the viral RNA is incorporated into the DNA of the host genome. Since the proviral load varies from patient to patient and since there is a direct correlation between the development of disease and proviral load [7], it would be logical to consider that during the delayed time some mechanism, by chance, intervenes to prevent or enhance the speed with which the cell will become latently infected. It would be interesting, then, to compare a stochastic model for HTLV-I infection, where cellular contact by RNA is a function of chance, with this model, since both try to account for the probabilistic nature of the infection.
The resulting model then is a system of four delay-differential equations. To determine the dynamics of the delay model, we use the results in Culshaw and Ruan [17] to obtain analytic conditions on the parameters under which the infected steady state is asymptomatically stable for all delay. Numerical simulations are carried out to illustrate the obtained results.
2 The ODE model
We first modify the classic model [14] for the system of non-linear differential equations to distinguish, in terms of parameters, between contact and infectivity rates. The resulting ODE model is:
| (2.1) |
To explain the parameters, we note that λ is the source of CD4+ T-cells from precursors, is the natural death rate of CD4+ T-cells, κ is the rate at which uninfected cells are contacted by actively infected cells. The parameter represents the rate of infection of T-cells with virus from actively infected cells. , and are blanket death terms for latently infected, actively infected and leukemic cells, to reflect the assumption that we do not initially know whether the cells die naturally or by bursting. In addition, α and ρ represent the rates at which latently infected and actively infected cells become actively infected and leukemic, respectively. ATL cells grow at a rate β of a classical logistic growth function. is the maximal number that ATL cells proliferate. All parameters are assumed to be positive constants.
In the absence of virus, the T-cell population has a steady-state value:
| (2.2) |
| (2.3) |
System (2.1) has two steady states: the uninfected steady state and the (positive) infected steady state , where:
| (2.4) |
Following Stilianakis and Seydel [14], all T-cell subpopulations at steady state must have non-negative values. If , which means that the proliferation rate of abnormal cells is higher than their death rate, disease may ensue. If , further behavior of the system depends on the basic reproduction number:
| (2.5) |
To discuss the local stability of the positive infected steady states for , we consider the linearized system of (2.1) at . The Jacobian matrix at is given by:
| (2.6) |
| (2.7) |
By the Routh–Hurwitz criterion, it follows that all eigenvalues of Eq. (2.7) have negative real parts if and only if
| (2.8) |
The infected steady stateis asymptotically stable ifand the inequalities in(2.8)are satisfied. This occurs if (a) , or (b) if .Proposition 1
For the parameter values given in Table 1, if . The contact and infectivity rates, κ and , are estimated by Stilianakis and Seydel [14] on the basis of parameter estimates known from the HIV infection process. Adjustments are made to take into account the particulars of HTLV-I viral transmission. We first take . Then all conditions in (2.8) are satisfied and the infected steady state is asymptotically stable. Numerical simulations show that trajectories of system (2.1) approach to the steady state (see Fig. 1). When , the steady state becomes , which is still asymptotically stable. Varying κ and (with ) will alter the numbers of uninfected CD4+ T-cells, infected cells, and leukemic cells. For example, fix and alter from 0.1 to 0.3, numerical simulations show that the number of healthy CD4+ T-cells decreases dramatically, while the numbers of latently infected cells and leukemic cells increase substantially (see Fig. 2).
Variables and parameters for contagion
| Parameters and variables | Values | |
| Dependent variables | ||
| T | uninfected CD4+ T-cell population size | 1000/mm3 |
| latently infected CD4+ T-cell density | 250/mm3 | |
| actively infected CD4+ T-cell density | 1.5/mm3 | |
| leukemic CD4+ T-cell density | 0 | |
| Parameters and constants | ||
| natural death rate of CD4+ T-cells | 0.6 mm3/day | |
| blanket death rate of latently infected CD4+ T-cells | 0.006/day | |
| blanket death rate of actively infected cells | 0.05/day | |
| death rate of leukemic cells | 0.0005/day | |
| rate uninfected CD4+ T-cells become latently infected | varies | |
| κ | rate infected cells are contacted | varies |
| β | growth rate of leukemic CD4+ T-cell population | 0.0003/day |
| α | rate latently infected cells become actively infected | 0.0004/day |
| ρ | rate actively infected cells become leukemic | 0.00004/day |
| maximal population level of leukemic CD4+ T-cells | 2200/mm3 | |
| λ | source term for uninfected CD4+ T-cells | 6/day |
| Derived quantities | ||
| CD4+ T-cell population for HTLV-I-negative persons | 1000/mm3 |
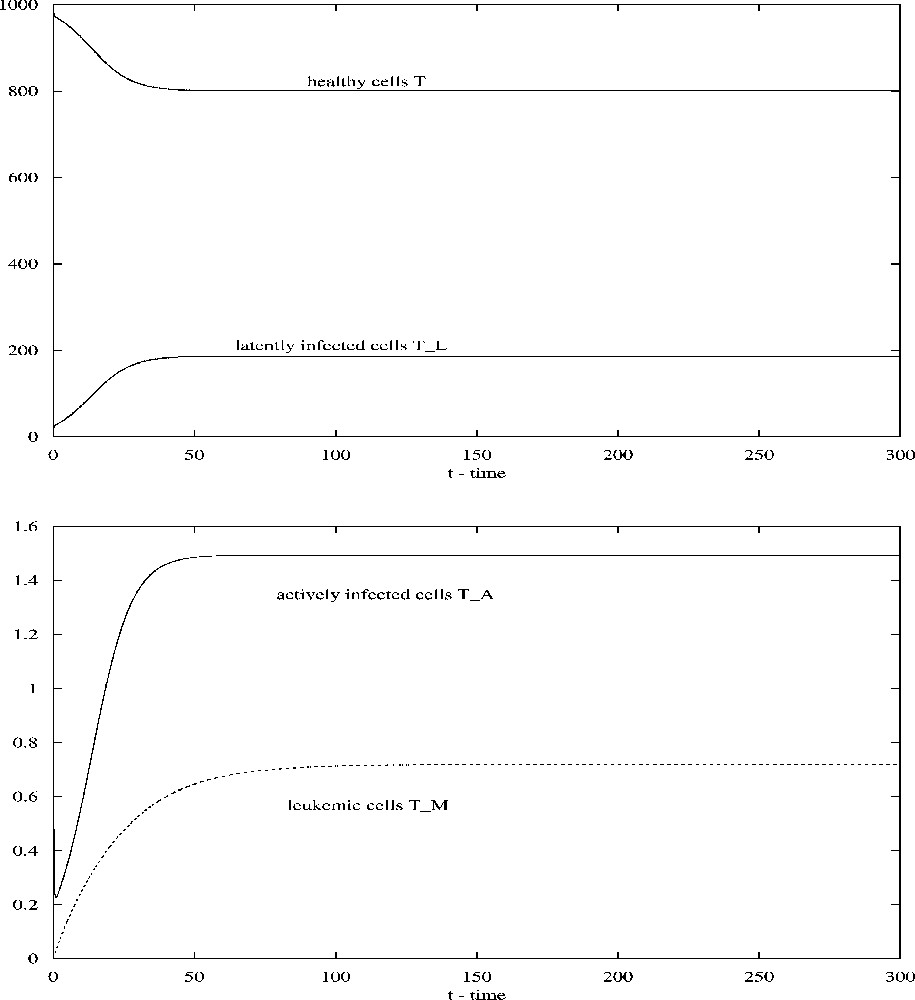
Solutions of system (2.1) converge to the steady-state values when ; all other parameters are given in Table 1.
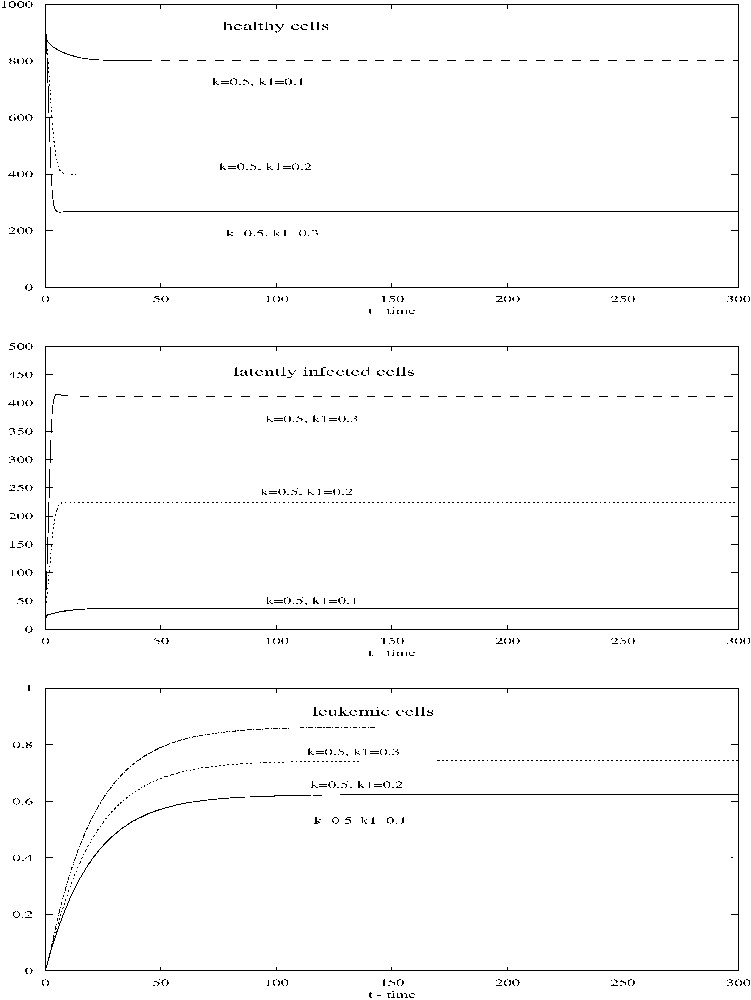
When κ=0.5, changes from 0.1 to 0.3, all other parameters being given in Table 1, the number of healthy CD4+ T-cells decreases while the numbers of latently infected cells and leukemic cells increase.
3 The delay model
In this section, we introduce a time delay into system (2.1) to represent the contagion eclipse phase. The model is given as follows:
| (3.1) |
We find, again, an uninfected steady state and an infected steady state , where and are the same as in Section 2, given by (2.4). Since the uninfected steady state is unstable when and , incorporation of a delay will not change the instability. Thus, is unstable if , which is also the feasibility condition for the infected steady state .
To study the stability of the steady states , define
| (3.2) |
| (3.3) |
Following the arguments of Culshaw and Ruan [17], we have the following proposition. Suppose thatProposition 2
Then the infected steady stateof the delay model(3.1)is asymptotically stable for all.
Notice that, for the parameter values given in Table 1, all conditions in Proposition 2 are satisfied. Thus, the infected steady state is asymptotically stable for all . Take , and other parameter values given in Table 1, numerical simulations show that the infected steady state is asymptotically stable (see Fig. 3). We can see that the time delay does not induce instability and oscillations in system (3.1) for the parameter values given in Table 1.
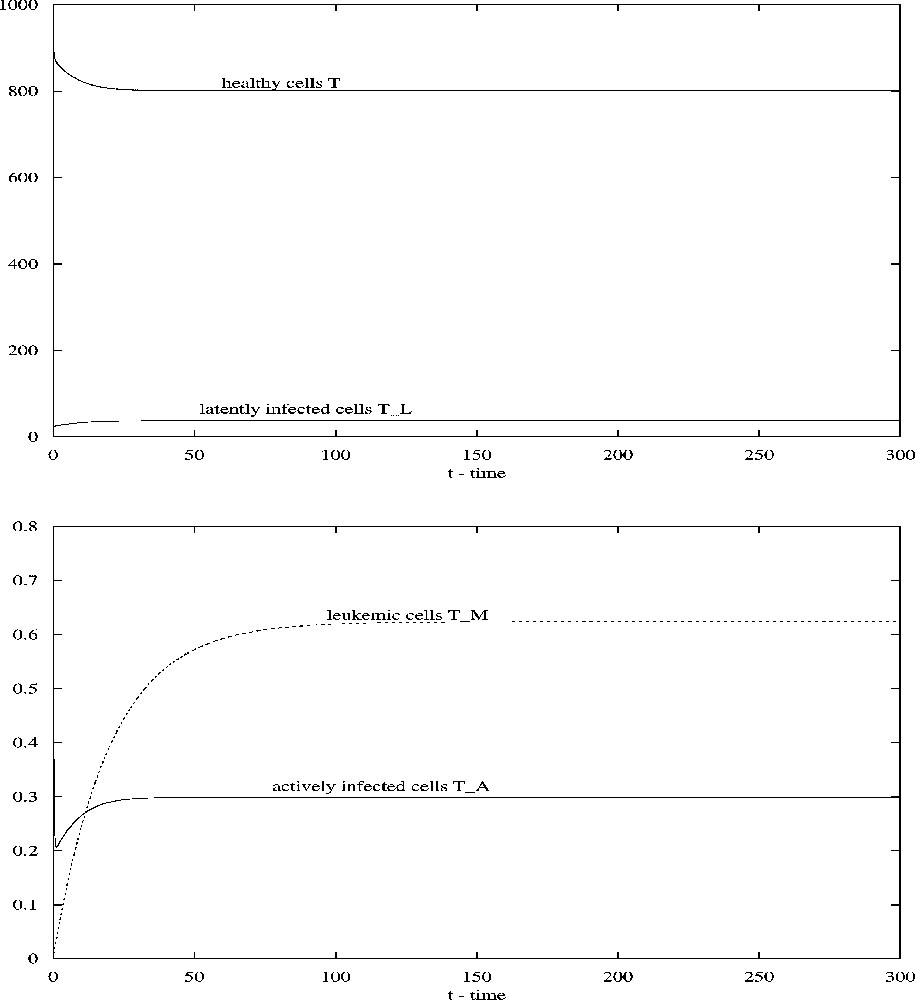
When , all other parameters being given in Table 1, the steady state of system (3.1) is asymptotically stable.
4 Discussion
Incorporating a time delay into the HTLV-I infection model reproduces the mathematics of the incorporation of delay into analogous HIV models, but because contagion is achieved cell-to-cell, there are varying biological repercussions.
We first modified the ODE model proposed by Stilianakis and Seydel [14] to distinguish between contact and infectivity rates. As they did with their model, we obtained a restriction on the number of actively infected cells in order for infection to be sustained. Under this restriction, the system has a positive equilibrium, the infected steady state. By using stability analysis we obtained sufficient conditions on the parameters for the stability of the steady state. For parameter values reported in [14] (), the stability conditions are all satisfied and numerical simulations confirmed the analysis. Confirming the biological intuition, when infectivity rate is less than the contact rate, the endemic equilibria of infected cells are achieved at an equal or lower level than when both are equal.
We then introduced a time delay into the model which describes the time between infection of a CD4+ T-cells and the emission of proviral particles by actively infected cells. The same restriction on the number of actively infected cells is required. By analyzing the transcendental equation, we used the results of Culshaw and Ruan [17] to derive stability conditions for the infected steady state in terms of parameters and independent of delay. Using the parameter values in Table 1, we carried some numerical simulations which confirmed the analysis. We observed that the time delay does not induce instability and oscillations in the model.
Since the majority (about 95%) of HTLV-I infected individuals develop no associated disease, the current view of HTLV-I is of a rather inactive infection. The virus is thought to be transcriptionally silent, replicating almost entirely by mitosis of the host cell. Our study confirms that HTLV-I is largely latent. The results on asymptotic stability of the infected steady state might be helpful in understanding the chronic infection of the virus.