

1 Introduction
One of the fundamental problems in biological classification is the question how to interpret the phylogenetic information contained in a collection of different phylogenetic trees that classify the same set of taxa. One reason for the uncertainty about the true phylogenetic tree is that different choices for molecular sequences often point to different trees, called gene trees or protein family trees (see e.g. [1–9]). Finding the best way of combining the information contained in numerous different gene trees for the same set of species remains an open problem in contemporary biology.
It is textbook knowledge that a range of methods has been proposed to construct trees from genetic sequences. At one end of the spectrum lie the parametric models, such as the maximum-likelihood method. Many researchers believe that as more data become available, the mutation rates will be known with better accuracy and these models will be better justified. At the other end of the spectrum of tree building methods lie the non-parametric approaches, such as the parsimony. The distance-based methods lie in between these two extremes. In this approach, the mutation model is parametric (with very few parameters considered) and the tree-building procedure is non-parametric. Distance-based methods are very popular, because the problem of computing the best tree for two other mentioned methods (maximum-likelihood and parsimony) is computationally difficult.
We have decided to enrich the parameter-space of distance-based methods by applying the new approach to the protein-sequence alignment, which takes into account the context-dependence of the amino acid substitution pattern. Several trees are reconstructed for protein families based on contextual similarity data. This set of trees is compared with the one obtained by standard methods. Our main goal was to verify the following conjecture:
The contextual model should yield a more consistent set of trees.
A number of authors (e.g., [5,8]) have proposed different methods to investigate the consistency of the set of trees. Most of them aim at the construction of one tree (so-called supertree), which represents the set of source trees. Because existing supertree methods suffer from serious limitations (see, e.g., [9]), we have decided to work with several different gene trees.
In order to estimate the consistency of a set of trees, we have tested some mathematical properties, like pairwise distances between trees or common homeomorphic subgraphs. The results obtained are analysed for both contextual and non-contextual trees. All computational experiments, justified in some cases by a theoretical analysis, show more consistent results for contextual trees, which is in agreement with our conjecture.
This paper is organised as follows. At the beginning we present briefly the main ideas behind the contextual alignment model, then we describe the methods used in our analysis. The results of several computational experiments are analysed in Section 3 and followed by conclusions and further research.
1.1 The model of contextual sequences alignment
It is well known that the role an amino acid plays at a site in a protein depends on its environment. The evidence of this context-dependency contrasts with widely-used sequence comparison models, which assume the independence of the evolution for different sites. Recently, some research was done in the field of non-simplified models of DNA sequence evolution [10,11]. The authors consider a probabilistic model, in which a molecular sequence undergoes random changes due to substitutions, whose probability is context-dependent. This leads to a Markov chain model of quite complicated structure.
The contextual alignment model defined in [12] can be viewed as an algorithmic counterpart of these works, which is also suitable to analyse the protein sequences. It extends the classical alignment model, with the intention to bring it a step closer to the biological reality without sacrificing its algorithmic properties. The set of operations is the same as that of the classical non-contextual alignment model, but the score function of a substitution changes. In our model, the score of a substitution depends on the surrounding letters in the sequence, too. The score for insertions and deletions is inherited from the classical model. As it is easy to see, in the contextual-alignment model, the score of a set of operations depends on the chronology of operations. On the other hand, the operations performed at distant fragments of the sequence are independent, in the sense that neither of them changes the context of the other. Particularly, it is sufficient to have two identical and adjacent columns in the alignment; they constitute a ‘wall’ separating two independent regions. Operations in independent regions can be performed in any order. Therefore, there are typically many orders that give the maximal score. Thus, the algorithms find not only an optimal set of operations, but also reconstruct a precise characterisation of the set of all possible orders (we call them admissible orders), in which the operations may be performed to yield the maximal score. More detailed study of the structure of optimal alignments and the description of efficient algorithms constructing them are included in [12,13].
1.2 Contextual substitutions tables
The contextual alignment algorithm assumes, as an important part of its input data, a contextual scoring table, providing the score for every possible substitution in every possible context. In [14], the procedure for constructing the family of contextual matrices has been proposed. It is based on the methodology introduced by [15]. The entries in the matrices are log-odds of the observed and expected mutation rates between given pairs of amino acids in a given context. For readers interested in this topic, the matrices parameterised by different clustering constants can be found at: http://www.mimuw.edu.pl/~aniag/ALIGN/TABLES.
1.3 Example
Consider the following example, that explains how the relative order of two substitutions applied to the same sequence affects the score, if the contextual substitution table from [14] is used. On the left path, the substitution is followed by the substitution . In the second scenario, the order of these two substitutions is inverted: is followed by . The summarized score for the left path is −2.1, while for the right path it is −3.2. This difference is caused by different contexts for the considered substitutions (e.g., the substitution is performed in the context A–D on the left path, while for the right path the context for this substitution is A–H, i.e. the left context is changed from D to H).
2 Methods
2.1 The dataset
We decided to use the database of Clusters of Orthologous Groups of proteins [16,17], COG in short. It consists currently of 3307 COGs, including 74 059 proteins from 43 genomes of bacteria, archaea and the yeast Saccharomyces cerevisiae. COG database represents an attempt to a phylogenetic classification of the proteins encoded in complete genomes. Each COG includes proteins that are thought to be orthologous, i.e. connected through vertical evolutionary descent.
Two groups of COGs are considered. The first one consists of 12 gene families of different tRNA synthetases. They are functionally related in contrast to the second group investigated here which is functionally more diverse (8 COGs). It includes DNA polymerases as well as ribosomal proteins and CDP-diglyceride synthetases.
These two sets are selected from the list of 85 COGs, in which all organisms are represented (i.e. each COG contains at least one protein from each genome). Our dataset is listed in Table 1.
Two groups of COGs considered
| Group I | Group II | ||
| No. | COG name | No. | COG name |
| 0013 | Alanyl-tRNA synthetase | 0013 | Alanyl-tRNA synthetase |
| 0442 | Prolyl-tRNA synthetase | 0185 | Ribosomal protein S19 |
| 0016 | Phenylalanyl-tRNA synthetase α | 0201 | Preprotein translocase subunit |
| 0072 | Phenylalanyl-tRNA synthetase β | 0202 | DNA-directed RNA polymerase |
| 0162 | Tyrosyl-tRNA synthetase | 0361 | Translation initiation factor |
| 0018 | Arginyl-tRNA synthetase | 0575 | CDP-diglyceride synthetase |
| 0124 | Histidyl-tRNA synthetase | 0592 | DNA polymerase IIIβ subunit |
| 0143 | Methionyl-tRNA synthetase | 0636 | FOF1-type ATP synthetase |
| 0495 | Leucyl-tRNA synthetase | ||
| 0525 | Valyl-tRNA synthetase | ||
| 0172 | Seryl-tRNA | ||
| 0441 | Threonyl-tRNA synthetase |
2.2 Pairwise alignments inside COGs
In the first phase of the experiment, the protein sequences from each COG have been pairwise locally aligned using the standard Smith–Waterman algorithm and the contextual alignment procedure from [12]. The statistical significance of the obtained alignments have been computed using the method from [18], which has been also adapted to the contextual setting.
2.3 Hierarchical clustering
Several methods to derive the pairwise evolutionary distance (sometimes called difference score) from alignment scores are proposed (see, e.g., [19]). Being aware of the drawbacks of all these approaches (see [20] for a detailed discussion) we decided to use two independent methods.
The first one is based on the notion of statistical significance considered for local pairwise alignments in [18]. Roughly speaking, for a given pair of sequences, this value corresponds to the probability that two random sequences of the same length and amino acids composition have local similarity score higher then our pair. The statistical significance for two sequences u and v with length n and m having local similarity score is given by the formula:
A second transformation between scores and distances is proposed in [22]. Assuming that is the local similarity score between the sequences u and w, then their distance is defined via:
Inside the 20 orthologous gene families considered in our analysis, majority contains only one gene per species. In a few cases the family contains more than one gene (paralogous genes) per taxon. Only one of the paralogs is retained, while the more distant one is excluded from our analysis (e.g., APE0809 is excluded, while APE0117 is retained in the COG0441). In all cases, the paralogs coding in yeast for mitochondrial t-RNA synthetases have been eliminated. All trees are reconstructed by a Neighbour-Joining algorithm implemented in PHYLIP package [23].
3 Results
We have analysed the groups of trees constructed from contextual and non-contextual data. Our main goal has been to examine whether the use of contextual model of sequence alignment has an influence on the phylogenetic clustering.
Adopting the widely-accepted assumption that the vertical descents dominates horizontal gene transfer (see, e.g., [24] for a recent discussion) we can formulate the following conjecture:
Set of trees reconstructed in contextual model should be more consistent (i.e. the trees should share more common structure).
There exist several methods to investigate the consistency of the set of trees. Most of them aim at the construction of one tree (so-called supertree or consensus tree), which captures all non-conflicting information contained in the set of trees.Supertree and consensus tree methods suffer however from inherent mathematical limitations (see [9]). More precisely, one can prove the non-existence of the method that possesses simultaneously the desirable properties, like:
- • the method is independent of the order of the input trees;
- • the renaming of all the species in the input trees can be reversed by the appropriate renaming of all species in the output tree;
- • if the set of input trees is compatible, the output tree displays all of them.
The existing methods to combine trees are rather heuristic. The widely-used method is to re-code trees by characters and apply some standard tree reconstruction algorithm like maximum parsimony or Neighbour-Joining [2,5]. The verification of already constructed supertree is often based on some ‘biological feeling’ (especially in the case of bacterial phylogeny, when no different molecular data are available).
Having all mentioned limitation in mind, we have decided to examine also the whole family of species trees, not only a single super- or consensus tree.
To estimate the consistency of the set of trees, we have calculated all pairwise distances between trees. These are compared for both contextual and non-contextual trees. All computational experiments (parameterised by different tree metrics) yield better results for contextual trees than for non-contextual ones, in agreement with our conjecture.
The single tree derived from the set of trees has been also considered in two settings: Adams consensus and maximum agreement subtree. The outcomes of experiments are supported by probabilistic analysis, which justifies the significance of the superiority of the contextual approach.
In all the computational experiments mentioned above, we do not test any biological hypothesis, but only some mathematical properties (like common topologies or pairwise distances) for the set of trees. In contrast to this approach, we start the presentation of our results with a short example, which deals with the evolution of proteobacteria.
3.1 A biological example
In order to illustrate the rationale used to compare various types of alignments and the derived phenograms, an example of application to bacterial phylogeny may be of interest. We have analysed a set of trees (phenograms) constructed for several COGs in the contextual and non-contextual setting. We have been interested in the evolution of two groups of bacteria: α proteobacteria (CauCr = Caulobacter crescentus, MesLo = Mesorhizobium loti, RicPr = Rickettsia prowazekii) and proteobacteria (HaeIn = Haemophilus influenzae, PasMu = Pasteurella multocida, Ecoli = Escherichia coli K12, VibCh = Vibrio cholerae, PseAe = Pseudomonas aeruginosa, XylFa = Xylella fastidiosa, NeiMa = Neisseria meningitidis MC58, NeiMb = Neisseria meningitidis Z2491) together with the Buchnera (Buchn) species. It is generally believed that both groups are well clustered and most importantly Buchnera should be monophyletic with the proteobacteria family (see [25] for a recent discussion). To define a measure of evolutionary closeness, we consider the subtree rooted at the most recent common ancestor (MRCA) of the considered family (MRCA subtree). The MRCA subtree contains as leaves all members of our family and, in the ideal case, nothing more. Now, to distinguish between the quality of trees that describe the evolution of proteobacteria, we count the number of leaves that have to be pruned from MRCA subtree, because they do not belong to the considered family. The smaller is the number of leaves to be pruned, the better is the fit between hypothesis and results.
Table 2 summarizes our results. The entries correspond to the numbers of leaves that have to be pruned. In the first column, the number of COG families is given, then in the consecutive columns: the results obtained for the non-contextual tree based on multiple alignment (as presented at COG web pages), the results for tree based on non-contextual pairwise alignment data and the results for tree based on contextual pairwise alignment data. In all protein families, but one, the contextual data give monophyletic results (0 leaves pruned), while in non-contextual and and in multiple alignment, the majority () of families is inconsistent with the monophyletic origin of proteobacteria. In conclusion, the evolution of these protein families, as judged by the contextual approach, is more consistent with the rRNA phylogenetic tree [25].
The evolution of proteobacteria
| β, γproteobacteria | |||
| COG family | COG multiple alignment | non-contextual pairwise alignment | contextual pairwise alignment |
| 0072: Phenylalanyl-tRNA synthetase β | 14 | 26 | 0 |
| 0016: Phenylalanyl-tRNA synthetase α | 13 | 17 | 0 |
| 0592: DNA polymerase IIIβ subunit | 2 | 11 | 0 |
| 0636: FOF1-type ATP synthetase | 0 | 0 | 0 |
| Σ | 29 | 54 | 0 |
| α proteobacteria | |||
| 0072: Phenylalanyl-tRNA synthetase β | 0 | 33 | 0 |
| 0016: Phenylalanyl-tRNA synthetase α | 0 | 0 | 0 |
| 0592: DNA polymerase IIIβ subunit | 9 | 23 | 25 |
| 0636: FOF1-type ATP synthetase | 24 | 0 | 0 |
| Σ | 33 | 56 | 25 |
3.2 Pairwise distances inside a set of trees
Several distance models for evolutionary trees have been proposed in the literature (see, e.g., [4]). From the computational point of view they fall into two categories: those model, in which the distance between trees can by computed efficiently (i.e. in the polynomial time) and the second group of models for which the approximation approach is necessary (because computing the distance in such a model is NP-hard).
For our analysis, we have chosen several methods to measure the degree of dissimilarity for a set of trees. These methods are:
- • the partition metric treats trees as a set of clusters, it measures the amount of different clusters between trees. It is easy to compute, but its resolution is rather poor (two trees differing solely in the position of one taxon can be maximally different);
- • the Nearest-Neighbour Interchange distance (NNI) is defined in terms of transforming one tree into another. It counts the minimum number of operations (called nearest neighbor interchanges) required for such a transformation. The main disadvantage of this approach is that no exact, efficient algorithm for NNI distance exists. In our experimental study we use several approximations proposed in the COMPONENT package [26];
- • the Maximum Agreement Subtree (MAST) of two or more trees is an identical subtree of maximal size that can be obtained from all considered trees by pruning leaves with the same label. There exists an efficient algorithm finding MAST for two trees [7] and for more trees of bounded maximal degree. We can consider the distance between two trees as the number of leaves removed to obtain MAST.
3.2.1 The partition distance
The Tables 3–6 present the outcome of computing all pairwise partition distances for all trees inside each considered set. The results for cladograms (i.e. trees built from significances of scores) are in agreement with the same experiment performed on trees with Linial's distance transformation (values in parentheses).
| 8 COGs | 12 t-RNA synthetases | |||
| context | non-context | context | non-context | |
| min | 24 (24) | 22 (28) | 24 (32) | 34 (34) |
| max | 46 (50) | 46 (56) | 56 (58) | 62 (62) |
| ave. | 34 (39) | 35 (44) | 44 (45) | 50 (48) |
| st. dev. | 6 (7) | 6 (8) | 6 (6) | 6 (6) |
| 8 COGs | 12 t-RNA synthetases | |||
| context | non-context | context | non-context | |
| min | 17 (18) | 18 (26) | 15 (24) | 28 (27) |
| max | 46 (55) | 49 (66) | 82 (82) | 83 (88) |
| ave. | 30 (36) | 32 (44) | 49 (51) | 55 (56) |
| st. dev. | 8 (12) | 7 (13) | 11 (13) | 11 (13) |
| 8 COGs | 12 t-RNA synthetases | |||
| context | non-context | context | non-context | |
| min | 10 (13) | 14 (14) | 17 (14) | 18 (14) |
| max | 26 (26) | 25 (28) | 28 (29) | 30 (30) |
| ave. | 18 (20) | 20 (22) | 23 (22) | 24 (24) |
| st. dev. | 4 (4) | 3 (4) | 3 (4) | 3 (3) |
| 8 COGs | 12 COGs | |||||
| Partition | NNI | MAST | Partition | NNI | MAST | |
| ave. | 75.8 | 132 | 30.6 | 75.7 | 135.5 | 30.9 |
| st. dev. | 0.6 | 7.7 | 0.9 | 0.6 | 8.1 | 1.05 |
In both cases, the contextual models yield to more consistent set of trees. For example, the average over all pairwise distances are smaller. The differences are not very big, but, more importantly, contextual data give always better results.
3.2.2 The NNI distance
See Table 4.
3.2.3 MAST distance
See Table 5.
3.2.4 Distances in a set of random trees
The results from above can be compared with simulations, which have been done for a set of randomly generated trees of the same cardinality and with the same number of leaves. The outcomes in Table 6 are obtained as an average from 300 simulations. It can be seen that NNI and partition metrics discriminate better cognate trees from random ones, while the MAST metric is less informative. In Section 3.4, a more resolving application of MAST is described.
3.3 Consensus methods
To express the degree of agreement between cladograms, it may be sometimes useful to combine the phylogenetic information from two or more trees into one ‘consensus’ tree. Such a tree is a summary of how well the original trees agree. A number of different types of consensus trees has been proposed; each is calculated differently to answer different kinds of questions. Each summarizes common or average relationships among the original set of trees.
Unfortunately, consensus methods are of limited value: large disagreement among trees results in completely unresolved consensus tree. In our study, we decided to compare Adams consensus trees [1] calculated for both contextual and non-contextual groups of trees.
Adams consensus tree is characterized by the notion of nesting. For A and B being the subsets of the set of leaves of some phylogenetic tree, we say that A nests in B if the most recent common ancestor of A is a proper descendant of the most recent common ancestor of B. For a family of trees , sharing the same set of leaves, Adams consensus tree is defined as a unique phylogenetic tree on the same set of leaves that satisfies the following:
- (A1) let A and B be subsets of the set of leaves. If A nests in B in the tree for all , then A nests in B in ;
- (A2) let C and D be clusters of , such that C nests in D in , then C nests in D in each for all .
Adams' consensus tree is particularly useful for identifying common tree structure, when one or more taxa have very different positions in the set of trees. In Fig. 1, we present as an example Adams' consensus trees for two sets of 8 COGs (contextual vs non-contextual) based on statistical significance [18]. Notice that the phylogeny of β, γ proteobacteria is more consistent in the contextual alignment tree than in the non-contextual one. Similar consensus trees are also constructed for groups of trees based on Linial's distances.
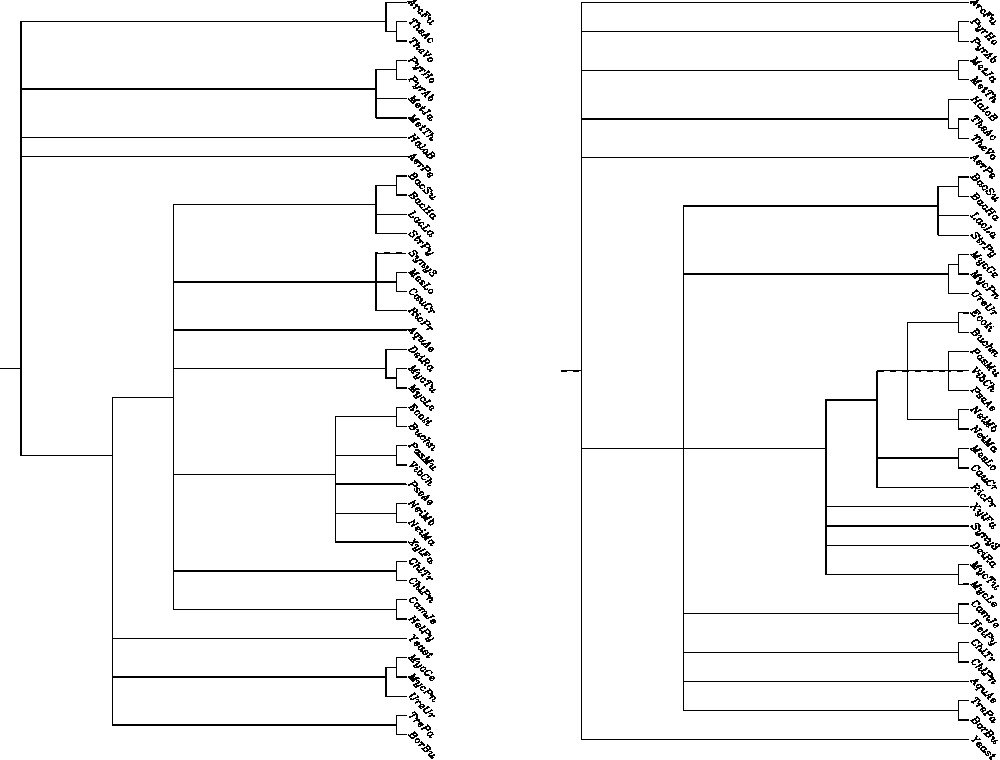
Contextual (left) vs non-contextual (right) Adams consensus for 8 COGs cladograms.
We propose a new approach to measure the quality of consensus trees. The idea of consensus tree is to capture as much common structural information of considered trees as possible. Hence better (more informative) trees should differ significantly from the ‘bush’ or null tree (star tree).
Consider the following characteristic of a rooted tree with n leaves: the integer vector is called the level density vector if and is equal to the number of leaves on the jth level of the tree (the root level is counted as level 0). For example, for Adams' consensus trees of 8 COGs build from contextual and non-contextual data (Fig. 1), the level-density vectors are the following:
Consider the measure Ψ associated with the level-density vector :
- • it is not sensitive to the tree balance, i.e. all completely resolved trees are equally informative (), contrary to all measures whose calculation is based on summing the size of clusters;
- • it takes into account the size and the height of the split;
- • it is monotonous, i.e. while considering Adams consensus for several source trees, the measure of consensus tree cannot exceed the maximum over the source trees.
3.4 MAST for the set of trees
The algorithm described in [7], implemented in PAUP phylogeny software package [29], computes the MAST of a set of leaf-labelled trees. The comparison of these trees obtained for the contextual and the non-contextual model shows significant differences. Let us consider two pairs of trees being MASTs for the set of 8 cladograms (Fig. 2) and phenograms, i.e. trees based on Linial's distance (Fig. 3). The contextual MAST tree has more leaves than its non-contextual counterpart (13 leaves vs 9 leaves in the case of cladograms, and 10 vs 7 in the case of phenograms). The probabilistic analysis below shows that these differences are indeed significant, when compared with the expected size of MAST for the set of given numbers of trees. Moreover, the contextual approach results in consistent evolutionary classification of β-proteobacteria (Neisserias) and mycoplasmas, which are absent in the right-hand tree.
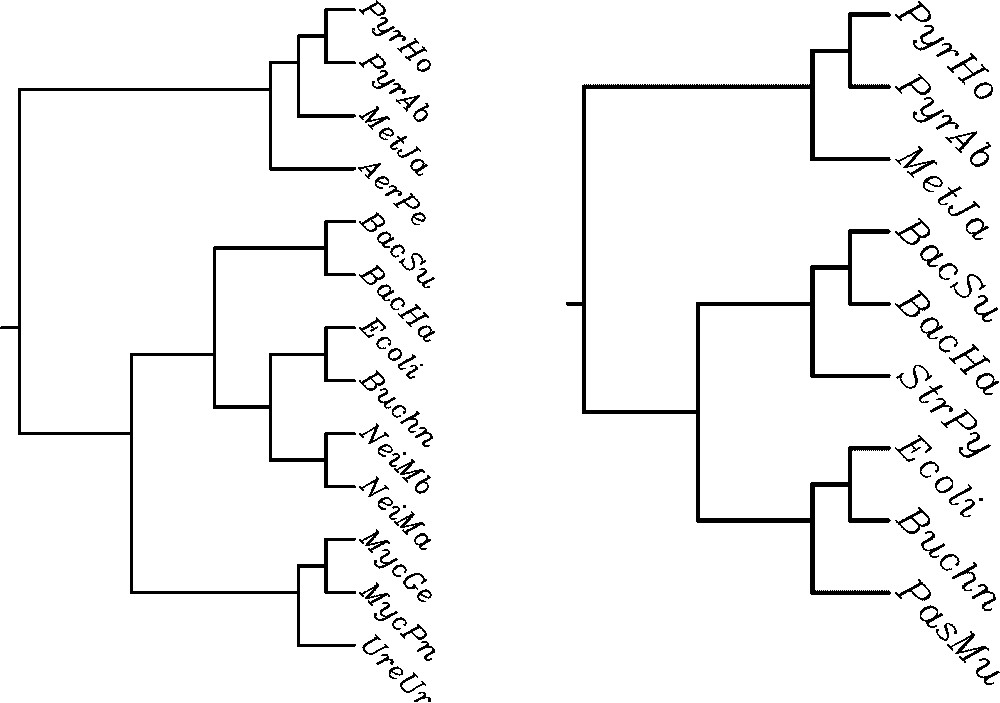
MAST for contextual (left) and non-contextual (right) cladograms.
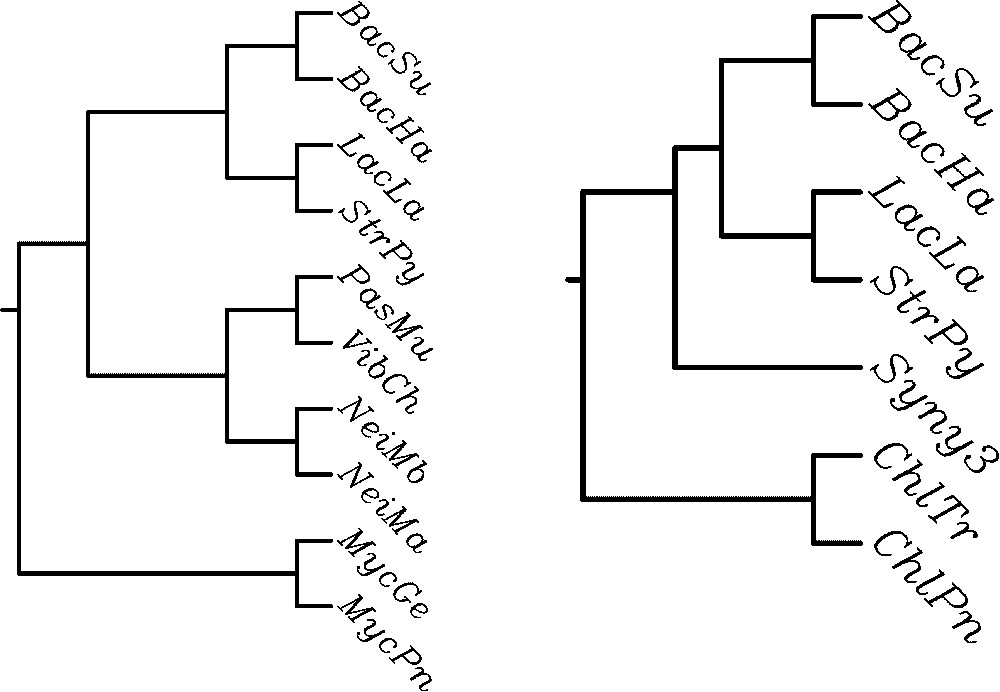
MAST for contextual (left) and non-contextual (right) phenograms.
3.5 The significance of the size of MAST
In this section, we give an estimation of the expected size of MAST for a given number of random trees. We consider the uniform model, in which each labelled-rooted tree with n leaves is assigned an equal probability: , where is the number of rooted trees with n labelled leaves. Denote by:
The number of pairs of n-leaf trees having agreement subtree (common homomorphic subtree) of size at least k (i.e. with k leaves) is given by the formula:
| (1) |
The expected size of MAST for random trees
| # of trees | ||||||||||
| 3 | 4 | 5 | 6 | 7 | 8 | 9 | 10 | 11 | 12 | |
| # of leaves | ||||||||||
| 10 | 3.91 | 3.06 | 3.01 | 2.52 | 2.16 | 2.05 | 2.01 | 2.00 | 2.00 | 2.00 |
| 20 | 5.04 | 4.01 | 3.09 | 3.01 | 3.00 | 2.52 | 2.17 | 2.05 | 2.02 | 2.01 |
| 30 | 5.68 | 4.12 | 3.54 | 3.04 | 3.00 | 3.00 | 2.62 | 2.21 | 2.07 | 2.02 |
| 40 | 6.18 | 4.57 | 4.00 | 3.12 | 3.01 | 3.00 | 3.00 | 2.50 | 2.17 | 2.05 |
| 50 | 6.95 | 5.02 | 4.02 | 3.30 | 3.02 | 3.00 | 3.00 | 2.99 | 2.33 | 2.11 |
| 100 | 8.48 | 6.01 | 4.62 | 4.00 | 3.34 | 3.02 | 3.00 | 3.00 | 3.00 | 2.91 |
| 150 | 10.02 | 6.26 | 5.01 | 4.05 | 4.00 | 3.12 | 3.01 | 3.00 | 3.00 | 3.00 |
| 200 | 10.94 | 7.02 | 5.10 | 4.20 | 4.00 | 3.38 | 3.03 | 3.00 | 3.00 | 3.00 |
The expected size of a MAST for two random trees was experimentally estimated in [30]. The authors also cite there some values obtained from the analytical estimations, which are not given. In contrast to them, analytical bound derived here work for several trees and are very close to the values obtained from simulations.
The analysis above readily confirms the significance of our results for contextual trees compared with non-contextual ones. The difference of 4 leaves in the case of MAST for 8 cladograms appears really large, when we look at the expected size of a MAST for 8 random trees which is less than 3.
4 Conclusions and further developments
It is clear that the experimental analysis described in this work is just a beginning and cannot be treated as a definitive answer. Various improvements and another experiments can be envisaged. Particularly, more COGs can be considered, different distances studied, supertree approaches proposed in [5] or [8] can be examined.
It would be also very interesting to check whether the Gap Alignment approach, described e.g. in [31], can be applied in the contextual setting. In this approach, phylogenies are reconstructed based only on the presence and evolution of gap-containing regions in the sequences. The analysis of gap-trees derived from contextual alignments seems to be an interesting extension of our work.
However, in view of the results presented in this work, we conclude that the concept of contextual approach, which improves albeit modestly but nevertheless systematically the consistency of evolutionary changes in protein sequences, should be fruitful in phylogenetic studies.
Some possible extensions of our analysis are:
4.1 Duplication distance
Widely studied approach to explain the discrepancies among differents gene trees is based on the notion of reconciliation [32]. In this formulation, one considers appropriate tree-mapping, which recovers all duplication events. More ambitious models take into account the phenomena of horizontal transfer. The problem is in general NP-hard for several gene trees, however promising approximate approaches are under study. It would be interesting to build and then to compare the reconciled species trees resulting from our families of gene trees.
4.2 Contextual multiple alignment
In [33], the relaxation of the contextual model was proposed, which gives the possibility to consider the multiple alignments. The effective progressive multiple alignment algorithm has been developed. Preliminary results obtained for the BaLIBASE benchmark alignments database are very promising. We plan to continue our analysis for families of trees build from contextual multiple alignment data (by parsimony and maximum-likelihood methods).
Acknowledgments
This work was partially supported by E.C. contract No. ICA1-CT-2000-70010 (EMBEU) of the IBB PAS Centre of Excellence in Molecular Biotechnology and by the Polish Research Council KBN grant 7 T11 F016 21. A. Gambin was also supported by the NATO science fellowship and the postdoctoral fellowship from the French CNRS within the framework of the ‘Centre franco-polonais de biotechnologie des plantes’.