

1 Introduction
Furchgott demonstrated the existence of the endothelial-derived relaxing factor (EDRF) in 1980 [1]. He observed the disappearance of vasodilatation after elimination of the endothelium by rubbing the internal surface of the rabbit aorta. A bioassay, using another aortic strip without endothelium as detector of vasodilatation, permitted to observe the presence and the intensity of the action of EDRF, but was not able to identify it. The half-life and properties of EDRF were discovered using this bioassay. EDRF is unstable with a constant half-life 3–5 s [2]. It is destroyed by reducing agents and possesses a carbonyl group [3]. It does not react with haemoglobin to form a nitroso-haemoglobin [4]. It is retained by cationic resin [5]. In the 1980s, it was demonstrated that the enzyme, which produced EDRF, gave citrulline and nitrite from l-arginine. Moncada and Ignarro postulated simultaneously that nitric oxide (NO), a gas, might be EDRF [6,7]. Despite the fact that NO had not the properties found by the original bioassay [3–5], it was thought to be EDRF. To explain many pharmacological properties that were not compatible with NO, the concept of nitroxyl (NO−) and nitrosonium (NO+) was invented later. This was ‘bad’ and ‘good’ NO [8]. But chemists demonstrated that the nitrosonium ion is changed into nitrite within a microsecond [9]. Nitroxyl is protonated as HNO at physiological pH and dimerised into nitrous oxide N2O [10]. The sole direct method to detect and validate the NO theory was voltammetry with a ‘selective’ microelectrode. In NO-synthase (NOS), NO microelectrodes were unable to detect NO without adding superoxide dismutase (SOD), which can also reduce nitrite into NO [11]. Despite the fact that microelectrodes found NO at the trace level or under the detection limit (nM) in various tissues, NO was considered as EDRF by most biologists. But for other researchers, due to its controversial pharmacological properties, the true nature of EDRF is still a matter of debate.
In the eighties, reductive differential pulse voltammetry (RDPV) was used for the first time in vivo for pharmacokinetic and diffusion studies of antibiotics and anticancerous drugs in rat brain and Aplysia neurons with fine quantitative results [12,13]. RDPV with microelectrodes was very potent for the detection and the quantification of nitroso-compounds. These studies showed in vivo an endogenous sole peak at vs Ag/AgCl. The identification of the substance, which gave this peak as NA, was firstly realised by electrochemical procedure, then secondly by chemical method using the Diels–Alder reaction and mass spectrometry [14,15]. NA was the first molecule discovered in vivo by electrochemistry before any other methods. NA is an unstable nitroso-arginine (half-life: 4–6 s), which spontaneously degraded into citrulline and nitrite without NO production. The endogenous peak is due to the reduction of NA using two electrons and two protons into N-hydroxy-arginine (NHA). In vivo or in vitro NHA adsorption at the microelectrode surface permitted its oxidation and thus its identification by its two characteristics peaks (Fig. 1) [16]. NA was found in vitro in bNOS and in vivo in Aplysia, mice and rat brains [17,18].
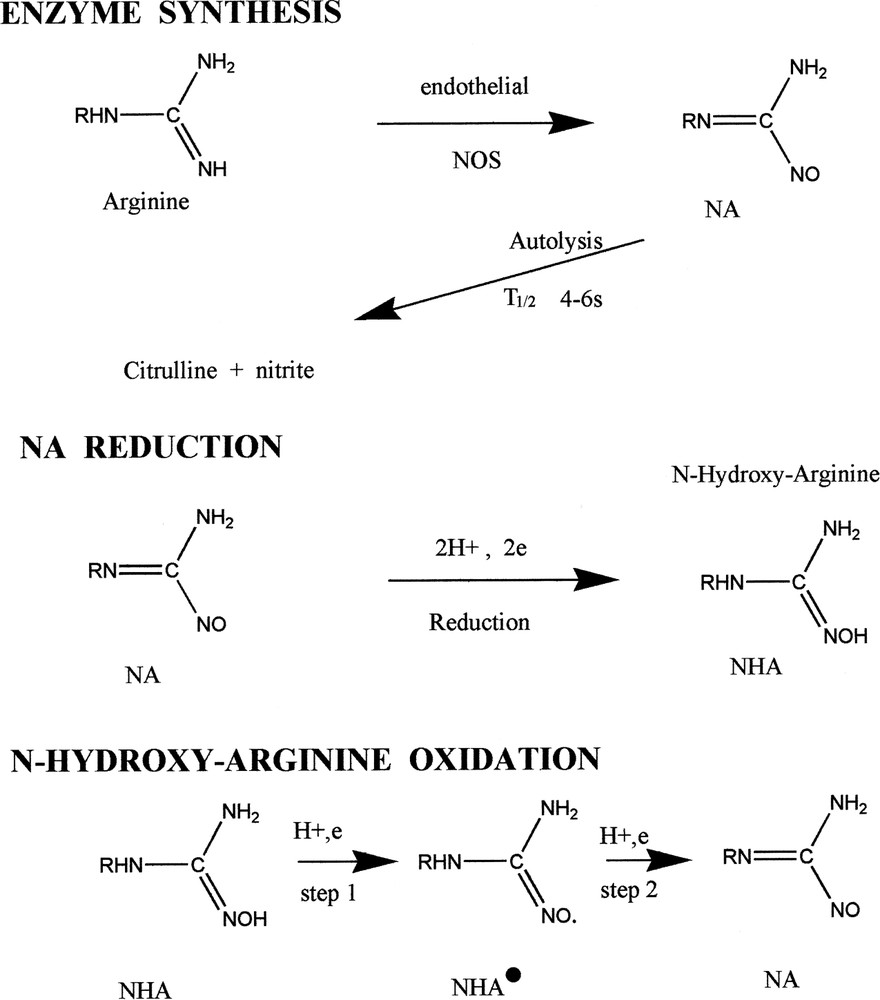
Synthesis and detection of NA. Endothelial NOS synthesised NA. NA spontaneously degraded into citrulline and nitrite. NA is detected by reductive differential pulse voltammetry giving Ng-hydroxy-l-arginine (NHA) in one step. NHA is oxidised into NA in two steps.
The present experiments were performed in order to study if NA was synthesised by eNOS in vitro and in vivo, assuming that bNOS and eNOS may have the same end-product. Some technical improvements have been obtained since the 1980s. Pure eNOS is now available without contamination by other enzymes. HUVEC was easily cultured and was a known source of EDRF. Rat corpus cavernosum was also a known source of EDRF when it was stimulated. The enzymatic, cellular and tissular determination of the presence of NA permitted to know whether NA was a serious candidate for EDRF.
2 Material and methods
2.1 Voltammetry
Experiments were realised using the electrochemical detection of NA with a micro-carbon electrode in the reduction domain. Precedent works demonstrated in vitro and in vivo that NA was detected using RDPV by its specific peak at vs Ag/AgCl. The micro-carbon electrode was commercially available (MFC1, Tacussel, Lyon). Auxiliary and reference electrodes were platinum and Ag/AgCl. Voltammetric detection was performed with the following fixed parameters in reduction: sweeping rate = 40 mV s−1, pulse amplitude = 0.1 V and frequency = 10 Hz (PGSTAT10, Autolab, Roucaire). In these conditions, the detection limit was μM for NA using Ng-nitro-arginine (LNA) as a stable standard. LNA gave two peaks in reduction at −1.4 and vs Ag/AgCl in PBS [14]. The second peak at Ag/AgCl corresponded to the reduction of the NO group. This reduction is similar to NA reduction, but not identical. The quantification of NA remained indicative and not exact. The height of the second peak was correlated with the LNA concentration with 10−5 M as the detection limit. NA was quantified as LNA units. Other compounds can be detected with these microelectrodes in the reduction domain. For NO, the detection limit was the micromole at vs Ag/AgCl. Nitrite, citrulline, and NHA were undetectable in reduction. Hydrogen peroxide and superoxide were also detected at μM at −1.02 and vs Ag/AgCl, respectively [15]. Oxygen was undetectable below 1 mM at vs Ag/AgCl. The observed signal in vivo for RDPV was the NA peak. This microelectrode has been used during 20 years in rat tissues: no other peak has been observed in the reduction domain. Using the microelectrode in the oxidation domain, NO and nitrite gave a peak at +0.73 and vs Ag/AgCl, respectively, with the same sensitivity limit (μM). These two peaks were to close to allow in vivo identification of either nitrite or NO. NHA gave two peaks in oxidation at +0.49 and vs Ag/AgCl, respectively, with a sensitivity limit equal to 10 μM.
2.2 Endothelial NO-synthase
NA production by eNOS was studied using recombinant enzyme (eNOS) (bovine recombinant) (Cayman, SPI-BIO, France). The pure enzyme was used in a small incubation chamber at 37 °C [16]. One unit of eNOS (45 μl) in 50 mM HEPES, pH = 7.4 containing 1 mM CaCl2, 20 μg ml−1 calmodulin, 0.1 mM NADPH, 12 μM tetrahydrobiopterin, 5 μM FAD, 5 μM FMN and 170 μM DDT. The substrate, l-arginine, was introduced in 50 mM HEPES (5 μl) giving a 2-mM concentration.
2.3 Endothelial cells
Human endothelial cells (HUVEC) were cultured on Petri dishes according to standard protocols. The endothelial cells at passage 1 were used in the present study. The dishes were on a binocular inverted microscope with a homemade thermostated chamber kept at 37 °C, allowing microelectrodes to stay in contact with the surface cell contact or close to it by means of micromanipulators (Prior, Phymep, Paris).
2.4 Tissue model
Male adult rats (Sprague Dawley, , ) (IFFA-Credo, France) were used to test corpus cavernosum vasodilatation. They were anaesthetised with urethane (1.45 g kg−1, ip) and were placed on a home made heating table during the measurements (37 °C). The penis was exposed and a small incision (1–2 mm) was realised. Then the microelectrode was inserted in the corpus cavernosum using micromanipulator. Auxiliary and reference electrodes were put intraperitoneally. In a first series (), RDPV was realised every minute with the above-described parameters. Laser Doppler flowmetry gave simultaneously the penis blood flow. Briefly, a microprobe was put on the penis near the microelectrode (PF418 master probes and Periflux 4001 master, Perimed, France). It gave on line the blood flow in flow units. An intracavernous injection of Acetylcholine (50 μl, 100 μM) in PBS at 37 °C was realised with a microelectrode inserted by the manipulator close to the voltammetry microelectrode (). In a second series (), an intracavernous injection (ic) of arginine (50 μl, 10 mM) in PBS at 37 °C was realised, then 30 min later, when the NA peak was stable using RDPV, a second ic injection of LNMA (50 μl, 10 mM) was performed and RDPV carried out every minute. In a third series (), after urethane anaesthesia with a lethal dose (1.8 g kg−1, ip), the corpus cavernosum was dissected for nitrite determinations by capillary electrophoresis.
2.5 HPLC and capillary electrophoresis
HPLC of citrulline in enzymatic samples was performed on a reverse phase (μC18, Hypersil, 5 μm, 15-cm length, 4.7 mm ID). Solvent (acetate buffer, 100 μM, pH 4.4, 80%, acetonitrile 20%) was pumped through at a rate of 1 ml min−1 (110B solvent delivery module, Beckman, France). Detection was performed with an electrochemical detector (Waters 460, Waters, France) with a carbon-electrode set at vs Ag/AgCl. Injections (10 μl) were performed with an automatic injector (WISP 717, Waters, France). Prior to injection, enzymatic samples (10 μl) were derivatised with OPT-thiol reagent (100 μl) and injected 3 min later. The retention times were 8, 13.2 and 17.6 min for citrulline, arginine, and NHA, respectively.
Nitrite and nitrate simultaneous determinations in rat corpus cavernosum extracts were realised by Capillary Zone Electrophoresis using a P/ACE 5510 (Bekman, France) equipped with a photodiode array detector [19]. The voltage was set at and a fused silica capillary was used (57 cm, 75 μm ID). The electrolyte was sodium sulfate containing an electroosmotic modifier (OFM-OH, Waters, France) in pure bidistilled water (2.5 ml OFM-OH in 100 ml of 10 mM Na2SO4). The detector was set at 214 nm. Temperature was 25 °C and pressure injection (10 s) was performed. After quick dissection, 10 Corpus cavernosum were weighted () and crushed with an ultrathurax in 2 ml of pure bi-distilled water. After ultrafiltration, the extracts were kept at until analysis.
3 Results
3.1 NA production by endothelial NOS
At equilibrium, the microelectrode in eNOS with cofactors gave no voltammetric peak in reduction or in oxidation. When l-arginine (2 mM) was introduced, the NA peak appeared in the reduction domain and the nitrite peak appeared in the oxidation domain (Fig. 2A and B). The NO peak was absent in the reduction domain, indicating that the observed oxidation peak was due to nitrite. The two peaks of NHA were absent, indicating that it was not produced at a significative level during the enzymatic process. Neither hydrogen peroxide nor superoxide peaks were observed, indicating their presence, if any, under their detection limit. Quantitative voltammetric measurement at 10 min indicated of nitrite and of NA in the LNA units. The enzyme activity was excellent for nitrite with the announced activity: 1 unit produced 20 μM min−1 of nitrite or methemoglobin using the oxyhemoglobin assay at 37 °C. NO was never detected on microelectrodes in the reduction domain, indicating a concentration below 1 μM at least. The concentration of citrulline, detected by HPLC, was .
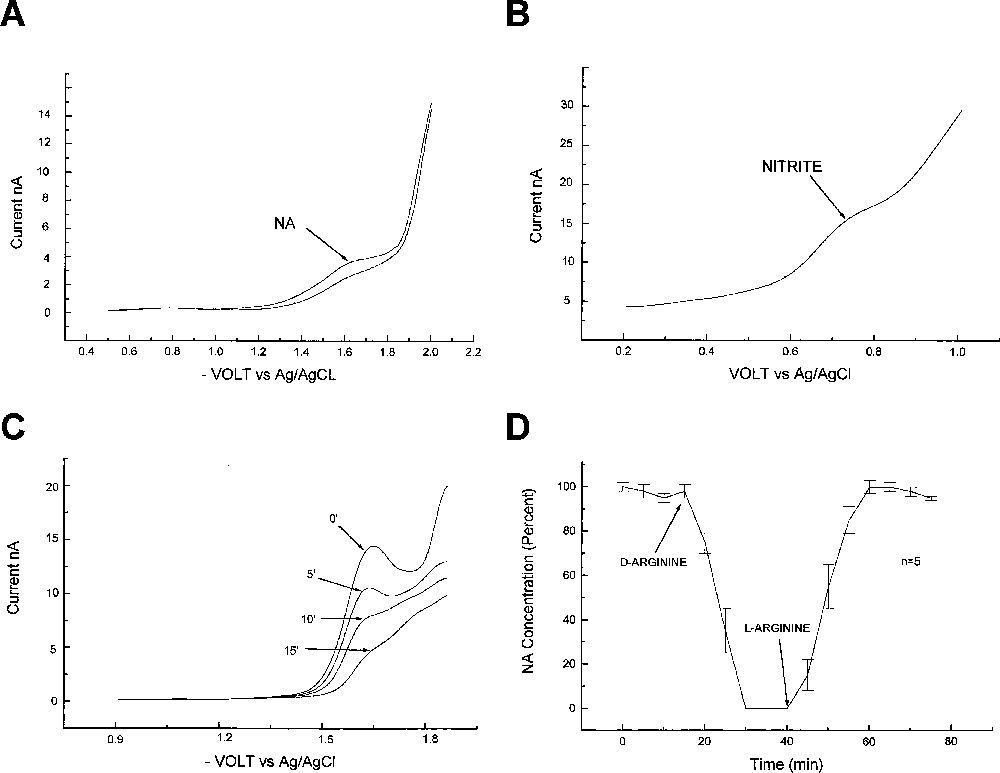
Production of NA by endothelial NOS and endothelial cells. (A) Reductive differential pulse voltammetry in eNOS in reduction before and after substrate addition (upper curve) at 10 min. (B) Differential pulse voltammetry in oxidation in eNOS with substrate. (C) Reductive differential pulse voltammetry on contact with HUVEC. Basal level at 0 min, then d-arginine (5 mM) was added and the NA peak was recorded at 5, 10 and 15 min. (D) NA concentrations on HUVEC with d-arginine (5 mM) added at 15 min then l-arginine (2 mM) added at 40 min.
3.2 NA production by endothelial cells
Using RDPV, the peak of NA at vs Ag/AgCl was observed in the instance of a contact between the microelectrode tip and the cells. It was absent in the culture medium even with l-arginine (2 mM) (M199 with l-glutamine, Mediatech, France). Treatment by d-arginine (5 mM) resulted in a competitive inhibition with complete disappearance of the NA peak. When l-arginine (2 mM) was added, the synthesis was immediate and the level returned to its initial state (Fig. 2C and D). The NA peak current indicated a millimolar range (, ) in LNA units when cells were placed in an l-arginine-containing medium (2 mM). The NO signal was absent in the reduction domain.
3.3 NA production by tissues
In the first group, in rat corpus cavernosum, at the beginning of the experiment, the NA peak was close to the detection limit, the blood flow was minimal and the rat penis was flaccid. When acetylcholine was injected, the NA peak grew following endothelial vasodilatation followed, by a high penis blood flow as measured by laser Doppler (Fig. 3A). A strong correlation was found between flux units and NA peak intensity (, ). This correlation was obtained by measuring the flux unit and the NA concentration each minute after the injection of acetylcholine, during 15 min, in five animals. The NA concentration was () in LNA units at maximum, 1 min after the acetylcholine injection. Using RDPV at basal state, NO was found below the detection limit. NO was also undetectable at the NA maximum after injection of acetylcholine.
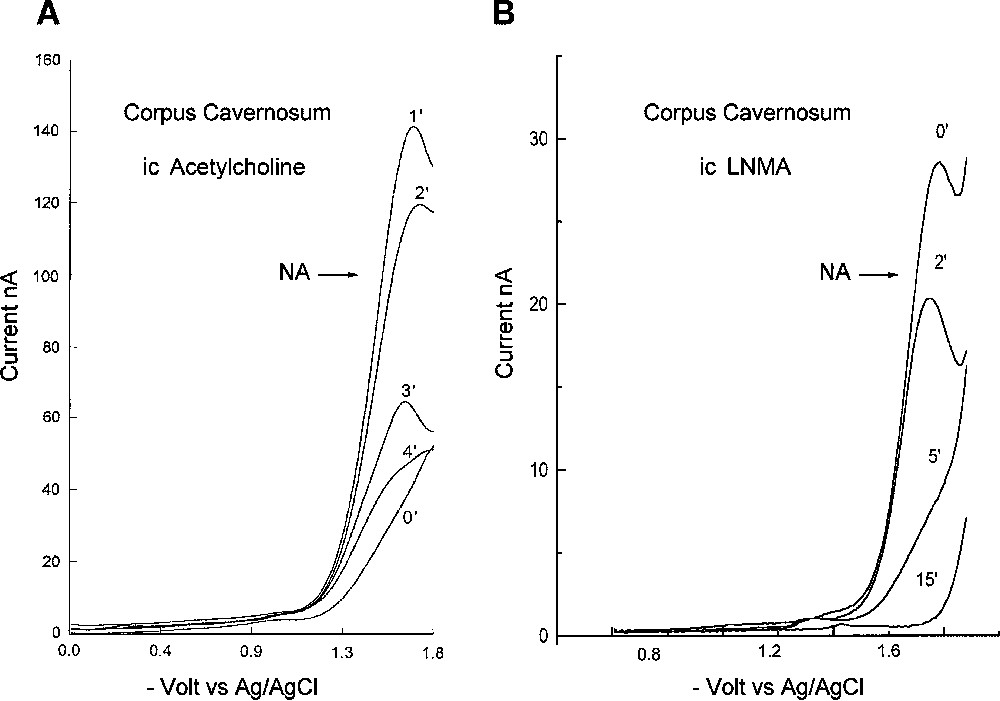
Determinations of NA in rat corpus cavernosum. (A) Reductive differential pulse voltammetry in rat corpus cavernosum before and after intracavernosal injection of acetylcholine. Basal signal at 0 min, then 1, 2, 3 and 4 min after injection. (B) Reductive differential pulse voltammetry in rat corpus cavernosum before and after intracavernosal injection of LNMA. 0 min corresponds to the basal signal, then 2, 5 and 15 min after injection.
In the second group, after ic injection of arginine, the NA peak grew to stabilise in 30 min at a mean value (, ) in LNA units. After LNMA ic injection, the NA peak disappeared completely in less than 15 min, with a half-life of 2.5 min. Five minutes after the ic injection, the NA concentration was () of its basal value (Fig. 3).
In the third group, the basal values in corpus cavernosum detected by capillary electrophoresis were () and () for nitrite and nitrate, respectively.
4 Discussion
4.1 Production of NA by eNOS
The citrulline and nitrite concentrations in the eNOS incubation medium were identical to the predictive concentrations of the product's manufacturer's specifications. The enzyme activity was kept during 10 min at 1 unit; this permitted an easy detection by RDPV and DPV. The high value of NA (100 μM) if we consider its half-life (4–6 s) was certainly due to the adsorption of the enzyme at the electrode surface, giving a higher enzyme concentration than in solution. The eNOS concentration in solution assay was 0.11 mM in HEPES; it could be in the order of the millimole at the electrode surface. A second point was that the standardisation procedure using LNA units was also a source of error. A third point was that the half-life of NA was determined in vivo in rat brain (4–6 s) in the extracellular fluid. This was different from the conditions of the assay. If we consider a mean life of 5 to 10 half-lives for NA (20 to 60 s), the NA concentration must be around 10 μM in solution. The observed concentration was at least multiplied by a factor 0.1 in the in vitro assay conditions. This was a limitation at this time to eNOS activity measurement by NA determinations. A new microelectrode with a membrane avoiding fouling and enzyme adsorption on the microelectrode tip could be interesting to solve this current problem. In these measurements, the main point was the observation of NA synthesis by pure endothelial enzyme in standard conditions. The absence of NO synthesis observed with RDPV confirms previous observations. At this time, NO was never observed by pulsed amperometry, RDPV and DPV in NOS preparations when SOD was absent [14–16,20]. Authors tried to explain this paradox by the action of tetrahydrobiopterin on NO or by the production of anion superoxide by NOS. In the conditions of the assay, with l-arginine in excess, there was neither production of superoxide nor oxidation by a few micromoles of tetrahydrobiopterin of a millimole of NO. It was shown that SOD modified the conditions of the enzyme assay, which explains the NO detection [11]. Hydrogen peroxide, superoxide and NHA were not detected during the incubation. This indicated levels below their respective detection limit. This was shown by previous observations that indicated that oxygen radicals were not produced by eNOS in normal situation in the presence of arginine. NHA was not observed in the same conditions. The l-arginine concentration used in the micro cell was similar to concentrations found in endothelial cells (mM). It indicated that, if l-arginine was in the millimole range in endothelial cells, as generally observed, the product of the enzyme must be in the millimole range. The results obtained with pure endothelial NOS were in agreement with those observed with pure brain NOS in our recent articles [16,17]. NA was produced by eNOS without poisoning the enzyme, which is not the case for NO at such a level. One micromole of NO reduced dramatically the enzyme activity in an irreversible manner [21]. This was not the case in our conditions, with 200 μM of nitrite produced.
4.2 Production of NA by endothelial cells
The NA concentration was at the millimole level in LNA units at the surface of HUVEC cells when l-arginine was present at this level. This is coherent with the values obtained with a pure endothelial enzyme. Arginine, nitrite and nitrate were also found at the millimole level in endothelial cells when the culture medium was supplemented with arginine at the same level. A few hundred micromoles of these three compounds were also found in vivo in rat tissues after crushing the extracts. But many compartments were present in the cells, and the values in the extract represented a mean of these various concentrations. NA detection with microelectrodes at the cell contact was punctual and represented local concentrations produced at the cell surface before any spatial dilution. The NA diffusion coefficient was similar to that of amino-acids with a very high concentration gradient from its diffusion source. It explained that NA was detected only when there was a contact between the microelectrode tip and the endothelial cells. In the conditions of the measurement, NA was the sole signal observed, indicating an absence of NO and oxygen radicals at a significant level using RDPV. The competitive inhibition by d-arginine produced a total disappearance of the NA peak, which agrees with enzymological rules. Some authors [22,23] detected NO by pulse amperometry (PA) at the surface of HUVEC with a few nanomoles and a few femto-amperes with the classical micro-carbon electrode derived of Malinski's works. The discrepancy between the facts that NO cannot be detected in eNOS and that it was detected in HUVEC cells was relevant to the microelectrode selectivity and the PA. The best Nafion® membrane gave a selectivity of a few hundreds or thousands, depending on authors. NO detected by these microelectrodes was nitrite, which had the same value than NA at the surface of the HUVEC cells.
4.3 Production of NA by corpus cavernosum
To test EDRF production in a living tissue, rat corpus cavernosum was chosen according to highly favourable aspects to insert microelectrode without perturbing the physiological system. NO was described many times to be the mediator of erection in rats. Autoradiographic localisation of NOS showed that NOS binding was primary localised to the endothelium lining the vascular lacunar spaces in rats [24]. Microelectrodes were inserted in rat penis corpus cavernosum and positioned on endothelial cells. It was the simplest in vivo endothelial model using microelectrodes. It was easy to follow vasodilatation using the external microprobe of the laser Doppler apparatus. Intracavernosal injections of drugs were performed without difficulties. DPV showed great-intensity signals permitting identification and quantification of NA without any doubt. The correlation with blood flow was excellent after acetylcholine injection. This indicated that endothelial stimulation by acetylcholine gave simultaneously NA and vasodilatation. NO was not observed during the stimulation. This result was slightly different of some authors using a microelectrode modified from Malinski's work who found a few hundreds micromoles of NO [25]; if true, NO toxicity would be too important at this level and eNOS would be completely ‘killed’. This indicated that the selectivity toward nitrite of these authors' microelectrodes was not sufficient. After stimulation of NA synthesis by arginine, LNMA was able to inhibit completely the enzyme. The high NA values in LNA units found in the corpus cavernosum were linked to the high nitrite and nitrate values found by capillary electrophoresis. Vasodilatation of the rat penis after ic injection is visible to the naked eye without problem. The comparison with other organs like brain indicated a fifth factor at least for nitrite and nitrate tissue determination.
4.4 NA hypothesis
NA synthesis was realised by eNOS via the oxidation of arginine. NA is a nitroso-compound, a nitroso-arginine, an N-oxo-derivative, an iminoxyl species that was before hypothesised many times. It could have some classical properties of nitroso-compounds, which are generally vasodilatators, anticancerous, antibiotics and anti-radicals. According to NA instability, it was very difficult to study its production without RDPV. Studying the chemical oxidation of NHA and its oxidation by heme proteins, authors observed the formation of various stable compounds: nitrous oxide, Ng-nitroso-arginine, a cyanamide derived from NHA (cyanoornithine) [26–30]. But oxidations of NHA were greatly dependent on the pH and on the chemical conditions [31]. The different oxidation states of end products were also difficult to control. The King's group tried unsuccessfully to find NA using the Diels–Alder reaction during chemical oxidation [32]. Electrochemical oxidation of NHA in two steps gave NA (half-life = 4–6 s) with an unstable iminoxyl radical intermediary species NHA. (half-life = a few microseconds, determined by cyclic voltammetry) [15,33,34]. The iminoxyl radical species gave the cyanamide derivative and nitrous oxide during its degradation for hydroxy-guanidine compounds and it could be the same for NHA, indicating an insufficient oxidation to obtain NA. NA reduction gave NHA, as demonstrated previously [14–16]. The electrochemical oxidation and bNOS gave a stable NA cyclo-adduct via the Diels–Alder reaction [18]. This stable cyclo-adduct, confirming the NA synthesis, spontaneously degraded at physiological pH into citrulline and nitrite, confirming previous observations on NA degradation. This was different from hydroxy-guanidine Diels–Alder complexes which degraded in nitrous oxide and cyano-derivatives [32,35]. Chemical properties of NA agreed with properties found by bioassay: it was positively charged at physiological pH; there was a carbonyl group; it was a mild oxidant that can be reduced easily; its half-life was constant; it gave citrulline and nitrite after degradation. Here it was observed that NA induced in vivo dilatation, which was the most important pharmacological property of EDRF.
5 Conclusions
NA discovered in 1993 by electrochemistry in rat brain was synthesised by eNOS in vivo and in vitro at a high level. It concentration was linked to vasodilatation in vivo. These preliminary experiments gave the idea that NA was a serious candidate for EDRF. Other chemical and pharmacological experiments were needed in the near future to document this theory and were in progress in our group.