

1 Introduction
The last few years have seen the advent of high-throughput technologies to analyze various properties of the transcriptome and proteome of several organisms. The congruency of these different data sources, or lack thereof, can shed light on the mechanisms that govern cellular function. A central challenge for bioinformatics research is to develop a unified framework for combining the multiple sources of functional genomics information, thus obtaining a robust and integrated view of the underlying biological phenomena.
Since the complete DNA sequence of S. cerevisiae became available in 1996 [1], a variety of large-scale, high-throughput experimental studies have provided partial, potentially complementary insights into the structure of the yeast regulatory network and, indirectly, into its dynamics.
A major challenge of the post genomic research is to understand how cellular phenomena arise from the interaction of genes, proteins and metabolites. Investigations into the structure of these molecular interaction networks include studies on their global topological properties [2,3], such as connectivity distribution [4] or scale-free nature [5] have been performed. The local properties such as clustering proteins within the network into functional subnets using combinations of attributes and local connectivity properties to uncover a higher level of network organization [4,6–9] were also studied on each homogeneous network separately.
Several studies [8,10,11] have already tried to aggregate many types of data, mostly extending the approach of [31], based on the research of under- or over-expressed static graph motifs, only in order to understand the topological properties of biological graphs.
In previous work, gene expression data in Saccharomyces cerevisiae have already been combined with gene ontology-derived predictions [8] and phenotypic experiments [12]. Recent studies assembled an integrated S. cerevisiae network, in which nodes represent genes (or their protein products) and differently coloured links represent five types of biological interactions: protein–protein interaction, genetic interaction, transcriptional regulation, sequence homology, and expression correlation [10,11].
However, most of these studies rely on the graph-theoretic approach, which fails to represent n-ary relations between biological objects, for example in metabolic networks or complexes, as well as qualitative dynamics of the interaction: for example, the distinction between activation and inhibition, production and consumption.
In this work, we present a bipartite graph model of heterogeneous biological network that comprises directed transcriptional regulation, protein–protein interaction, the complexes, the metabolic networks, synthetic lethality experiments and micro-array expression results.
This type of models allows searching for complex heterogeneous network motifs with qualitative dynamics and biologically relevant properties.
Based on this model, the S. cerevisiae dataset was represented as a global database including the aforementioned data types.
2 The MIB model
The main model-constructing principle that we used is made to apprehend the organization of the complex system that constitutes the cell with its distributed control (see Fig. 1). Here we proposed a qualitative modelling framework, Model of Interactions in Biology (MIB), a bipartite graph model of heterogeneous biological network. MIB is designed to fill the gap between, on the one hand, existing techniques for quantitative modelling of biological systems [13–16], and, on the other hand, techniques for analysis of the network structure mostly based on graph theory [2,3,5]. Our approach is largely inspired by the Structured Analysis and Design Technique [17].
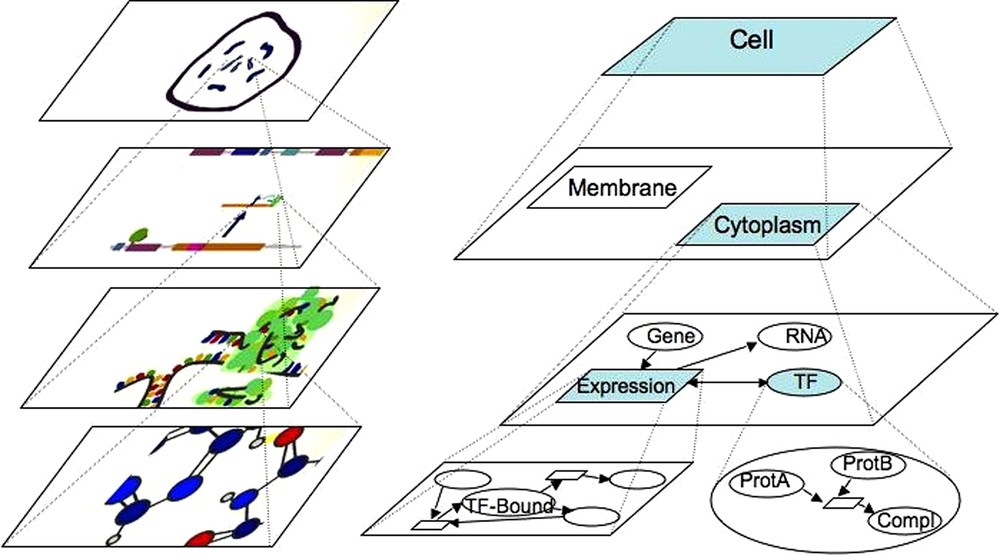
Representation of biological systems seen as a set of chemical reactions. The top layer represents the most general view of the hierarchy. The bottom layer is the most detailed view of the system structure. Two intermediate layers are presented, showing the topological or functional structure of the system. On the left side (top down), the artistic view of a cell with chromosomes is shown, followed by the gene regulatory network scheme, the translation and ribosomal machinery layer and interacting molecules and atoms layer (captures of the artistic MIB movie: http://sergi5.com/bio/MIB). On the right side (top down), the artistic view of the biological system is modelled in MIB. The first layer box represents the cell that contains membrane and cytoplasm (second layer). Zooming out the cytoplasm (third layer), gene expression, involving a transcriptional factor, is represented. At the bottom layer, the transcriptional factor is magnified into a complex made of two proteins, and gene expression is symbolized by the transient TF/DNA complex.
A biological system can be seen as an emergent [18] phenomenon of the chemical reactions set, including protein–protein interaction (PPI) and transcriptional regulation interactions (TRI). This set may be modelled by a composite reactions network and it should satisfy the following constraints:
- • to include information about chemical species and chemical reactions of the biological system;
- • to consider biological interactions that are not binary, like in the case of a complex of several proteins;
- • to distinguish between undirected and directed (positive or negative) interactions of species;
- • the representation should be simple enough to allow the study of global structural properties of the network and the search for sub-networks in the composite network.
Thus, the set of biochemical reactions composing the biological system is represented in MIB as a network that comprises nodes, either entities (chemical species) or transformations (chemical reactions), and links between nodes, divided in four roles: consumed, produced, activates, inhibits. The same chemical species may have different properties and participate in different reactions depending on intracellular localization. In this case, such a species may be represented by more than one entity in the MIB model. The next paragraph presents the formal definition of the MIB model.
The MIB network N is a tuple where:Definition 1 MIB model
The MIB network can be represented graphically as a bipartite graph (as shown in Fig. 2) where elliptic nodes represent entities X and rectangular ones represent transformations Y. Nodes are labelled with the attributes of related entities and transformations. Edges of this graph represent links E between an entity and a transformation. There are four arrow types to express four possible roles of an entity in a transformation: production () or consumption () of an entity by a transformation and activation () or inhibition ( ) of a transformation by an entity.
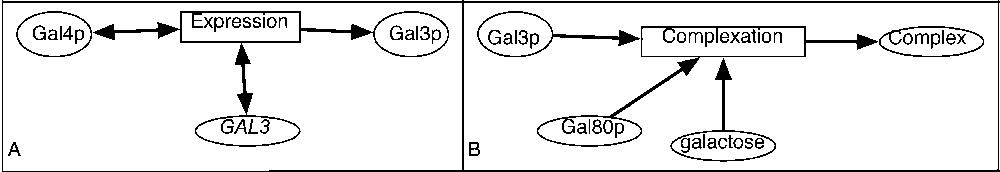
Examples of representation of a biological system. A. In yeast, Gal4p is the transcriptional factor that regulates the GAL3 gene. B. Gal3p, Gal80p and galactose constitute a complex.
In the following paragraphs, two examples of MIB model of common biochemical reactions will be presented. The first example is catalytic. The second is stoichiometric.
One of the important properties of the reaction transcriptional regulation is that the participating species are not consumed (this type of reaction can be also called gene expression regulation). This type of reaction (the expression of Gal3 protein) is shown in Fig. 2A. The GAL3 gene and transcriptional factor Gal4p are needed for the reaction (they activate it), but are not consumed [19].Example 1 Transcriptional regulation
More generally speaking, the information transfer reaction represents the production of a biological macromolecule using the informational template (DNA for transcription or RNA for translation reaction). The template is not consumed in such a reaction.
In Fig. 2B, the complexation of Gal3 and Gal80 proteins and of galactose is represented [19]. This is an example of a chemical reaction that can not be represented with a simple graph because it involves three different entities. It may be labelled with the kinetic rate. The association reactions are generally reversible, and the corresponding reverse transformation could also exist and encoded in a distinct reaction.Example 2 Association reaction
The topology of the MIB or its parts can be described by motifs, thus characterizing the number of reactions, species and roles of the species in the system.
A motif M on MIB is a tuple where:Definition 2 Motif of MIB and its occurrence
An occurrence of a motif M in the MIB model is a sub network and two bijections and can be established between nodes of both graphs such that, if , , and , , , then .
A motif can have several occurrences in the network, in which case they are distinguished by their labels. Fig. 3 represents the MIB motifs used to represent every type of biological data included into the database. Motif A illustrates a transcriptional factor that inhibits (or activates) the expression of a protein. Reactions involving two proteins that form a complex were represented by motifs D, and PPIs by motif B. Two more transformations represent indirect and even unknown mechanisms: synexpression data (correlated expression of a couple of proteins) are represented by motif E, and synthetic lethality by motif C. So long-distance and short-distance interactions can be mixed during the analysis as we studied for synexpression and its molecular mechanism (Fig. 5).
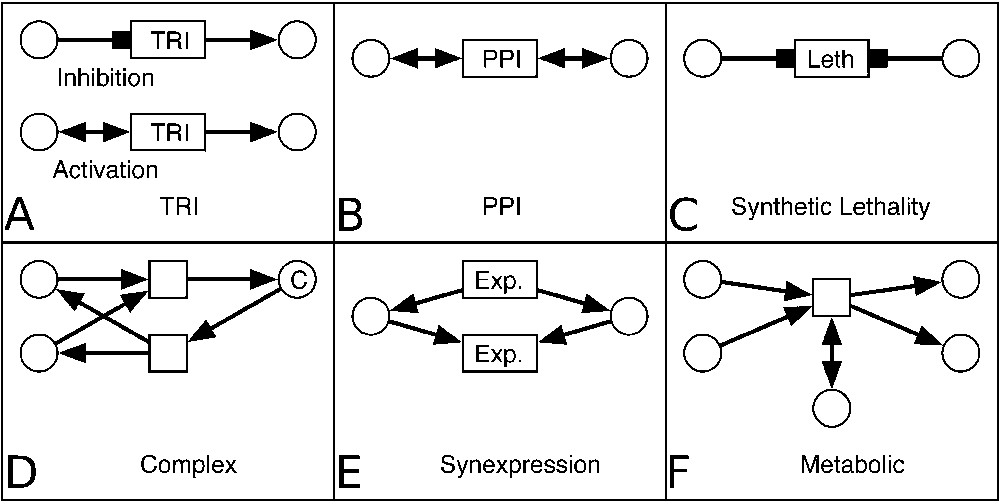
Motifs used for biological data representation in MIB. A. Two motifs representing TRIs: inhibition (top) and activation (bottom) of the production of the entity (macromolecule) (right) by another entity (transcription factor) (left). B. A motif representing physical interaction: two entities activate a transformation (PPI). C. The synthetic lethality is represented by a motif with two entities inhibiting a transformation ‘Leth’ (for lethality phenotype). D. A motif representing association transformation (top) that consumes two entities and produces a complex C. The reverse transformation (dissociation) is represented in the bottom of the panel. E. The synexpression of a couple of entities is represented by a motif with two transformations in which they are produced (top) and consumed (bottom) together. F. A motif representing a metabolic reaction. Two entities are consumed by a transformation, one entity activates it and two entities are produced.
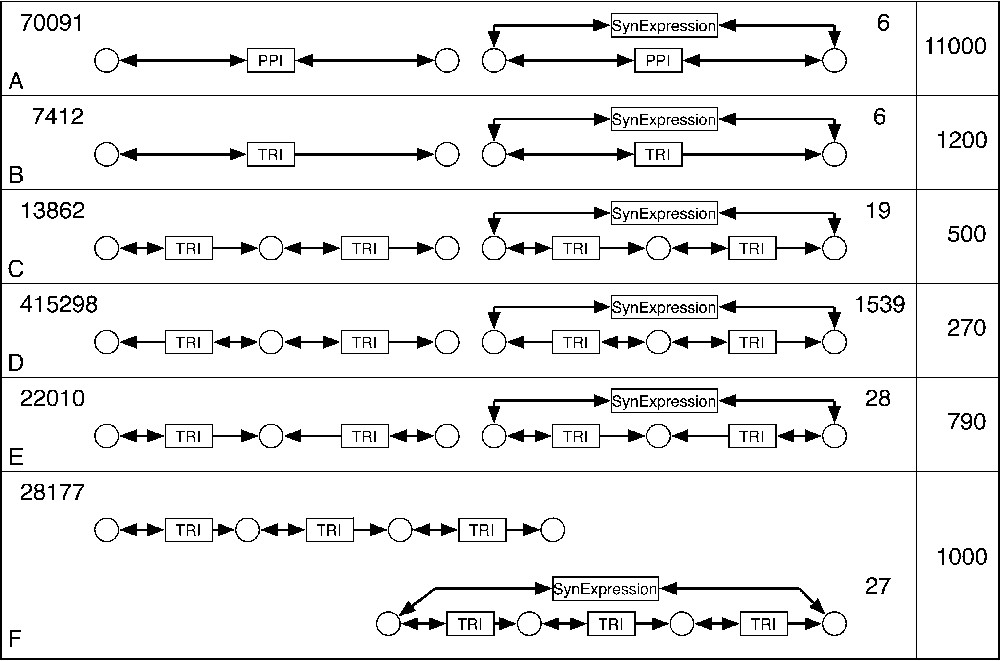
Correlation between synexpression data and underlying biochemical mechanisms. Six motifs were proposed to be candidates for the synexpression mechanisms (A–F, left). For each motif, the number of occurrences in the BIB database is indicated on the side. The motifs combining the regulatory mechanism and the synexpression data (A–F, right) were searched, and the number of encountered occurrences of such subnets is indicated. The last column shows the ratio between occurrences of each motif without or with synexpression condition.
Finally, a metabolic reaction catalysed by an enzyme is illustrated by motif F, where two reactants are consumed, two other molecules are produced, and one enzyme is needed by the transformation.
3 Application to the heterogeneous network of S. cerevisiae
Modelled data, coming from various sources, were integrated in the Biological Interaction Browser (BIB) (http://www.genoscope.cns.fr/biopathways/bib/). We integrated the following datasets: protein–protein interaction (PPI) data, generated using high-throughput variants of the yeast two-hybrid method to identify binary interactions [20,21] or using techniques to isolate multi-protein complexes based on mass-spectrometry such as HMS-PCI [22], TAP [23] and compilation from the literature [24]. The data include also direct transcriptional interactions (TRI) compiled from the literature [25] and from ChIP-Chip experiments [26]. The synexpression results come from microarrays experiments [27] representing pairs of genes with a correlated expression. The synthetic lethality results [27] represent pairs of yeast genes whose joint disruption is lethal. Finally, the metabolic network data were taken from Biocyc [28] using Cyclone [35]. The complete network contains 6513 proteins, 1440 complexes, two phenotypes. The interactions include 7455 cases of DNA–protein interactions, 8531 protein–protein interactions, 16496 synexpressions, 886 synthetic lethality cases. Feedback loops and synexpression patterns were searched in this entire heterogeneous network.
3.1 Feedback loops
Feedback loops are a basic example of a static motif, from which dynamical properties such as homeostasis and differentiation can be inferred. The dynamical behaviour of regulatory loops has been studied by several authors using a variety of techniques [16], mostly in the context of transcriptional networks and abstract networks of regulatory influences. Here, we searched for the first time for feedback loops that include both TRI and PPI.
Before studying heterogeneous motifs, TRI-only loops were searched. One hundred and eight TRI-only feedback loops were found in the entire network, with lengths ranging from 2 to 10 (see Table 1, columns 1 and 2).
Number of feedback loops as a function of loop size (column 1): loops including only TRIs (column 2), TRIs and one PPI (column 3), TRIs and two PPIs that are not adjacent (column 3)
| Loop size | TRIs + 0 PPI | TRIs + 1 PPI | TRIs + 2 PPIs |
| 2 | 5 | 17 | – |
| 3 | 4 | 32 | – |
| 4 | 5 | 71 | 125 |
| 5 | 4 | 144 | 529 |
| 6 | 9 | 222 | 1372 |
| 7 | 6 | 390 | 3140 |
| 8 | 12 | 740 | 8464 |
| 9 | 22 | 1197 | 14 863 |
| 10 | 41 | 1987 | 30 444 |
Then, one TRI at a time was replaced by a PPI. Fig. 4 shows feedback loops, each comprising four entities (circles) and the following sets of transformations (squares): TRI only (A), 3 TRIs + 1PPI (B) and 2TRIs + 2 PPIs (C). For example, the motif (B) illustrates a feedback loop made of four entities, one PPI and three TRIs. All TRIs are oriented in the same direction and can represent either an activation (double arrows) or an inhibition (squared arrows).

Feedback-loop motifs made of TRIs only (A), with one PPI (B) or with 2 PPIs (C). Each motif contains four transformations (rectangular shapes), four entities (circles), and possible roles of entities in transformations are represented by arcs.
We compared the number of TRI-only loops with the number of loops where a TRI had been replaced by a PPI (Table 1, columns 2 and 3). Depending on the loop size, 3–50 times more loops with one PPI were found. If two non-adjacent TRIs are replaced by two PPIs, the number of loops increases up to three orders of magnitude, depending on the loop size (Table 1, columns 2 and 4). Thus, adding a second PPI in a motif that already included one PPI increases the number of matching subnets from 2 to 15 times.
3.2 Micro-arrays
Synexpression may involve various underlying molecular mechanisms, thus being a biological result at an intermediate level between molecular physical mechanisms and phenotypes (see Fig. 1). To evaluate the correlation between the molecular knowledge integrated in the BIB and synexpression data, we searched for possible mechanisms accounting for each synexpressed couple of genes.
We used BIB to find the correlation between the micro-array data on the synexpression of gene pairs, and the biochemical reactions in which these two genes participate. Thus, a molecular mechanism underlying the synexpression of two genes, based on the PPI and TRI graphs, could be proposed. These molecular mechanisms, symbolized by candidate motifs, are presented in Fig. 5, together with the number of observed occurrences of each motif type. To determine which motifs are under- or over-represented, the ratio of motif occurrences with and without synexpression was calculated for six candidate mechanisms (last column in Fig. 5).
We looked for modules comprising one gene that regulates the transcription of another gene (Fig. 5B, left) and where the two genes are synexpressed (Fig. 5B, right). Six occurrences of such a module were found with synexpression, and 7412 occurrences were observed without synexpression, which makes the difference of 1200 times. A more complex motif would include one (Fig. 5C, right) or two (Fig. 5F, right) additional genes between the two initial ones. Such motifs were found 19 and 27 times, respectively, with a ratio of 500 and 1000 times less compared to the same motif without synexpression.
A different candidate motif that accounts for synexpression of two genes could involve a third gene that regulates these two genes (Fig. 5D, right). This motif is found 1539 times in yeast, 270 times less than without synexpression constraint. It is interesting to see that the inverse situation, when two synexpressed genes regulate a third one (Fig. 5E, right) is much less frequent (28 cases, 790 times less than without synexpression). As for the synexpression motif A, it was strongly underrepresented (6 cases, 11 000 times underrepresented), meaning that synexpressed genes are seldom participating in a PPI.
For further analysis of the link between synexpression phenotype and the physical interaction network structure, we analyzed the shortest path-length distribution between synexpressed genes compared to that of any pair of genes. The results are shown in Fig. 6. There is little difference between the two distributions, except for long paths (⩾5 steps). The average path length between two synexpressed genes is significantly different from that between random pairs of genes for long paths only, in contrast with previous results [12].
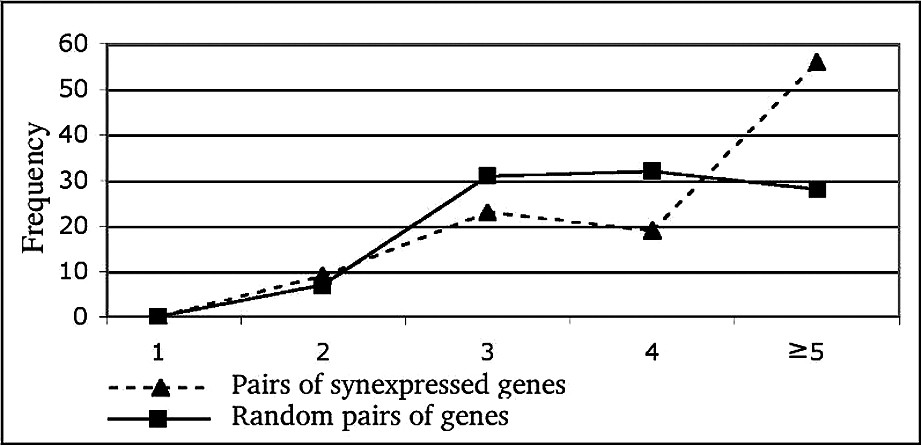
Shortest path length distribution between all synexpressed pairs of proteins (dashed line) versus all possible pairs of proteins (plain line). The shortest paths of length 1 to 4 have been searched. The value of 5 on the x-axis indicates that no shorter path than five has been found.
4 Discussion
Most studies involving heterogeneous networks thus far have focused either on network topology, either local or global. However, most important biological processes such as signal transduction, cell-fate regulation, transcription and translation involve more than four but much fewer than hundreds of proteins. MIB is slightly more complex than a simple graph representation, but has greater expressiveness. One of the great advantages of this approach is that this model enables various static and dynamic analysis. It directly represents n-ary relations that are essential for the representation of complexes and of metabolic reactions. The added expressiveness is also related to the assumption that each modelled transformation occurring in the biological system may be broken down into elementary parts [29]. Our model is more abstract than the one proposed in [30], so we can deal with different types of biological objects and processes uniformly. MIB enables the semi-automatic translation in other modelling formalisms such as, for example, Petri Nets, Ordinary Differential Equations, or Pi-calculus (Yartseva et al., in prep.). The BIB tool adapts some of the algorithms available for graphs (e.g., motif search) to the case of bipartite graphs. It can be used to analyse how various data types complement each other in the full heterogeneous network. As most biologically interesting features concern the dynamics of biological functions implemented by molecules, reactions or pathways, biologically meaningful queries are better expressed at the level of functions and the objects that support these functions. A simple graph representation does not allow this type of query formulation. Fig. 7 provides an example of how the MIB formalism allows to search for instances of a function, independently of the precise ‘implementation’ of this function in a cell. Both subnetworks at the bottom of Fig. 7 can fulfil the specified dynamics depicted by the motif at the top. The subnetwork on the left is implemented by TRIs only, and the one on the right by one TRI, one metabolic reaction (transport) and one physical interaction (binding).

A MIB motif (with a specified dynamics; top) allows searching for both TRI only subnets (left) and mixed TRI/Metabolism/PPI subnets (right). This is illustrated here with a feedback loop.
TRI only feedback loops have already been studied [25]. In the present study, we searched for such loops in larger datasets, and therefore we found more loops in the larger size range. We also provide a new perspective on these feedback loops studies by relaxing previous constraints [31] to allow PPI anywhere in the loops. Some of the modules found are well known, such as the Ste12–Fus3 feedback circuit [32], others are unknown.
The analysis of synexpression data relations between 1625 pairs of genes allowed us to propose for each pair a biologically relevant circuit with a parsimonious topology. This result illustrates how an interaction of higher-level order than biochemical reactions may be modelled in MIB, thus enabling the study of the whole set of yeast interactions.
We have found that the paths between synexpressed genes were longer than for random pairs of proteins (see Fig. 6). We will further investigate synexpressed gene paths. However, the situation is opposite for transcriptional factors: the paths between pairs of them are shorter than between random pairs of proteins [33]. This difference could mean that the genes that are not close in the biological interaction network need to be synexpressed in order to synchronize their biological activity. Our explanation is in line with the results on just-in-time assembly regulation of various complexes [34].
All the interactions integrated in the model come from experimental results, but the context in which a given interaction effectively takes place is not known and may vary among experiments. Therefore, the validation step consists in finding the conditions in which the modules are functional, either by calling on an expert, or if prior knowledge is unavailable, by bench experimentation, as has been done in the case of the galactose feedback loop [18].
These preliminary studies represent a proof of concept for the MIB as a useful tool for future investigations involving regulation, protein interactions, and metabolic networks together with higher-level types of interactions, like synthetic lethality or synexpression.
Acknowledgements
We are grateful to P. Bourgine for discussions. This work was financially supported by CO3 European Project, ISI Foundation, CNRS, Genopole, Genoscope, and S. Smidtas.