

1 Introduction
For more than 80 years, beginning with Wilder [1], diets high in fat and low in carbohydrates have been used to treat epileptic seizures. At present, variations of the Atkins Diet are increasingly used to control weight gain or promote weight loss in humans and recently have been shown to be therapeutic in treatment of intractable epilepsy in both children and adults [2]. During consumption of such low-carbohydrate diets, blood glucose levels decline but remain within normal limits and ketonemia rises. Ketonemia is characterized by elevated levels of blood ketone bodies, primarily β-hydroxybutyric acid (BHB) and acetoacetic acid (AcAc), plus acetone. Under conditions of starvation, calorie restriction or consumption of low-carbohydrate diets, BHB and AcAc supplement glucose as an energy source for the brain. The mechanisms by which low-carbohydrate or calorie restricted diets elevate seizure threshold remain unclear [3].
Liver is the primary organ for interconversion of fats, carbohydrates and proteins between storage and metabolizable forms. At low magnification, it is remarkably uniform cytologically but it is metabolically heterogeneous with enzymes, receptors, transporters and cellular elements distributed along gradients from the oxygen-rich periportal zone to the oxygen-poor perivenous zone [4]. Of particular interest to studies of ketogenic diets, it has been shown that β-oxidation [5] and ketogenesis [6] occur primarily in the periportal zone of the liver. Because it lacks the enzyme 3-ketoacid-CoA transferase, the liver cannot oxidize ketone bodies and, thus, exports the ketone bodies it generates during fat catabolism [7].
A decade ago, a novel subgroup of nuclear steroid hormone receptors, the peroxisome proliferator-activated receptors (PPARs) was identified and found to be central to the regulation of lipid metabolism [8–12]. PPARs have been shown to mediate the metabolic adjustment to fasting [13] and fatty acids and clofibrates have been shown to activate these receptors [10]. Activation of PPAR leads to transcription of 3-hydroxy-methylglutaryl-CoA (HMG-CoA) synthase in the liver, resulting in increased-oxidation of fatty acids [14]. Clofibrates, therefore, promote lipid catabolism and hypolipidemia [15].
During the past decade or so, there has been a resurgence of interest in the ketogenic diet, both clinically and experimentally. Despite the long history of ketogenic therapy for seizures and more recent experimental studies, there are no published reports of liver cytological consequences of such diets. The present study compares the livers of rats fed diets varying in fat content and total calories, with and without the addition of clofibric acid, by light and electron microscopy.
2 Materials and methods
Samples of the livers of four male Sprague–Dawley rats, all two months old and each maintained on a different diet for approximately three weeks, according to a protocol from similar previous studies [16], were collected. All animals were treated in accordance with U.S. National Institutes of Health Guidelines on a protocol approved by the Georgetown University Animal Care and Use Committee. The diets were as follows: Rat #1β normal diet (Purina rodent chow 5001) ad libitum (NAL); Rat #2β ketogenic diet (BioServe F3666), calorie restricted and consisting of 78%:10%:2% fat:protein:carbohydrate (KCR); Rat #3β normal diet (purina rodent chow 5001) calorie restricted with added clofibrate (CLO); Rat #4β KCR with added clofibrate (KCR + CLO). All diets were balanced for vitamins and minerals. Diets 2, 3 and 4 were adjusted to make them isocaloric and calorie-restricted to approximately 90% of the normal daily caloric requirement [17]. Clofibric acid (Aldrich) was added to diets 3 and 4 in a dosage of 0.5% w/w, either by first dissolving in methanol and then adding to rodent chow pellets, and allowing the pellets to dry to constant weight, or by adding the dry powder directly to warmed ketogenic diet, in which it dissolved.
Rats were anesthetized with ketamine/xylazine (85:11 mg/kg, respectively) until loss of responsiveness to toe pinch or corneal contact prior to sacrifice by decapitation. Several samples, each approximately 1 mm3, were taken from each rat liver.
The behavior of the CLO-fed rat warrants a special note. Following the administration of the standard dose of the anesthetics, the rat failed to exhibit the slowed movement and eventual immotility typical of the response to such treatment. One additional dose of ketamine and two additional doses of xylazine had no effect. This rat was eventually euthanized by CO2 asphyxiation. As this was a unique experience, it was hypothesized that the clofibrate treatment had conveyed resistance to the effects of the anesthetics. The hypothesis remains to be tested.
Each sample was placed for 4 h into the primary fixative consisting of 5% glutaraldehyde in Millonig's double-strength phosphate buffer with CaCl2 at a pH of 7.25 [18]. Each sample was then washed three times, 15 min each time, and then left overnight in the buffer. The samples were then placed for 2 h into the secondary fixative consisting of 1% OsO4 in the buffer, washed four times, 15 min each time, in the buffer, dehydrated through an ethanol series, followed by two 15-min changes of propylene oxide, infiltrated overnight with a 1:1 mixture of epoxy resin (LX-112):propylene oxide [19], infiltrated 8 h with a 3:1 mixture of epoxy resin:propylene oxide, and finally dispensed into epoxy resin in polypropylene beakers. The samples were polymerized at 45 °C for 24 h followed by 24 h at 60 °C.
Thin (0.2–1.0 μm) and ultrathin (pale gold, 40–50 nm) sections were cut with a Sorvall Porter–Blum MT2-B ultramicrotome using DuPont or Delaware diamond knives. Thin sections were placed onto glass slides and stained with a mixture of 1% each Azure A, methylene blue and Borax [20]. They were examined with a Bausch and Lomb research microscope equipped with Nikon lenses. Photomicrographs were taken on Kodak Ektapan film, developed in Kodak Microdol-X and fixed in Kodak acid fixer. Ultrathin sections were collected on 400 mesh copper grids and stained with 4% uranyl acetate in 50% ethanol [21] followed by 0.3% lead citrate [22]. The ultrathin sections were examined with a JEOL JEM-1010 transmission electron microscope at 60 kV. At least two specimen blocks from the liver of the rat on each diet were sectioned and several hundred cells were examined in each of the three to more than thirty sections from each block. Electron micrographs were taken on Kodak EM film 4489, developed in Kodak D-19 and fixed in Kodak acid fixer. A Simmon Bros. Inc. Omega D2 enlarger, equipped with a Kodak Ektanon 135-mm lens, was used to make enlarged prints of selected negatives on Kodak Kodabrome II RC paper, processed in Kodak Dektol developer and Kodak acid fixer.
3 Results
At the magnifications (in the range of 500–1000) at which photomicrographs are usually presented in research papers, textbooks and atlases, a section of the liver of a control rat displays cords of hepatic parenchymal cells (hepatocytes) separated by sinusoids. In the absence of special staining procedures (e.g., periodic acid Schiff to show glycogen, Sudan black B to show lipid), the only obvious cytological features are the nuclei and nucleoli of the hepatocytes. A photomicrograph of a section of the liver for Rat #1 (Fig. 1A) shows uninucleate cells (the majority) and a few binucleate ones. The nuclei usually contain a single nucleolus, but some have two or even three nucleoli. A very small number of cells display a single white or nearly white spot that represents a lipid droplet. Similar appearing spots between adjacent hepatocytes designate bile canaliculi.
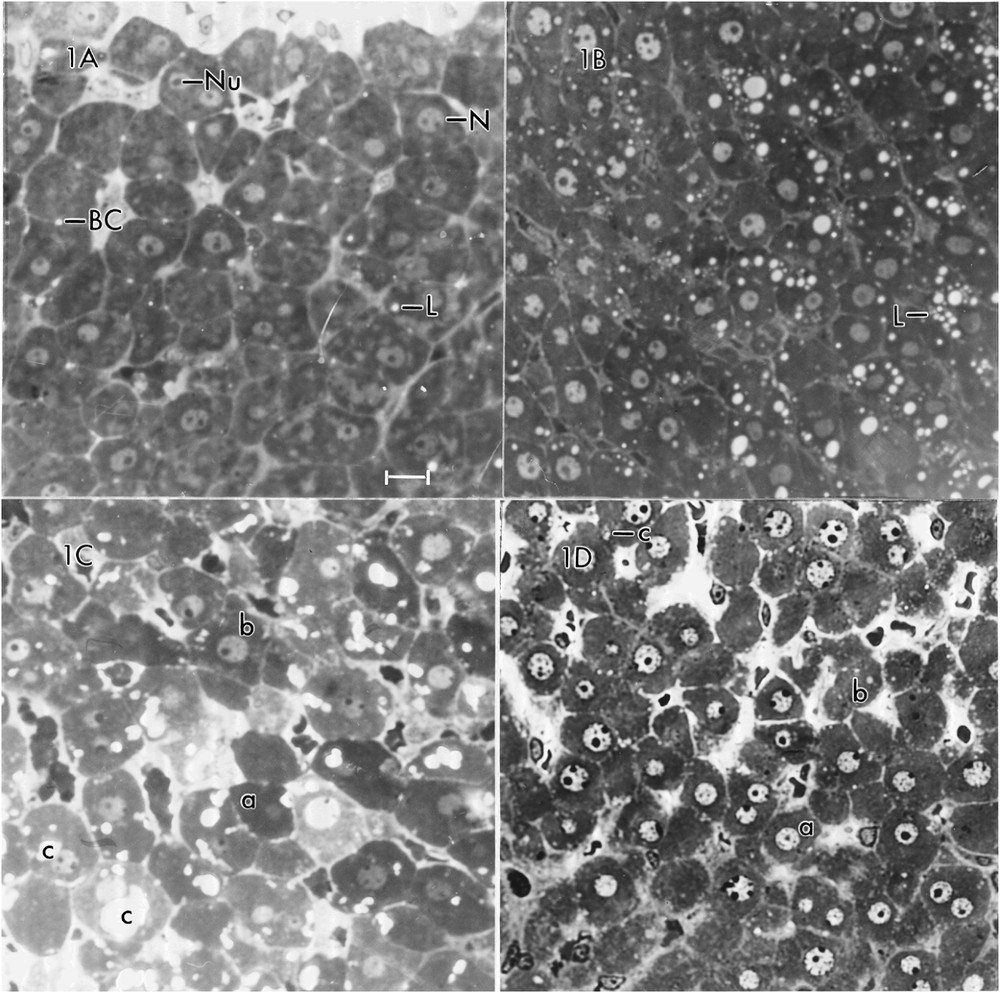
Photomicrographs of a field of rat hepatocytes representing each of the four dietary regimens studied. A = Rat #1 (normal diet – NAL) showing nuclei (N), nucleoli (Nu), lipid droplets (L) and bile canaliculi (BC). Note the rarity of lipid droplets. B = Rat #2 (ketogenic diet – KCR), showing great increase in number of lipid droplets (L). C = Rat #3 (normal diet with added clofibric acid – CLO) showing hepatocytes with no evidence of lipid droplets (a), some with a few lipid droplets (b), and some with large or small irregularly shaped light areas (c). D = Rat #4 (ketogenic diet with added clofibric acid – KCR + CLO) showing some hepatocytes with no lipid droplets (a), some with a few lipid droplets (b), and, rarely, one with an irregularly shaped area (c). Scale bar = 10 μm for all photomicrographs.
An electron micrograph of an hepatocyte of Rat #1 (Fig. 2) confirms the above structures and reveals most of the organelles and inclusions common to hepatocytes: mitochondria, rough surfaced endoplasmic reticulum (rER) and smooth surfaced endoplasmic reticulum (sER), glycogen as pools of β-particles, peroxisomes (microbodies), lysosomes.

Transmission electron micrograph (TEM) of ultrathin section of hepatocyte from Rat #1 showing most of the organelles and inclusions common to hepatocytes: nucleus (N), mitochondria (M), rough surfaced endoplasmic reticulum (rER), smooth surfaced endoplasmic reticulum (rER), glycogen (G), peroxisomes (P), and lysosomes (Ly). Note the absence of lipid droplets. Scale bar = 1 μm for all electron micrographs.
A photomicrograph of a section of the liver of Rat #2 (Fig. 1B) shows a striking difference between the hepatocytes of the two rats. Most of the hepatocytes of Rat #2 contain numerous lipid droplets. Some have 10 or more. An electron micrograph of a hepatocyte of Rat #2 (Fig. 3) shows 32 lipid droplets. As the micrograph represents only a very small portion of the total cell volume, the number of lipid droplets is almost certainly much greater than 32. In addition, whereas the glycogen in the control Rat (#1) appeared mainly as pools of β-particles, it appeared mainly as widely scattered α-particles, i.e. aggregates of β-glycogen particles in the rat on the ketogenic diet (#2). The rER in Rat #1 appeared abundant and in stacked cisternae; in Rat #2, it was sparse and not stacked. There was about a 10% increase in the mitochondrial diameter in Rat #2. In some hepatocytes of Rat #2 (not illustrated, because of inconsistency) there was an accumulation of sER near groups of lipid droplets; in other hepatocytes, there was an accumulation of glycogen near lipid droplets. The section shown contains no peroxisomes, but other sections revealed a few.
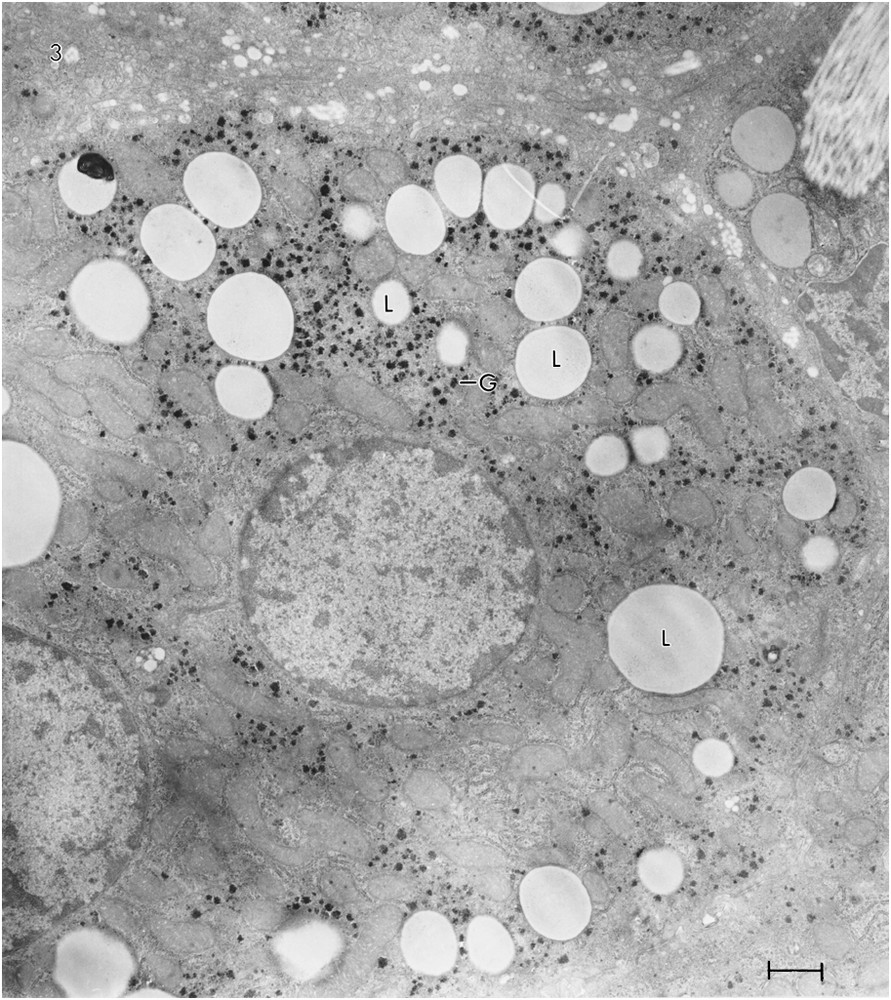
TEM of ultrathin sections of hepatocytes from Rat #2 showing 32 lipid droplets (L). There are also, in this cell, widely scattered α-glycogen particles (G), i.e., aggregates of β-glycogen particles. No peroxisomes were evident.
A photomicrograph of a section of liver of Rat #3 (Fig. 1C) shows some hepatocytes with no evidence of lipid droplets, some with a few lipid droplets and some with large or small irregularly shaped light areas that, in some cases, suggest a fusion of several smaller areas. The irregularity of some of these spaces suggests that they are not lipid, which tends to appear as round droplets in sections. An electron micrograph of a hepatocyte of Rat #3 (Fig. 4) shows several of the large areas. They are membrane bound. Some (Fig. 4, inset) have a fine grainy appearance which differs from the smooth appearance of the lipid droplets; others (Fig. 4) appear empty, possibly a consequence of extraction of the contents during preparation. The hepatocytes of Rat #3 presented a number of peroxisomes slightly greater than the number in the other rats and showed about a 37% increase in mitochondrial diameter over that in Rat #1. The Rat #3 hepatocytes had glycogen in the form of widely scattered α-particles and very little rER.
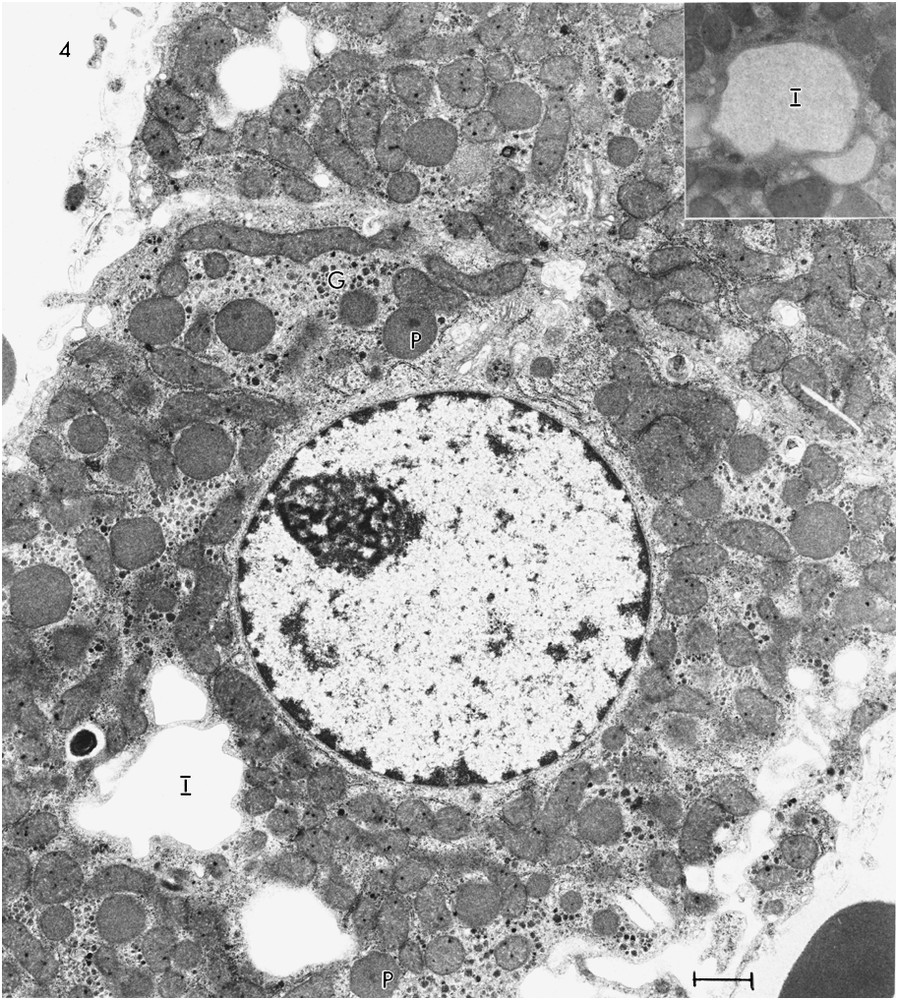
TEM of ultrathin section of hepatocyte from Rat #3 showing several irregularly shaped membrane bound areas (I), which appear empty. The inset shows an area with a grainy appearance. Several peroxisomes (P) are evident as well as widely scattered α-glycogen particles (G).
A photomicrograph of Rat #4 (Fig. 1D) shows some hepatocytes with a few round lipid droplets and, very rarely, one with an irregularly shaped area. An electron micrograph of an hepatocyte of Rat #4 (Fig. 5) shows a very few lipid (round) droplets and an equally rare irregularly shaped area. Peroxisomes were few in number, but there was, again, about a 37% increase in mitochondrial diameter over that in Rat #1. The glycogen appeared as widely scattered α-particles and the rER appeared as cisternae closely adherent to (and often encircling) the mitochondria.

TEM of ultrathin section of hepatocyte from Rat #4 showing a few lipid droplets (L) and irregularly shaped areas (I), one of which contains a myelin figure (arrow), and a rarely seen lysosome (Ly).
To summarize the organelle findings, electron micrographs of ultrathin sections of hepatocytes of all four rats show many mitochondria but almost no Golgi bodies or lysosomes. The hepatocytes of Rat #1 had abundant stacks of cisternal rER, no aspherical inclusions, almost no lipid, and glycogen in pools. The hepatocytes of the other three rats had relatively little cisternal rER, which, in Rat #4, showed a preferential attachment to mitochondria. The glycogen in Rat #1 appeared as pools of β-particles. In Rats #2, #3 and #4, it appeared as widely scattered α-particles. The α-particles were much more numerous. Lipid inclusions were abundant in Rat #2, but essentially absent from Rats #3 and #4. Rat #3 contained many aspherical inclusions; Rat #4 may have had a few. Observations of sER and peroxisomes were inconclusive as both organelles were rarely seen, but several perceptions are presented. In Rat #2, some hepatocytes had very large quantities of sER, especially in areas where there were many lipid droplets. As noted above, the electron micrographs of ultrathin sections of hepatocytes of Rat #1, Rat #2 and Rat #4 show a small and comparable number of peroxisomes. A slightly greater number of peroxisomes was seen in the electron micrographs of Rat #3. There is a marked increase in mitochondrial diameter in Rat #3 and Rat #4. Mitochondrial diameter changes reported were determined by measuring the diameter of the ten largest mitochondria in each electron micrograph presented and taking the average. The predominant presentation mode for each cell component considered to exhibit a consistent structural difference related to diet is summarized in Table 1.
Relation of diet to appearance of organelles
| Diet | Lipid droplets | Aspherical inclusions | rER | Mitochondria | Glycogen | Peroxisomes |
| Control | Very few | None | Many stacked cisternae | Many | Pools of β-particles | Very few |
| Keto | Many | None | Very little | Many; 10% larger | Widely scattered α-particles | Very few |
| Clo | Very few | Many | Very little | Many; 37% larger | Smaller α-particles | Few, but the most of the four |
| Keto/Clo | Very few | Few | Moderate and close to mitochondria | Many, 37% larger | Smaller α-particles | A few |
4 Discussion
Some of the problems imposed by zonation differences on cytological studies of changes in the liver associated with dietary modifications have been mentioned previously [4–6]. These problems merit some elaboration before attempting to determine the possible occurrence and then the significance of perceived cytological (especially ultrastructural) changes in hepatocytes associated with dietary changes. It must be recalled that, superimposed on the enduring ultrastructural and functional differences in hepatocytes from zone to zone, there are, in rats and mice, transient changes that are related to food intake [23]. For example, in rodents, which normally feed at night, there is a diurnal tide of glycogen within the lobules [23]. Also, aggregations of rER differ in reference to the position of a hepatocyte in the lobule [24]. More recently, Gartner and Hiatt [25] state, in reference to hepatocytes. These cells exhibit variations in their structural, histochemical, and biochemical properties, depending on their location within liver lobules. In spite of these caveats, many experimental studies and many studies related to pathological conditions have addressed perceived changes in hepatocyte cytology presumably associated with the experimental procedure or the pathology. Porta et al. [26] reported as most striking an occurrence of parallel arrays of sER with many associated glycogen particles (variably located within the cells) in acute alcoholic hepatitis. Remmer and Merker [27] reported that the repeated administration of phenobarbital results in an increase of sER in hepatocytes. They also reported the same alteration following administration of lipid soluble drugs such as tolbutamide and nikethamide. Tandler et al. [28] reported an increase in the number of mitochondria in the hepatocytes following treatment of rats with hydroxy-cobalbumin, an analogue of vitamin B12.
Especially interesting, however, in relation to our study are the early reports by Ashworth et al. [29] and Bruni and Hegsted [30] of the accumulation of fat in hepatocytes of rats exhibiting acute ethanol intoxication and subjected to a choline-deficient diet, respectively. Ashworth et al. [29] attributed the effect to some metabolic disorder in hepatic cell utilization of lipids. Bruni and Hegsted [30] offered a much more elaborate explanation. Somewhat simplified, their conclusion was that more fat is absorbed and synthesized, that rER becomes abnormal (dilated and shortened cisternae), lipid accumulates within the cisternae, the Golgi apparatus cannot synthesize membranes with a delay of export of very low density lipid (VLDL) into the metabolizing pool with a concomitant diversion of triglycerides to floating (or storage) fat, i.e., that there is an increase in the number and size of lipid droplets in the cytoplasm.
As noted above, the literature contains several reports of the effects on hepatocytes of rats resulting from the administration of special diets. However, a literature search has disclosed no such report on the effect of a ketogenic diet, or of a diet containing clofibric acid, or of a diet combining the ketogenic diet and clofibric acid. Accordingly, this study was undertaken in an attempt to determine if there would be any cytological changes in hepatocytes associated with diets that affect epileptic seizures.
Given the functional and cytological zonation of the liver mentioned above, a concern in this study was to try to represent sections consistently in the periportal zone, as best could be determined, using comparable areas of adjacent thin and ultrathin sections. The effort was very successful for Rat #1 and Rat #2, and moderately successful for Rat #3 and Rat #4. Another concern related to the possible effect of the two feeding schedules. Rat #1, fed rodent chow ad libitum, was free to feed at any time, while those fed calorie restricted diets (Rats #2, #3 and #4) were fed between 08:00 and 12:00 hours and, generally, consumed all their food within a few hours of its presentation. Liver samples from all animals were obtained between 1300 and 1500 h. Hence, animals on these two feeding schedules may have differed in the timing of their tides. This may account for the fact that the glycogen in Rat #1 appeared mainly as large pools.
The most unequivocal cytological finding in this study was the enormous increase in the size and number of lipid droplets in hepatocytes of the rat maintained on a ketogenic diet (Rat #2) compared to the other three rats. Considering all the caveats mentioned above, it is fortunate that this most striking finding occurred in probably the best controlled situation. Accumulation of lipid droplets in hepatocytes has been seen in spontaneously ketotic cows [31] and is present in fatty liver induced either by feeding a choline-deficient diet to both fed and fasted rats [32] or certain oil-rich diets to mice [33] and pigs [34]. In late pregnancy, some women experience acute fatty liver, with microvesicular steatosis, and a similar condition in pregnant female mice has been shown to result from decreased beta-oxidation of fatty acids [35]. Our observation of lipid droplet accumulation in the hepatocytes of rats fed the ketogenic diet is consistent with the findings in animals fed various oils and suggests that it results from a mismatch of lipid abundance and beta-oxidation.
Consistent with that suggestion are the findings in rats fed the ketogenic diet supplemented with clofibric acid, which is a peroxisome proliferator and hypolipidemic agent. The presence of clofibric acid in the ketogenic diet resulted in the nearly complete absence of lipid droplets in the hepatocytes, likely due to increased beta-oxidation of fatty acids. In a strain of knockout mice that developed hepatic steatosis, Toda et al. [36], using biochemical analyses, demonstrated restoration of lipid homeostasis by treatment with bezafibrate, a synthetic peroxisome proliferator. Also consistent with this view is our observation (unpublished) that rats fed a ketogenic diet supplemented with clofibric acid showed significantly higher levels of circulating β-hydroxybutyrate than did those fed the ketogenic diet alone (, unpaired two-tailed t test).
Administration of clofibrate has been repeatedly shown to increase the number of peroxisomes in livers of rodents (e.g., [15,37,38]), the basis of their designation as peroxisome proliferators. Surprisingly, however, addition of clofibric acid to either the normal rodent chow or to the ketogenic diet failed to show a significant proliferation of peroxisomes within the hepatocytes (Rats #3 and #4). As noted, however, the number of peroxisomes in Rat #3, although small, was apparently slightly larger than in the other three rats. This pattern, at least in respect to Rat #3 and Rat #4, is consistent with an interpretation that the ketogenic diet reduces peroxisome proliferation. Our previous demonstration of upregulation of HMG-CoA synthase [39] and our unpublished finding of elevated ketonemia (β-hydroxybutyrate) indicate actions of clofibric acid in the same rat strain and using the same diets as those employed in the present study. There appears, then, to be a modest agreement between these and the current findings.
The noted significant increase in mitochondrial diameter in both Rat #3 and Rat #4 (each with clofibric acid added to the diet) is at odds with earlier findings in mice. Meijer et al. [40] and Lundgren et al. [41] reported that administration of clofibrate to mice increased the number but decreased the size of mitochondrial profiles in the livers of mice and the latter authors found a similar result for rats. We used clofibric acid in this study. It is possible that the effects of clofibric acid and clofibrate (its ester) differ with respect to effects upon mitochondrial size.
Another surprising finding in rats fed diets supplemented with clofibric acid was the presence of large, irregular inclusions. These were numerous in the rat fed the normal diet plus clofibric acid (Rat #3) and present in the rat fed the ketogenic diet plus clofibric acid (Rat #4), but much fewer in number. They were not seen at all in hepatocytes of rats (#1 and #2) that did not consume clofibric acid and they do not appear to have been described elsewhere in the fairly extensive literature on clofibrates.
Less striking, but perceptible, was an increase in the number of elements of vesicular sER in some hepatocytes of Rat #2 compared to the others. A diminution in the quantity of rER cisternae was perceptible in the hepatocytes of all rats, compared to the control, as was a tendency for glycogen to be distributed in large pools of β-particles in the hepatocytes of Rat #1 compared to the other rats. The particles of α-glycogen in Rat #2 were somewhat larger than in any other rat. Cisternal elements of rER showed a definite tendency to approximate the surface of mitochondria in Rat #4.
5 Conclusions
Overall, this study showed that the hepatocytes of rats fed high-fat diets were cytologically essentially normal except for an increase in the number of small lipid droplets and somewhat larger α-glycogen particles. The appearance of mitochondria, sER, rER, Golgi bodies and lysosomes showed no pathologies. Few peroxisomes were evident. The addition of clofibric acid reduced the number of lipid droplets seen in hepatocytes but had modest effects upon the abundance of other organelles, although it was associated with an increase in mitochondrial diameter. Surprisingly, addition of clofibric acid led to only a slight increase in the number of peroxisomes in hepatocytes of rats fed either clofibric acid-containing diet. The only possible pathology seen was the appearance of aspherical inclusions in hepatocytes, especially in rats fed the normal diet with added clofibric acid. We know neither the nature of these inclusions nor their significance. Some appear to be empty and their content resembles that of some lipid droplets that also sometimes appear empty. The majority of them have a grainy texture that differs from that of lipid droplets.
It should be recognized that this is a preliminary study presented because it is the first report of cytological changes in hepatocytes that followed four different dietary regimens. It is hoped that the changes described will prompt others interested in the cytological consequences of diets employed to treat epilepsy to pursue these leads. For example, although the four different diets present four different sets of results, it would be desirable to expand the number of animals maintained on each diet and the number of diet variations. (Our facilities did not allow us to do so.) Additionally, at first consideration, it might seem that morphometric studies of lipid droplet numbers and lipid surface areas per square micrometer of cell surface area, and similar determination of mitochondria, glycogen and peroxisomes would be useful. However, when one realizes that the proportion of the total liver that could be so analyzed is so minute, such studies seem of little real value.