

1 Introduction
Habitat destruction and degradation, mainly driven by agriculture expansion, are the main causes of current biodiversity decline [1–9]. If crops and pasturelands have in average a lower carrying capacity for living communities than natural (or semi-natural) lands, then habitat conversion linked to agriculture expansion may be expected to reduce both the abundance and the diversity in species of these communities, at the world scale. In a recent paper, Gaston et al. [7] estimated that the conversion of of biodiversity-rich natural habitats into farmland, from Neolithic to 1990, has driven the loss of roughly 25 billions birds, i.e., 20 to 25% of the original avifauna. Yet agriculture is expected to expand further in the next decades to support the expansion of world human populations, expected to reach about nine billion people in 2050 [5,10,13]. In 2001, Tilman and his colleagues [10] estimated that, assuming no change in the current agriculture policies and practices, farmlands would increase by about between 2000 and 2050, mainly at low latitudes and at the expense of forests. This expansion would be accompanied by a 2.5-fold increase in pesticide and fertilizer use.
More recently, the Millennium Ecosystem Assessment (MA) has developed four scenarios of land use changes between 1990 and 2050, depending on different socio-economic scenarios [11]. While Tilman et al.'s expectations, assuming no change in the current agricultural trends, match the worst of these scenarios (‘Order from Strength’) for the period 2000–2050, the three others lead to lesser land use changes. Such forecasts of agricultural expansion may be used to derive scenarios about the future of biodiversity. In this paper, we will examine the impact of the expected habitat conversions on the number of bird individuals in the world, and then of birds species.
2 Material and methods
2.1 Main expected changes in land use
For this prospective study, we used estimates and expectations of land use changes computed in the Millennium Ecosystem Assessment for the period 1990–2050, depending on four socio-economic scenarios: ‘Order from Strength’ (OS), ‘Global Orchestration’ (GO), ‘Adapting Mosaic’ (AM), and ‘Techno Garden’ (TG) [11]. These four scenarios correspond to the combinations of two criteria of environmental management: (i) regional (watershed-scale, OS and AM) vs. global (GO and TG), and (ii) reactive (OS and GO) vs. proactive (AM and TG).
More precisely, for each of these scenarios, we considered the spatial changes expected in four enlarged terrestrial biomes: (1) farmland, (2) tropical woods and forests, (3) temperate forests, (4) scrubland and savannah. To compute the area changes in the three first biomes, we used the MA expectations, verifying that the low expansion of forest forecast in the industrial (and temperate) regions is expected to originate almost entirely from farmland. Then, assuming that the expansion of farmland forecast in the developing countries will originate either from tropical wood and forest, or from scrubland and savannah, we subtracted MA's tropical wood and forest values from farmland changes in developing countries to compute the area changes in scrubland and savannah. The expected changes are presented in Table 1.
Expected impact of agriculture expansion between 1990 and 2050 on the world's avifauna abundance, depending on the MA scenario
| Land use | Bird densitiesin 1990 (km−2)a | Expected changes in area between 1990 and 2050 (106 km2)b | |||
| OS | GO | AM | TG | ||
| Farmland | 340 | +11.0 | +5.6 | +5.8 | +4.6 |
| (130–550) | |||||
| Tropical woods and forests | 2200 | −7.1 | −4.6 | −3.7 | −4.3 |
| (1300–3100) | |||||
| Scrubland and savannah | 900 | −4.9 | −4.2 | −4.3 | −3.1 |
| (550–1300) | |||||
| Temperate forests | 1000 | +1.0 | +3.2 | +2.2 | +2.8 |
| (350–1600) | |||||
| Total change in area | – | 0 | 0 | 0 | 0 |
| Expected impact: | |||||
| In billion birds lost | – | 15.3 | 8.8 | 7.8 | 7.9 |
| (10.1–20.7) | (6.5–11.6) | (5.6–10.4) | (5.7–10.6) | ||
| In % of birds lost | – | 17.6 | 10.1 | 9.0 | 9.1 |
| (15.4–25.7) | (8.7–16.5) | (7.8–14.3) | (7.9–14.5) |
a Weighted average and extreme (‘low’ and ‘high’) bird densities per habitat in 1990, computed from Gaston et al. [7].
b Land use changes between 1990 and 2050 estimated from [11] for the four MA scenarios: ‘Order from Strength’ (OS), ‘Global Orchestration’ (GO), ‘Adapting Mosaic’ (AM) and ‘Techno Garden’ (TG). In the last line of the table, the percentages of birds lost depending on land-use change (MA scenarios) and on bird density per habitat (medium and extreme values) are computed relative to the world avifauna in 1990, as estimated by Gaston et al. [7]. See text for details.
2.2 Expected loss of individuals due to habitat conversion into farmlands
To compute the number of bird individuals lost due to the global conversion of known natural habitats into farmland, we used Gaston et al.'s method and data on bird densities per habitat [7].
One first estimates (1) the area of the different habitats i, before conversion at time , and after conversion at time , verifying that , since the total area of the habitats remains constant, and (2) the average density of birds in each of these habitats, before conversion, and after, .
For each of the 15 terrestrial biomes, Gaston et al. gave two extreme (‘low’ and ‘high’) and a medium (‘typical’) 1990 bird density values. We grouped their estimates in the four large land use classes defined above to compute a medium and two extreme 1990 bird density values in each of these classes (see Table 1).
Then, assuming that the number of individual birds varies linearly with the area in each habitat [12,14,15], one can compute the change in the number of birds between and :
2.3 Expected loss of species driven by the loss of individuals
To estimate the loss of bird species expected depending on the loss of individuals, we used an approximation of the species–individual relationship computed by Hubbell in his neutral theory of biodiversity and biogeography [12].
Hubbell's neutral theory, which as an approximation assumes that the different species composing a community have equivalent ecological niches, predicts as a null hypothesis a steady-state distribution of relative species abundance (RSA), which fairly fits wit many empirical data [12,16,17] (but see [18,19]). While the strict assumption of niche equivalence among species is clearly unrealistic, the weaker hypothesis of average fitness equivalence among species leads to the same mathematical predictions and generates the same distribution pattern [17]. Moreover, at constant density of individuals, this theory predicts the well-known Arrhenius law [20], widely used since more than a century [2,14,15], which relates the number of species in a community to the area they occupy.
Following Hubbell, in a closed community (like the global avifauna) counting N individuals, the number of species expected at equilibrium is:
| (1) |
Since the numbers of species (S) and individuals (N) are large, and the individual rate of speciation (ν) close to zero, Eq. (1) can be approximated by:
| (2) |
| (3) |
From this simple individual–species relationship, one can easily compute the impact of reducing from to the total number of individuals of a community of the world, initially counting species, on the number of species at equilibrium:
| (4) |
To compute the total impact of agriculture expansion from Neolithic to 2050 on the world avifauna, in fraction of species to be lost at equilibrium (), we assumed that the initial avifauna counted billion birds (medium and extreme values), as estimated by Gaston et al. [7].
3 Results and discussion
3.1 Expected loss of individuals due to habitat conversion
Applying Gaston et al.'s estimates of bird densities per habitat [7] to the MA expectations of land-use changes between 1990 and 2050 [11], one can forecast an average loss of 7.8 to 15.3 billion birds (i.e., 9 to 18% of the world's avifauna) between 1990 and 2050, in a total range of 5.6 to 20.7 billion birds lost (8 to 26%), depending on the MA scenario (see Table 1).
Among the scenarios, the two proactive (AM and TG) scenarios are the less harmful for the avifauna, with about eight billion birds expected to be lost between 1990 and 2050. This corresponds to a global reduction in density of about 60 birds per square kilometre, for all land not covered with ice. At the other extreme, the reactive and regional ‘Order from Strength’ scenario is expected to reduce by about 15 billion birds the global avifauna by 2050, which corresponds to a reduction in density of about 110 birds per square kilometres. This fits with the MA's expectation that this last scenario has the most detrimental effects on plant biodiversity and ecosystem functioning [11].
Relative to the number of birds at Neolithic ( billion birds) estimated by Gaston et al. depending on the bird densities per natural habitat, a loss of 5.6 to 20.7 billion birds as computed here corresponds to a 6 to 19% loss. Compared to the 21–25% birds lost due to the conversion of of natural habitats in farmlands from Neolithic to 1990, as estimated by Gaston et al. [7], this further loss of 6–19% birds driven by the expansion of 4.6 to of farmlands is much higher per unit area. This is due to the higher carrying capacity for birds of the natural habitats expected to be converted in farmland between 1990 and 2050: while past agriculture expansion involved mostly moderately rich habitats (in regards to birds), like grassland and temperate forests, its current and further expansion involves and is expected to involve mostly very rich tropical forests.
Globally, adding our expectations for the period 1990–2050 to Gaston et al.'s estimations for the period 8000 BC to 1990 AD, we estimate that the expansion of agriculture from Neolithic to 2050 should drive a loss of 27 to 44% of the world avifauna, in birds numbers, depending on the MA scenario and on the bird densities per habitat (see Fig. 1).
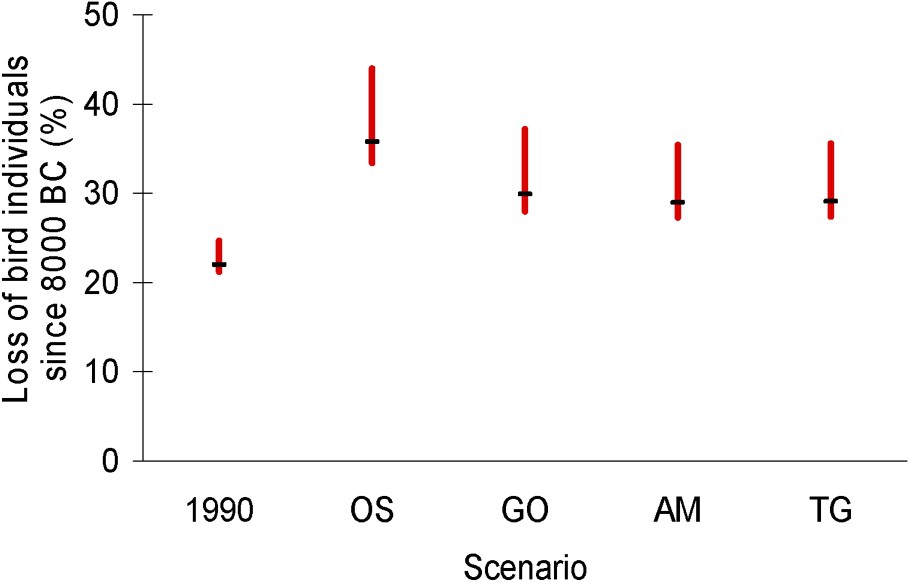
Expected impact of agriculture expansion from 8000 BC to 2050 AD on the world's avifauna abundance, depending on MA scenarios. Left vertical bar: reduction of the world avifauna abundance, in percentage of bird individuals lost, due to agriculture expansion between 8000 BC and 1990 AD, as estimated by Gaston et al. [7]. Four other vertical bars: expected reduction of the world's number of birds due to agriculture expansion between 8000 BC and 2050 AD, assuming the different MA scenarios (OS, GO, AM and TG). In each case, the horizontal bar corresponds to medium bird densities per habitat, while extreme values correspond to extreme (‘low’ and ‘high’) densities per habitat. See text for details.
3.2 Expected loss in individuals depending on farmland quality
In the above estimations, the average losses of birds are computed assuming no change in bird densities per habitat between 1990 and 2050, which is not realistic: in farmland and in other connected habitats, habitat quality and, hence, bird densities will largely depend on agricultural policies and practices.
On the one hand, maintaining the current global agricultural trends – with a 2.5-fold increase of pesticide and fertiliser use forecast by 2050 [10] – can be expected to cause a significant reduction of bird densities between 1990 and 2050 in numerous habitats. In cultivated lands, beside growing uses of chemicals, agriculture intensification tends to homogenise habitats in space and time, which is also expected to reduce biodiversity [3,4,21]. The impact of agriculture intensification on farmland birds has already been demonstrated by a comparison of farmland-bird population trends between 1970 and 1990 in European countries, where intensification varies: farmland birds populations have declined by about 0.8% per year in western European countries, compared with 0.3% per year in eastern European countries, where intensification is lower [22]. (This sharp trend towards decline of western European farmland birds has continued until 2000 [23].) In connected habitats, also, living communities are affected by the intensification of agriculture, through the spillover effects of pesticides [10], increasing isolation and edge effects due to habitat fragmentation [24–28], and secondary effects due to top predators extirpation [29].
On the other hand, reacting to the observed current decline of biodiversity, numerous countries have ratified the 1992 Convention on Biological Diversity and endorsed its 2002 target to reduce the loss of global biodiversity by 2010 [30]. Policies have been proposed to improve habitat quality and to increase biodiversity, noteworthy in cultivated lands, as the EU Action Plan for 2010 and beyond [31]. Although a trade off between biodiversity conservation in farmland and agriculture yield is expected [8], and although present agri-environmental policies have not been very successful [32], it is possible that future policies allow an increase of the mean global bird density in farmlands together with the maintenance or increase of agricultural production, necessary to feed a growing human population.
Not speculating on the efficiency of future farmland management to conserve biodiversity, we considered that the 2050 average density of birds in farmlands may vary between half (170 birds km−2) and twice (680 birds km−2) its 1990 value. Then, assuming as an approximation that the bird densities in the natural and semi-natural biomes will stay equal to their medium values between 1990 and 2050, one can compute the average changes in billion birds of the world avifauna expected in this period as a linear function of the 2050 average bird density in farmland (), depending on the scenario (see Appendix B).
As a result, the average total number of birds is expected to be reduced by 5.9 to 17.1 billion individuals (i.e., by 7 to 20%) between 1990 and 2050, depending on the socio-economic scenario and the conservation policies in farmland (Fig. 2). Note that these latest are expected to be more efficient in the two proactive scenarios, AM and TG, which also lead to lower land-use changes. Here again, these two scenarios are expected to be the less injurious for the world avifauna, while the regional and reactive OS scenario should have the heaviest impact. Differences within each scenario vary between 3 and 6%, and are lower than differences expected among scenarios.
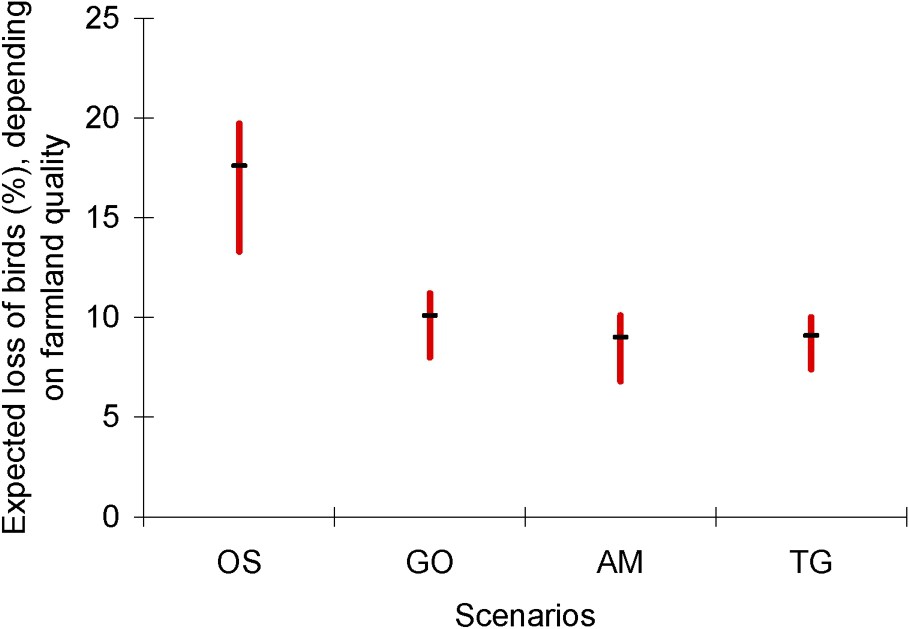
Expected impact of agriculture expansion between 1990 and 2050 on the world's avifauna abundance, computed for the four MA scenarios, depending on farmland management. In these projections, the bird densities per natural habitat are assumed equal to their 1990 medium values. For each MA scenario, the horizontal bar corresponds to a constant average density of 340 birds km−2 in farmland between 1990 and 2050, while the maximum and the minimum values respectively correspond to a doubling and a halving of that density, depending on the efficiency of future farmland management (see text for details).
3.3 Expected loss of species depending on the fraction of individuals lost
From Eq. (4), a reduction by 27 to 44% of the world avifauna abundance between 8000 BC to 2050 AD should result at equilibrium in a loss of about the same fraction of bird species. This estimate, using Hubbell's neutral theory of biodiversity, may be questioned.
Eq. (1) lies on a ‘point-mutation’ model of speciation [12], whose effect is to overestimate the number and relative abundance of rare species at large spatial scale [12,19]. However, if the bias towards rare species is comparable between the two distributions, then our estimation of the fraction of species expected to go extinct due to agriculture expansion may be fairly accurate.
Moreover, the power species–individuals relationship that approximates Hubbell's equation at all spatial scales is an enlarged version of the well-known and used Arrhenius law (see Appendix A) for which, on a global scale, exponent z has been measured close to 1 [2,6,33,34]. As stressed above, using this second relationship leads to the same Eq. (4).
Our estimate might be conservative, as we did not estimate the impact of landscape homogenization, which should lower possibilities of coexistence of species with different niches. On the other hand, conservation policies in favour of threatened species might lower the expectation, although one has to notice that the large number of species concerned might lead to an unbearable cost, as well as countless conflicts between threatened species and socio-economic activities, unless very efficient ways to reconcile human activities with wild species needs [35].
Clearly, these expected extinctions will not be instantaneous: populations may decline for decades or centuries in degraded or/and small habitats before going extinct [6,24–27]. In other words, a large ‘extinction debt’ [24] in bird species might be present in 2050. Viewed from now, these 27–44% bird species doomed to extinction by agricultural expansion from Neolithic to 2050 comprise:
- – (i) a first fraction of species already extinct, due to the past expansion of agriculture;
- – (ii) a second fraction of presently declining species, condemned to extinction by the recent expansion of agriculture – if nothing is done to improve the extent or carrying capacity of their present habitat. This fraction, which should include a great part of the 12% bird species presently registered on the UICN red list [36] as well as other not yet registered declining species, is the present extinction debt in birds due to agriculture. Applying Eq. (4) to Gaston et al.'s results, these two first fractions globally reach 20–25% of the original bird species;
- – (iii) a third and last fraction of species doomed to extinction by agriculture expansion between 1990 and 2050. Applying Eq. (2) to our own estimations, this fraction may vary between 8 and 26% of the present bird species, depending on socio-economical and agricultural policies.
4 Conclusion
From Neolithic to 2050, the impact of agriculture expansion on the global avifauna can be expected to be very large: between 25 and 45%, depending on socio-economical and agricultural policies. Today, with more than six billion humans heavily affecting their environment while still expanding, biodiversity conservation clearly needs proactive measures and strategies. We have verified that the reactive and regional ‘Order from Strength’ MA scenario, which is very bad in terms of socio-economics [11], is also very harmful for the avifauna.
Birds will certainly not be the only group affected by this worldwide habitat conversion and degradation. Plants, insects, and many other organisms belonging to the same trophic chains also suffer from habitat conversion and degradation associated with agriculture expansion [3,4]. While still in needs to be assessed – possibly by the means of Gaston et al.'s method – the impact of agriculture expansion on most ecological communities can be expected high.
Habitat reduction and degradation, mostly due to agricultural expansion, are currently the main but not the only drivers of biodiversity decline [1–9]. Others are overharvesting, climate change, and possibly biological invasions [37]. Regarding birds, hundreds of endemic species have already disappeared from Pacific islands short after their colonisation by humans, due to predation and perturbation [38]. [One may note, however, that most of these insular endemic species had necessarily low population size, hence low life expectancy, before meeting humans.] Climate change is expected to become a major driver of biodiversity decline in the next decades, especially due to its synergy with habitat fragmentation [5,39]. Globally, these factors will add or multiply their impacts on biodiversity.
Biodiversity is precious for many reasons [1,40,41]. Beside their intrinsic and patrimonial values, ecosystems provide numerous ecological ‘services’ to our species, whose rarefaction is already threatening the socioeconomic welfare of many societies [11,34,38]. In order to alleviate the huge and increasing impact of humanity on biodiversity, one needs efficient environmental policies (i) to brake and halt the conversion of biodiversity-rich habitats into croplands, mainly in southern developing countries, and (ii) to increase the carrying capacity of farmlands and other biodiversity poor habitats in both developed and developing countries [8,11,26,35,41–45].
Appendix A A habitat–species relationship
In his unified neutral theory of biodiversity and biogeography, Hubbell [12] studies the function that relates the number of individuals in a community to the number of species expected at equilibrium, assuming the neutrality of the ecological niches. For regional to global scales, this species–individual relationship tends towards the power function:
| (A.1) |
Simply developing this equation in terms of habitat areas and carrying capacity per unit area (i.e., densities of individuals) will allow us to compute the impact of habitat reduction, conversion, and/or degradation on the number of species expected at equilibrium in a community.
Let us first consider a community living in a certain habitat H, extended on a total area A, characterized by a mean density (or mean carrying capacity per unit area) d. Since , the number of species expected at equilibrium in this community is:
| (A.2) |
| (A.3) |
| (A.4) |
For a constant area, i.e., in the case of the conversion or/and degradation of a habitat from density to , Eq. (A.3) simplifies as:
| (A.5) |
More generally, living communities may occupy at two different times ( and ) different habitats i, each one characterised by its density in individuals (or carrying capacity per unit area) , and its area .
As , Eq. (A.1) is equivalent to:
| (A.6) |
Thus, Hubbell's species–individual relationship can easily be developed into a general species–habitat relationship, useful to compute the impact of land-use changes on the number of species composing a community at equilibrium.
At world scale, as computed by Hubbell [12] and verified by empirical measures of the continental species-area relationship [2,6,33,34], exponent z tends towards unity. Eq. (A.6) simplifies then into:
| (A.7) |
Appendix B
Using MA's expectations of land use changes between 1990 and 2050 depending on the socio-economic scenario, and assuming no reduction of bird densities in the natural and semi-natural biomes between 1990 and 2050, one can compute the variation of the world avifauna (ΔN, in billion birds) expected for each MA scenario in this time period as a linear function of the 2050 average bird density in farmland (, in thousand birds km−2):