

1 Introduction
Energy availability, generally determined by the rate of energy supply for an assemblage or a community [1], has long been considered and still emerges as a fundamental constraint to plant and animal species richness [2–5]. The exact form of this relationship seems to depend on the organism group [6], the energy estimates [7], the history of the community assembly [8] and the spatial scale involved [6,9–13]. However, the mechanisms behind this pattern remain unclear [4,5,14–18], although many hypotheses have been suggested [6,15,19]. This is probably partly because few specific predictions of the hypotheses have been explicitly formulated (but see [4,5,17,20,21]).
Previous large-scale studies concerning riverine fishes suggest a positive linear species–energy relationship [22,23]. Considering that the pattern observed at the global scale could hold true at the local scale, we used a standardized sampling protocol to analyze patterns of tropical fish assemblage structure across a gradient of energy in light of the predictions derived from three popular hypotheses, as follows.
The ‘increased population size’ hypothesis [15–17,20,24] postulates that the species richness of an assemblage is regulated in a two-step process. First, as the energy availability of a habitat increases, so does its ability to support more individuals of each taxon (i.e. taxon density). Second, as density increases, local extinction rates decrease, increasing, ultimately, species richness. The ‘increased population size’ hypothesis thus posits that taxon density is limited by habitat energy availability, and assemblage richness is limited by assemblage density [17,20]. It is possible to derive four testable predictions from this hypothesis. Everything else being equal, (a) species richness should increase with energy availability, (b) total abundance of the assemblage should increase with energy availability, (c) the average density per species should increase with energy availability, and (d) species richness should increase with total abundance. Prediction (d) is necessarily true when predictions (a) and (b) are true.
The ‘consumer pressure’ hypothesis [4,15,17,25,26] assumes that the number of trophic levels in a food web is limited by energy. If an increase in energy availability allows the appearance of a specialized predator (highest trophic level), this prevents competitors from reaching densities where they exclude other species [27]. Therefore, diversity increases with energy availability. We can derive three testable predictions from this hypothesis. We should expect (a) a positive relationship between species richness and energy availability, (b) a positive relationship between the density of top-level predator species and energy availability, and (c) a negative relationship between the average density per species in the assemblage and the density of top-level predator species.
Finally, the ‘specialization’ hypothesis [4,15,17,18,21,28] assumes that more energy enables greater development of specialist strategies, either by reducing niche breadth or by generating greater resource diversity and/or habitat heterogeneity. Again in this case, more productive assemblages should have more species. This predicts (a) a positive relationship between species richness and energy availability, (b) a positive relationship between the number of specialist species and energy availability, and (c) a potentially negative relationship between the population size of generalist species and energy availability as a consequence of increasing competition with specialist species [17,21].
We tested these predictions analyzing the relationship between energy availability and fish species richness, density and biomass, in 14 comparable sites within five tropical forested headwater streams belonging to the same drainage basin.
2 Materials and methods
2.1 Choice of sites within the watershed
The study was conducted in five tropical, highly forested, headwater tributaries including 14 sites situated in the upper Rio Chipiriri catchment of the Bolivian Amazon (total area <100 km2). The five tributaries originated in the same region, were similar in size and environmental characteristics (i.e. physical and water quality characteristics), and were located between the coordinates , and , at a mean altitude of 270 m. At the basin scale, based on aerial photographs provided by the PRAEDAC (Alternative Development Strategy Program for the Chapare, Bolivia), the percentage of canopy cover along the five tributaries was identical and approximated 100 percent. At the local scale, the 14 sites had similar habitat characteristics, same regional species pool, and were all heavily shaded with a slight gradient of canopy cover (e.g., Fig. 1) (mean canopy cover 61% ±15.3 SD).

Picture of one of the 14 sites, as an example of the canopy cover significance.
2.2 Estimating fish species richness, density and biomass
Electro-fishing was performed during the dry season from July to October. The 14 sample sites (around 40 m long reaches; mean channel width 3.9–9.7 m) encompassed complete sets of the characteristic stream form (e.g., pools and riffles). For each site, the upstream and downstream edges of the sampled area were blocked by closing nets (1-mm mesh size). Two fishing removals were performed per site, applying a constant fishing effort. The two-pass method gave reliable estimates of fish abundance and richness: about 72 percent (±6.9 SD) of fish and 90 percent (±8 SD) of species were caught during the first pass, thus demonstrating the global efficiency of this method [29]. Fishes were fixed in formol 4% and brought to laboratory for identification to the species level, counting and weighing. Young-of-the-year fishes were never caught during the study and thus cannot influence our results. Density (individuals/m2) and biomass (g/m2) of each species were estimated using the Zippin method [30].
2.3 Fish trophic groups
The adult feeding habits of 44 of the 48 collected species were drawn from stomach contents analysis and from the literature (available on request) at the genus (19 species) or species levels (29 species). Species were then assigned into trophic groups as detritivorous, omnivorous, invertivorous, or piscivorous (see Appendix A). Species belonging to the detritivorous, invertivorous, and piscivorous trophic groups were considered as specialized species (i.e. species having specialized diets), whereas species belonging to the omnivorous trophic group were considered as generalist species. The piscivorous species were also considered as specialized predators for testing the ‘consumer pressure’ hypothesis. However, excluding them from the specialists in the analysis did not change the nature of the relationships between specialist species and productivity.
2.4 Estimating energy availability and other environmental variables
We estimated energy availability within each site by measuring the leaf litter decomposition rate generated by small detritivorous invertebrates, bacteria and fungi (0.073 g/day on average), hypothesizing a constant leaf input between the five tributaries (as, at the basin scale, the percentage of canopy cover along the five tributaries was assumed identical, see above). Allochtonous organic matter such as leaves, entering the system throughout the year, is the major energy source for these tropical forested streams [31–34] like for most small forested streams [35–39], far exceeding autochthonous primary production, which is light-limited [39,40]. Since terrestrial litter inputs drive microbial [39–41] and stream invertebrate [36,37,42] communities, and since litter breakdown results primarily from the activity by those communities (e.g., [31,33,34,43]), our measure of basal productivity (i.e. leaf litter decomposition rate) is thus likely to be the most appropriate measure of energy supply for higher trophic levels in these detritus-based systems [31,37,38].
To measure the leaf litter decomposition rate, we used the litter-bag technique [44]. Recently senesced leaves of Eschweilera coriacea (a common riparian tree species throughout the study area) were collected during late September from a single tree. Approximately 10 g of leaves, previously dried to constant mass at 65 °C, were weighed and placed into doubled 1-mm plastic mesh litter bags ( standardized bags). Three replicate bags per site were placed on the stream bottom, weighed, and secured. Following deployment, the litter bags were retrieved after 45 days (about 30% of leaf mass loss). The leaves were rinsed individually with water to remove adhering fine particulate matter and dried to constant mass at 65 °C. Since the decay rate was measured on a single time interval, the productivity rate per site was estimated by the mean leaf weight loss among the replicates, rather than applying the commonly used negative exponential model [43,44].
To not confound the potential effect of factors other than energy on assemblage richness and structure, we estimated several local environmental variables using standard methods. These variables included, for each sampled site: total surface area sampled (mean value ), mean flow velocity (mean value ), mean depth (mean value ), mean width (mean value ), percent of canopy cover (mean canopy cover ), water conductance (mean value ), pH (mean value ), and substratum type [45] later converted into a diversity index (Shannon–Weiner index; mean value ). Depth, width, flow velocity and substratum type were measured by cross-stream transects at 3–5 m intervals (depending on the stream size), with sampling points spaced 1-m apart (only for depth, flow velocity and substratum type) [45]. Shading by overhanging vegetation (i.e. percentage of canopy cover) was visually assessed in evenly spaced cross-channel transects. These environmental variables are strong descriptors of physical and hydrological conditions at the local scale and can be considered as important abiotic determinants of richness and structure of local fish assemblages (see [46] for a review).
2.5 Estimating secondary productivity
The energy flux reaching our fish assemblages should reflect the production of detritivorous invertebrates, in turn depending on the availability and decomposition rate of terrestrial litter, and eventually on aquatic primary production. In our sites, aquatic primary production was negligible (for our sites, mean chlorophyll a concentration for phytoplankton and mean chlorophyll a for periphyton ) and availability of terrestrial litter was assumed constant (i.e. at the basin scale, the percentage of canopy cover along the five tributaries approximated 100%). Then, to ascertain that our measure of energy availability (leaf litter degradation rate) was not speculative, we sampled macroinvertebrates assemblages to verify that secondary production (i.e. detritivorous invertebrates) was also driven by allochtonous organic matter degradation. Five samples of the benthos were taken (at each site) using a Surber sampler (0.09 m2 sampled area, 250 μm mesh size). All five replicates were taken in a single riffle with similar depth, flow and substrate. Samples were fixed in a 4% formalin solution. Further, macroinvertebrates were sorted and identified to genus, counted and assigned to functional feeding groups following Tomanová et al. [47], who detailed food resources consumed by invertebrates found in comparable Bolivian streams. Analyses of feeding groups were done according to their relative abundance in each assemblage and were restricted to shredders and scrappers (i.e. the two functional guilds directly related to leaf litter degradation). Shredders play a major role in energy and nutrient transfer in streams by participating actively in the fragmentation and decomposition of leaves, and usually prefer conditioned leaves (i.e. leaves partially degraded by microbial communities) [31,32,48,49]. We can thus suppose that an increase in leaf litter degradation rate will influence positively the shredders guild. Scrappers usually feed directly on the fungi, algae and bacteria colonizing leaf matter and should thus also increase with leaf litter degradation rate. We used the proportional representation of these two guilds instead of absolute abundance to correlate with energy availability in order to minimize potential effects of fish predation on macroinvertebrates [50].
2.6 Data analysis
Stepwise multiple regression models (both forward and backward procedures) were used to test the dependence of fish species richness, density and biomass (for the entire assemblage and for the different trophic groups) on energy availability (i.e. leaf decomposition rate) and other potential factors. We computed stepwise models rather than entire models because there was some co-linearity among our environmental variables (see Appendix B). The square of the variable energy availability was added to the models to test for curvilinearity. When we found a significant quadratic effect for this variable, we then determined whether it was significantly unimodal (hump-shaped or U-shaped) using a statistical test developed by Mitchell-Olds and Shaw [51] (MOS's test, see [11] for its use in the context of species–energy relationships). This test determines whether the curvilinear relationship reaches a maximum or minimum within the observed range of energy availability [11]. All continuous variables were kept untransformed as they were all near normally distributed.
Spatial autocorrelation may be present in this local-scale stream system potentially leading to cases of pseudoreplication between sites. Two approaches were applied to avoid this bias: by first adding a categorical variable to the above regression models with a unique value for each tributary; and next by testing for spatial autocorrelation using Moran's I coefficients [52]. For that purpose, we constructed a distance class matrix where a value of 1 corresponds to sites separated by less than 5 km, a value of 2 corresponding to sites separated by a distance between 5 to 25 km, and a value of 3 corresponding to sites separated by more than 25 km. For each distance class, standardized Moran's I coefficients were computed for values of total species richness and leaf decomposition rates. A Bonferonni-corrected significance level (0.05/3) was used to assess the probability of observing at least one significant autocorrelation coefficient.
3 Results
Concerning invertebrates assemblages, both percents of shredders and scrappers were positively and significantly related to our measure of available energy (% shredders , ; % scrappers , ) (Fig. 2).

Relative abundance of shredders and scrappers (invertebrate guilds) as a function of leaf decomposition rate.
Concerning fish assemblages, results of the regression models are summarized in Table 1. Here, in the absence of spatial autocorrelation between sites (see Appendix C; non-significant Moran's I coefficients for species richness and energy availability, following Bonferroni-corrected significance level), of a tributary effect and of other potential effects (Table 1), total species richness increases with energy (Fig. 3a). Even if a statistically significant level off can be noted for the higher energy sites (quadratic regression , ), there was no evidence of a unimodal relationship ( for the MOS's test).
Results of stepwise multiple regression models of fish species richness, density and biomass (for the entire assemblage and for the different trophic groups) against energy availability (i.e. leaf decomposition rates) and other independent variables
| TSR | PSR | SSR | GSR | TD | PD | SD | GD | TB | PB | SB | GB | |
| 0.00 | 0.42 | 0.00 | ||||||||||
| Intercept | ns | ns | ||||||||||
| Leaf decomposition rate (day−1) | ns | ns | ns | |||||||||
| (Leaf decomposition rate (day−1))2 | ns | ns | ns | ns | ns | |||||||
| Surface area sampled (m2) | ns | ns | ns | ns | – | – | – | – | – | – | – | – |
| Flow velocity (m/s) | ns | ns | ns | ns | ns | ns | ns | ns | ns | ns | ns | ns |
| Mean depth (m) | ns | ns | ns | ns | ns | ns | ns | ns | ns | ns | ns | |
| Mean width (m) | ns | ns | ns | – | – | – | – | – | – | – | – | |
| Substatum diversity | ns | ns | ns | ns | ns | ns | ns | ns | ns | ns | ns | ns |
| Canopy cover (%) | ns | ns | ns | ns | ns | ns | ns | ns | ns | ns | ns | ns |
| Tributary | ns | ns | ns | ns | ns | ns | ns | ns | ns | ns | ns | ns |
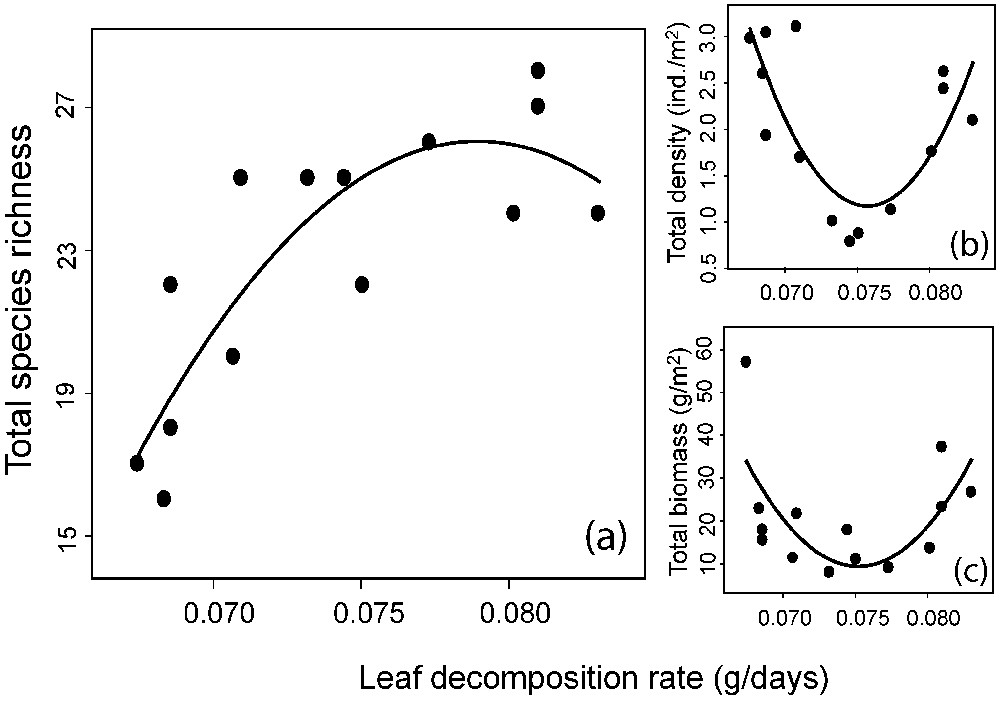
Total fish species richness (a), total density (b) and total biomass (c) as a function of leaf decomposition rate. Species richness presents a significant (P=0.001) quadratic pattern, whereas significant U-shaped patterns (see methods) are presented for total density (P=0.007) and total biomass (P=0.041).
When we examined the relationship between total density or total biomass and energy, and in the absence of other potential effects, we found a statistically significant U-shaped relationship for both (Fig. 3b; , , and for the MOS's test and Fig. 3c; , and for the MOS's test). A similar pattern was observed when replacing in the model the total density by the average density per species in the assemblage (, and for the MOS's test). When separating the assemblages into trophic groups, we found a significant U-shaped relationship between predator density or biomass and energy (Fig. 4a; , and for the MOS's test and Fig. 4b; , and for the MOS's test) and a positive relationship between predator density and the average density per species (Fig. 4c; , ). Concerning specialist and generalist species, we observed a positive relationship between specialist species richness and energy (Fig. 5a; , ), but no relationship between generalist diversity and energy was found (Fig. 5a). Furthermore, we found no relationship between specialist density or biomass and energy (Fig. 5b and c) and a U-shaped relationship between generalist density or biomass and energy (Fig. 5d; , and for the MOS's test and Fig. 5e; , and for MOS's test). Finally, the relationship between total species diversity and energy was almost exclusively driven by specialist species richness (total species richness vs. specialist species richness; , ) and the U-shaped relationship between total density and energy was mostly driven by generalist density (total density vs. generalist density; , ).
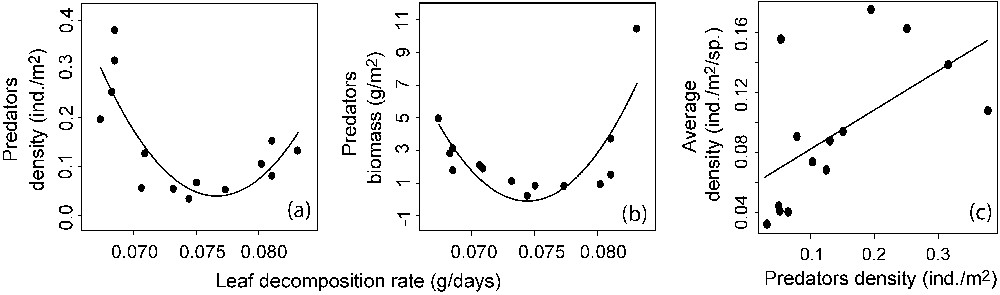
Predators density and biomass as a function of leaf decomposition rate (a and b) and average density per species as a function of predators density (c). Linear and quadratic regressions are presented when significant (P<0.05; see methods).
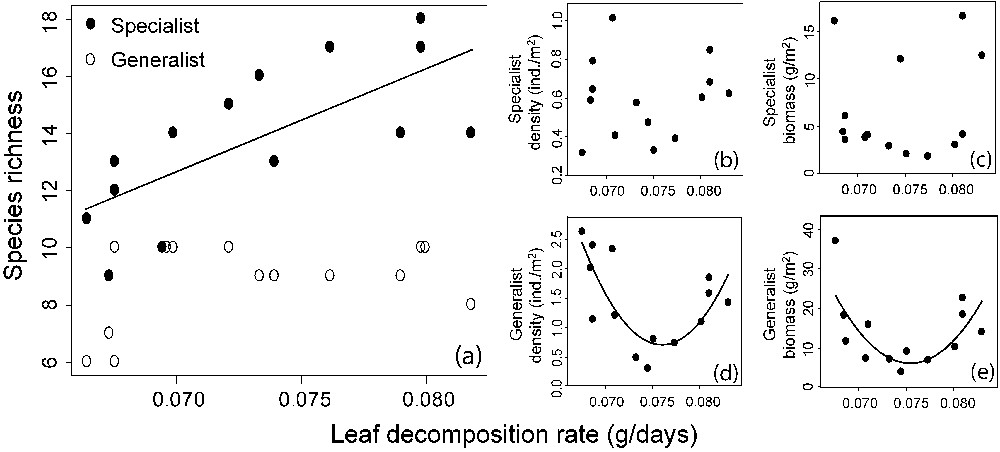
Fish species richness for specialist and generalists as a function of leaf decomposition rate (a). Density and biomass as a function of leaf decomposition rate: (b) and (c) for specialists; (d) and (e) for generalists. Linear and quadratic regressions are presented when significant (P<0.05; see methods). For specialist species richness, the significant effect of stream width has not been factored out in order to visually compare richness values between specialist and generalist species.
4 Discussion
In our study sites, the leaf litter decomposition rate was positively related to secondary production (i.e. percentage of detritivorous invertebrates in each assemblage). As the percentage of canopy cover along the five tributaries was considered identical at the basin scale (see Section 2) and as sites primary productivity was marginal, our measure of leaf degradation is a relevant measure of energy supply for fish assemblages in these systems.
Fish species richness in this local-scale study increased with energy availability. This result is consistent with the prediction shared by the three presently tested mechanisms and provides no means for discriminating between them. However, the U-shaped relationships between (1) the total density (and total biomass) of the assemblage and energy and (2) the average density per species and energy are both inconsistent with predictions (b) and (c) of the ‘increased population size’ mechanism. Therefore, this last mechanism cannot be the direct cause of the noticed positive species–energy relationship.
Furthermore, the U-shaped relationship between predator density (or biomass) and productivity, and the absence of a negative relationship between predator density (as a measure of consumer pressure) and the average density per species are inconsistent with the predictions (a) and (b) associated with the ‘consumer pressure’ hypothesis, and thus refute this hypothesis.
In contrast, the positive linear relationship between specialist richness and energy availability was consistent with prediction (b) of the ‘specialization’ hypothesis. Nevertheless, the U-shaped relationship between the population size of generalist species and energy availability is inconsistent with prediction (c) of this hypothesis. Therefore, if prediction (c) is correct, the ‘specialization’ hypothesis receives only equivocal support from our findings.
A problem arises in explaining the U-shaped relationship between total density and energy availability (Fig. 3b). Our interpretation assumes that the degree of interspecific competition between members of the community depends on both species richness and productivity gradients (levels) (Fig. 6). At low productivities, fish communities are species-poor and generalist species exhibit high densities. As resource availability rises (i.e. productivity), more specialists enter the communities, generating competitive interaction with generalists, which are usually inferior competitors on all except a few rare resource types [15,26,53]. This could explain the decreasing part of the U-shaped relationship (i.e. a phenomenon termed density overcompensation [54,55]) found between total density and productivity as this relationship is almost exclusively driven by generalist species. At intermediate productivities, community species richness levels off (Fig. 6). Beyond that level, the quasi-absence of new competitors entering the community allows, together with rising productivity, reduced competition, resulting in an increase in the average density per species and consequently in total density (Fig. 6; a phenomenon termed negative density compensation [54,55]).
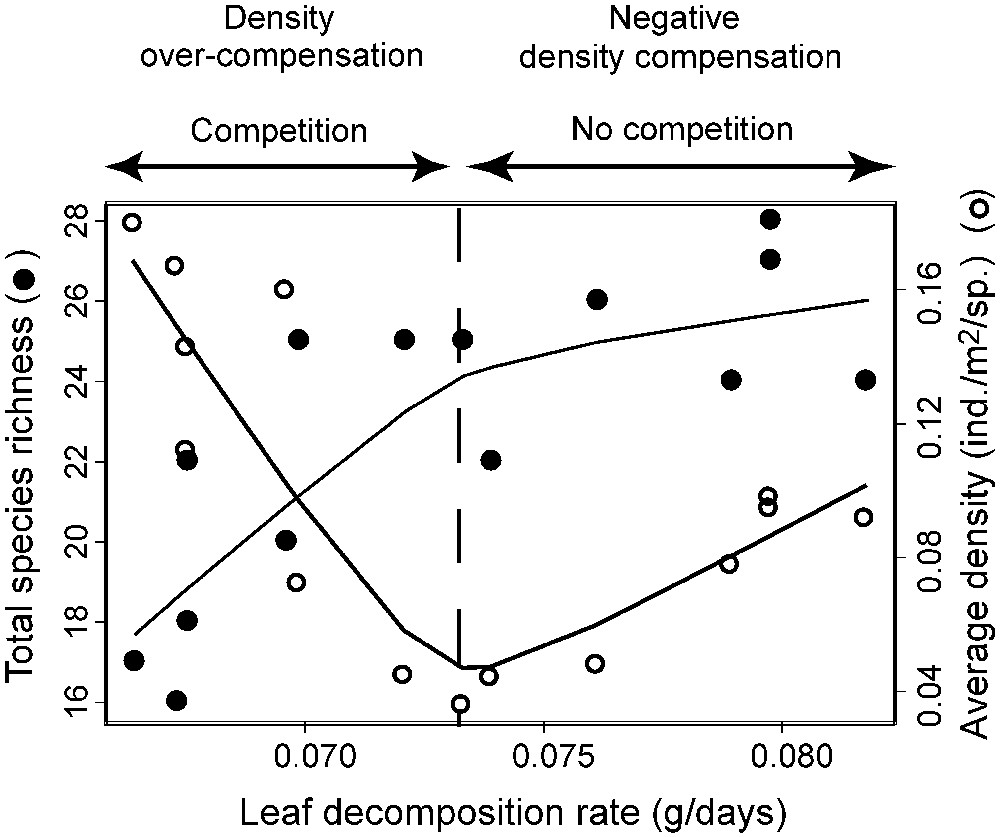
Fish species richness and average density per species as a function of the leaf decomposition rate. Smoothed curves are given for both variables. A doted line indicates the intermediate productivity level separating the degree of interspecific competition resulting in density overcompensation or negative density compensation.
To summarize, the species trophic status (i.e. their degree of trophic specialization), combined with the resource availability within a site, seems to determine the degree of competitive exclusion between species and, ultimately, total species richness and total abundance.
There is a popular view that spatial scale dictates the form of the richness–energy relationship [6,9–13,56]. It has been noticed that the relationship generally follows a ‘hump-shaped’ (unimodal) trajectory at the local scale, and that at larger spatial scales, the relationship becomes most often monotonically positive [6,11]. However, the basic underlying conditions that could produce unimodal or monotonic patterns are still largely unresolved [15], even if some recent studies [11,57] have hypothesized that scale dependence in richness–energy relationship could result from the way in which species turnover changes with energy availability. The positive relationship observed here between local fish species richness and energy availability, together with a previous similar relationship (richness monotonically increases with energy) obtained at the global scale [22,23] would tend to show that the shape of the relationship is invariant with spatial scale for this organism group. This remains to be tested in future studies.
Acknowledgements
This work was supported by the ‘Institut de recherche pour le développement’ (IRD) and by the long-term research plans of the Masaryk University (Czech Ministry of Education, MSM 0021622416). The original idea of doing this work emerged after stimulating discussions at the Energy and Geographic Variation in Species Richness working group supported by the National Center for Ecological Analysis and Synthesis (NCEAS), a Center funded by the NSF (Grant No. DEB-0072909) and the University of California at Santa Barbara. We are grateful to David Currie, Bradford Hawkins, Olivier Dangles, Éric Chauvet, Thierry Boulinier, and Kirk Winemiller for discussion and/or comments on previous versions of the manuscript.
Appendix A Fish species list and trophic regimes
| FAMILY Species | Trophic regime |
| CHARACIDAE | |
| Acestrorhynchus sp. | Piscivorous |
| Astyanacinus sp. | |
| Astyanax abramis | Omnivorous |
| Astyanax bimaculatus | Omnivorous |
| Astyanax lineatus | Omnivorous |
| Gephyrocharax sp. | Invertivorous |
| Hemigrammus cf. lunatus | Omnivorous |
| Hemigrammus sp. | Omnivorous |
| Hemibrycon sp. | Invertivorous |
| Knodus sp. | Omnivorous |
| Moenkhausia oligolepis | Omnivorous |
| Phenacogaster cf. pectinatus | Omnivorous |
| Tyttocharax madeirae | Invertivorous |
| Characidae sp.1 | |
| Characidae sp.2 | |
| Characidae sp.3 | |
| GASTEROPELECIDAE | |
| Thoracocharax sp. | Invertivorous |
| ERYTHRINIDAE | |
| Hoplias malabaricus | Piscivorous |
| CHARACIDIIDAE | |
| Characidium bolivianum | Invertivorous |
| Characidium sp. | Invertivorous |
| LEBIASINIDAE | |
| Pyrrhulina vittata | Invertivorous |
| PARODONTIDAE | |
| Parodon sp. | Detritivorous |
| PROCHILODONTIDAE | |
| Prochilodus nigricans | Detritivorous |
| CURIMATIDAE | |
| Steindachnerina dobula | Detritivorous |
| Steindachnerina guentheri | Detritivorous |
| ANASTOMIDAE | |
| Leporinus striatus | Omnivorous |
| GYMNOTIDAE | |
| Gymnotus carapo | Invertivorous |
| HEPTAPTERIDAE | |
| Imparfinis | Invertivorous |
| Khamdia quelem | Omnivorous |
| PIMELODIDAE | |
| Pimelodella sp.1 | Omnivorous |
| Pimelodella sp.2 | Omnivorous |
| PSEUDOPIMELODIDAE | |
| Batrochoglanis raninus | Piscivorous |
| TRICHOMYCTERIDAE | |
| Trichomycterus sp. | Invertivorous |
| CALLICHTHYIDAE | |
| Callichthys callichthys | Omnivorous |
| Corydoras sp. | Omnivorous |
| LORICARIIDAE | |
| Ancistrus cf. hoplogeny | Detritivorous |
| Ancistrus sp.1 | Detritivorous |
| Ancistrus sp.2 | Detritivorous |
| Farlowella sp. | Detritivorous |
| Rinelricaria lanceolata | Detritivorous |
| Rinelricaria sp. | Detritivorous |
| BELONIDAE | |
| Potamorrhaphis sp. | Invertivorous |
| SYNBRANCHIDAE | |
| Synbranchus sp. | Piscivorous |
| CICHLIDAE | |
| Apistograma sp. | Invertivorous |
| Cichlasoma boliviense | Omnivorous |
| Crenicichla semicincta | Piscivorous |
| Mikrogeophagus altispinosa | Omnivorous |
| Satanoperca sp. | Invertivorous |
Appendix B Correlation matrix among environmental variables
| Total surface | Width | Depth | Flow velocity | Substratum diversity | |
| Width | 0.637 | − | − | – | − |
| Depth | −0.465 | 0.112 | − | – | − |
| Flow velocity | 0.109 | 0.374 | −0.307 | – | − |
| Substratum diversity | 0.387 | 0.303 | 0.020 | 0.085 | − |
| Canopy cover | 0.040 | −0.144 | −0.659 | 0.662 | −0.162 |
Appendix C Standardized Moran's I values for each distance class and associated p-values (in brackets) for the decomposition rate and total species richness
| Distance class (km) | Leaf decomposition rate | Total species richness |
| 1. <5 | 2.17 (0.03) | −0.05 (>0.1) |
| 2. 6–25 | −0.12 (>0.1) | 0.15 (>0.1) |
| 3. >26 | −1.67 (0.1) | −0.07 (>0.1) |