

1 Introduction
Due to the tendency to move over large areas, megafauna fulfil a comparatively important function in the horizontal transfer of nutrients across landscapes through the dissemination of their waste (i.e. urine and feces). Furthermore, when large groups of animals remain in one place for a period of time, they produce vast amounts of waste that subsequently concentrate nutrients into “biogeochemical hotspots” [1,2]. These hotspots, defined as small areas within a landscape matrix that show comparably high reaction rates relative to the surrounding areas [1], can also be due to decaying carcasses; they have been noted in both terrestrial and aquatic ecosystems [1,3–7].
In their roosting sites (i.e. caves, abandoned mines and large trees), bats can form one of the largest animal aggregations with thousands to 20 million individuals for the Brazilian free-tailed bat in Texas [8]. Due to these numbers, bats play an ecological role in soil fertility and nutrient distribution within ecosystems via the guano they spread while foraging at night. For instance, a large colony of Brazilian free-tailed bats redistributes 22 kg of nitrogen per year in the form of guano [9]. Also, bat guano provides the primary organic input in caves, supporting a great diversity of organisms belonging to different trophic levels [10–15].
Because they occupy a central place in the functioning of entire tropical rainforest ecosystems, we used ants as ecological indicators to study the impact of bats around their roosting sites. Indeed, ants generally constitute the largest fraction of the animal biomass, are ubiquitous and play different roles in the food web as they can be herbivores, fungus growers, generalists, scavengers or predators [16,17]. We hypothesized that the high density of guano dropped inside and around a dry cave serving as a bat roosting site in a Guianese tropical rainforest might positively affect the detritus-based brown food web through an increase in feces-consuming detritivores and their predators, including ants. There could also be an indirect effect through nitrogen absorption by plant roots followed by its incorporation in plant tissues, including leaves (favoring leaf-cutting, fungus-growing ants) and exudates (favoring ants attending hemipterans for their honeydew and nectarivorous ants). Also, nitrogen fertilization might increase leaf-litter quantity and quality with more fallen leaves meaning more habitats available for litter-dwelling organisms.
We firstly aimed to verify if the large amount of bat guano around the focal cave favors ant species richness and/or certain ant functional groups. In a context of using ants as bioindicators, functional groups can provide a predictive understanding of community responses to modifications to the environment because they are related to ecological functions [18–20]. Second, using stable isotopes, we aimed to determine the impact of bat guano along the trophic chain. Because the ratios of the heavy to light stable isotopes of consumers reflect the isotopic compositions of their diets [21,22], we verified if the tissues of ants from the focal cave and its immediate surroundings had different levels of 15N compared to ants from a distant, control area.
2 Methods
2.1 Study site
Kaw Mountain rises up over the French Guianese coastline, facing the Atlantic Ocean between the villages of Roura (04°43’42”N; 52°19’27” W) and Kaw (04°36’33“N; 52°7’2”W). Covering an area of 38,200 ha, this 40-km-long series of hills more than 300 m in height peaks at 462 m. This is one of French Guiana's wettest areas with 4000 mm to 8000 mm of precipitation on the uppermost parts of the slopes facing the ocean and so directly exposed to the trade winds [23,24].
The rock shelters and dry caves formed by the hard lateritic crust in Kaw Mountain have a specific invertebrate fauna and provide shelter to the Guianese cock-of-the-rock (Rupicola rupicola), an emblematic bird, and numerous bat species [25]. The bat species, which make extensive use of these caves as nursery roosts, include: Pteronotus parnellii (by far the most frequent; insectivorous, feeds primarily on moths and beetles), Lonchorhina inusitata (aerial insectivore), Furipterus horrens (insectivorous, mainly preys on Lepidoptera), Anoura geoffroyi (feeds on nectar, fruit, pollen and insects) and Lionycteris spurrellii (nectar-feeder) [26,27]. Classically, oligochaetes and several types of arthropods including isopods, millipedes, centipedes, amblypygids, pseudoscorpions, spiders, mites, cockroaches, crickets and ants develop on bat guano in this cave ([27]; BC and AD pers. obs.; for Neotropical cave fauna developing on bat guano, see [14] and papers cited therein).
The present study focused on the sole dry cave in the area which is not located in a nature reserve and does not open out onto a cliff side and so has easy access and permits comparisons between the immediate surroundings and control areas. Situated in the middle of the rainforest, this cave serves as a bat nursery roost composed of two wide chambers (ca. 27 × 30 m and 19 × 58 m) separated by a wall, plus different smaller cavities and a third, circular area (ca. 10 m in diameter) whose ceiling collapsed, permitting some trees to take root on the mass of fallen rocks and sediments below. This area initially inter-connected the two wide chambers.
2.2 Experimental protocols
We conducted a study on ant species richness by comparing semicircular transects around the cave with a linear control transect situated 500 m further on the same slope and at the same height on the slope in the forest and so exposed to similar ecological conditions, including the quantity of rainfall. For each transect, we selected 50 sampling points separated by 10 m. The transect around the cave consisted of a first semicircle of 80 m in diameter passing ca. 6 m from the main cave entrance and from the opened, circular area (125.6 m in length; 13 sampling points); the second semi-circle was placed 10 m further (100 m in diameter; 157 m in length; 17 sampling points) as was the third semi-circle (120 m in diameter, 188.4 m in length; 20 sampling points).
We used the Winkler method [28] because it is highly recommended for ant inventories in forest-like habitats where leaf litter abounds [29]. We collected ant workers from 1 m2 leaf-litter samples that were weighed (we did not record a significant difference between transects; mean ± SE; 326.0 ± 59.48 g vs. 386.5 ± 41.65 g; t = 0.8338; df = 98; P = 0.41). We applied the “Ants of Leaf Litter” (ALL) Protocol [30], which suggests using at least 20 sampling points separated by 10 m intervals to collect between 45 and 70% of the ant fauna at a given site [31].
All of the ant samples were first preserved in 70% ethanol. The AntWeb [32] permitted us to sort the ants to species or morphospecies. Voucher specimens were deposited in the Laboratório de Mirmecologia, Cocoa Research Centre CEPEC/CEPLAC (Ilhéus, Bahia, Brazil).
2.3 Occurrence-based curves and comparison of ant assemblages from the two transects
Two species × sample incidence matrices (one per habitat) were analyzed and compared. Because ants are aggregated in colonies contrary to non-social insects whose individuals have an equal probability of being caught during sampling, presence/absence data are preferred over abundance data in the analyses [33]. Thus, only species occurrences (i.e. the number of times that a given species was collected at a sampled site) were taken into account [31,33].
Species rarefaction curves were plotted using EstimateS 9.1 software [34] with 500 randomizations of the sampling order without replacement on the presence-absence data matrices [35].
Local (α) diversity in the two habitats was analyzed using Simpson's index [36] and Shannon's entropy index [37]. The global turnover between the two ant assemblages was analyzed using Whittaker's β-diversity index based on presence/absence data (see [38]): βW = (S/α) – 1 where S is the total number of species in the habitat and here α is the average species richness of the Winkler samples [39]). All of the diversity indexes and their pairwise comparisons, including Shannon's diversity t-test, were conducted using PAST software [40]. To obtain information on the magnitude of the differences, we established the ‘effective number of species’, which corresponds to the exponential of the Shannon entropy (H’) (see details in Jost [41,42]).
To test the influence of bats on ant communities through their droppings (there is a greater density of guano around their roosting site), we distinguished five principal functional groups of ants (i.e. leaf-cutting, fungus-growing ants; other herbivorous ants feeding mostly on extrafloral nectar and hemipteran honeydew; detritivorous fungus-growing ants; generalists; and predators) (Appendix S1, supplementary material). Note that the subfamilies Ponerinae and Myrmicinae were recently revised [43,44]. The impact of bat guano around the cave on the number of species in the different functional groups of ants, compared to a control sampling, was modeled using a generalized linear model framework with a Poisson error distribution because our response variable (i.e. the number of species recorded in a Winkler quadrat) was discrete with positive values. The significance of the effect of the proximity of the cave (large amount of guano) was assessed through the Wald statistic Z (R software [45]).
2.4 Stable isotopes: ants from the cave and the surroundings versus a control lot
Stable isotope analyses are based on naturally-occurring differences in the ratios of heavy to light isotopes, their delta value being calculated by comparing the ratio heavy to light isotope to a specific standard and expressed in ‘‰’ (i.e. 15N/14N: δ15N). The isotopic nitrogen composition of animal tissue reflects the isotopic ratio of food eaten with a δ15N enrichment of 3–5‰ at each trophic level. Also, the δ15N in plant tissue reflects that of the nitrogen source [22].
Consequently, we tested the impact of bat guano on the δ15N values by comparing the ants from the cave and its immediate surroundings with those from a control lot collected further away. We looked for ants inside the cave, in the light-exposed zone of the cave (collapsed ceiling) and the immediate surroundings of this area (less than 4 m) during a systematic search. We also took samples of Pseudomyrmex penetrator obligatorily associated with the myrmecophyte Tachigali aff. paniculata [46]. The control lot corresponded to samples of the same ant species recorded during an extensive search 0.5–1.0 km from the studied cave on the same slope of Kaw Mountain.
Each time, whatever their size, we gathered eight workers (two from four different nests); their gaster was removed to avoid contamination by food. For P. penetrator, difficult to find in this area, the eight workers came from one colony in the surroundings of the cave and another situated in the control area. We also collected eight samples of leaf litter from the immediate surroundings of the cave and from two control areas (the places where we gathered the control ants). These leaf-litter samples were cleaned and those from each area were pooled before being vacuum-dried and ground using a mixer mill.
Bat guano is composed of feces and urine which, as for fresh manure, often show marked differences in δ15N signatures. Urine is generally depleted in 15N relative to the animal's diet, while feces are enriched or remain the same. During the first days after deposit, the microbial degradation of urinary urea results in the volatilization of ammonia (hence the odor around the cave); 14N is emitted with the ammonia, so that 15N concentrates in the guano, increasing δ15N [47–49]. Because in the focal cave bats congregate in nooks in the ceiling, there is below, on the ground, the formation of circular areas with, at their centers, a viscous compound composed of urine and fresh feces. All around, the guano is much drier but still friable, so that burrowing cockroaches, primary consumers, concentrate there. We took samples from four of the latter zones (hereafter, “fresh” guano) and from four other zones where the guano is harder (hereafter, “older” guano). Each of the two series of samplings was pooled. Using a stereomicroscope, we extracted mites, small worms and arthropod eggs from the two types of guano samples to avoid bias.
All of these samples were sent to the Colorado Plateau Stable Isotope Laboratory (Northern Arizona University, USA), where they were freeze-dried and grounded into a homogeneous powder. Stable isotope analyses were conducted on ca. 200 mg of each sample using a Thermo-Finnigan Deltaplus Advantage gas isotope-ratio mass spectrometer interfaced with a Costech Analytical ECS4010 elemental analyzer. The natural abundances of 15N were calculated as follows:
δX = [(Rsample/Rstandard)–1] × 1000
where X is the element of interest, and Rsample and Rstandard the molar ratios (i.e. 15N/14N) of the sample and the standard (atmospheric nitrogen) [21,22].
We compared the δ15N values using the Wilcoxon pairwise comparison (exact P value; GraphPad Prism version 5.00 for Windows [50]).
3 Results
3.1 Comparison of the ant communities from the surroundings of the cave and a control area
A total of 172 ant species belonging to 11 subfamilies (1463 occurrences) was collected during the Winkler sampling; nine other species were noted during the sampling in the cave and its immediate surroundings (a total of 181 ant species; Appendix S1). The most species rich subfamily was the Myrmicinae (105 species) and the most speciose genus was Pheidole (31 species). One can note the presence of Tatuidris tatusia, a very primitive ant from the subfamily Agroecomyrmecinae (Appendix S1; Jacquemin et al., 2014).
We noted 127 ant species in the surroundings of the cave and 126 in the control transect (Appendix S1). The ant fauna was very rich (0.9782 < Simpson index < 0.9789), the species richness and evenness were not significantly different between the two compared areas (Simpson index: P = 0.68; Whittaker pairwise comparison: P = 0.35; Shannon diversity t-test: 4.188 vs. 4.139; t = 0.88964, df = 1440.5; P = 0.37). Furthermore, the values of the Shannon entropy (H’) were quite similar (4.22 around the cave vs. 4.27 for the control transect) as were the effective number of species (68.03 vs. 72.16). The whole confirms the similarity of the accumulation species curves with the 95% intervals greatly overlapping (Fig. 1).
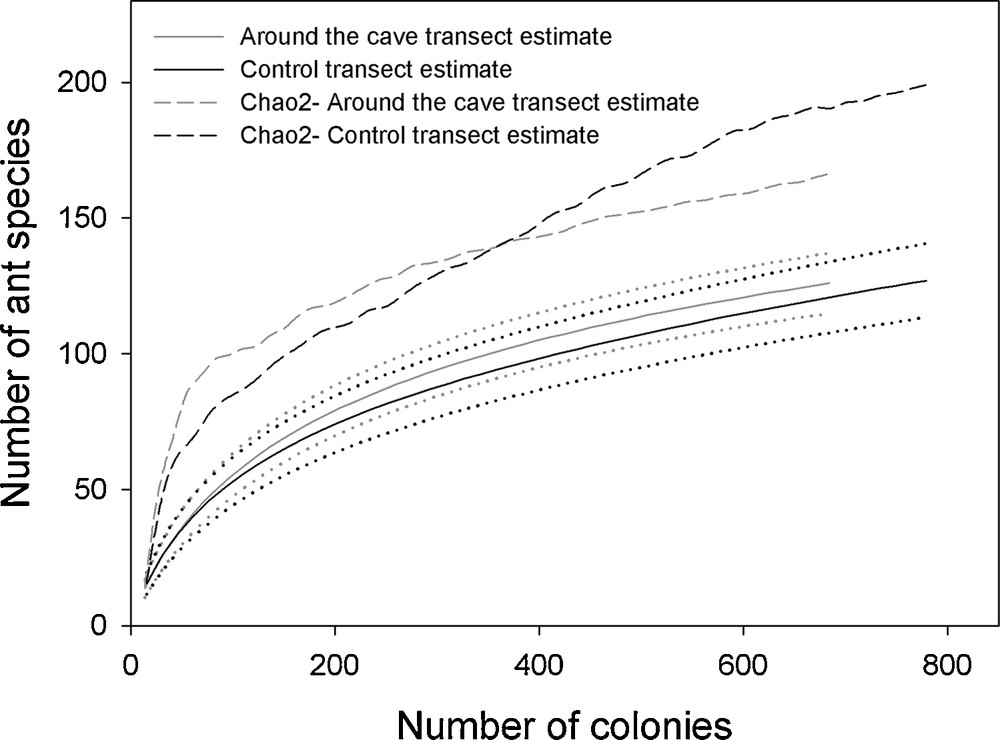
Species accumulation curves assessed using a random methodology (solid lines) and their 95% CI (dotted lines). The estimated asymptotic richness of the assemblage obtained by Chao 2 is shown as dashed lines.
The Chao 2 estimator confirmed that 85.15% of the leaf-litter myrmecofauna was inventoried (Chao 2 = 202 ± 9 species for the 172 species recorded in the two transects), but it did not reach a plateau, particularly for the control transect (Fig. 1), showing that a greater sampling effort would have been more informative. Yet, the accumulation species curves for each habitat sampled began to approach the asymptote corresponding to the total number of species in the community (Fig. 1).
There were differences between the ant functional groups. The proximity of the cave, through the greater amounts of bat guano, significantly enhanced the frequency of detritivorous fungus-growing and predatory ant species compared to the control transect, while the contrary was true for nectar and honeydew feeders. The differences were not significant for generalist species (Fig. 2; Appendix S2, supplementary material).
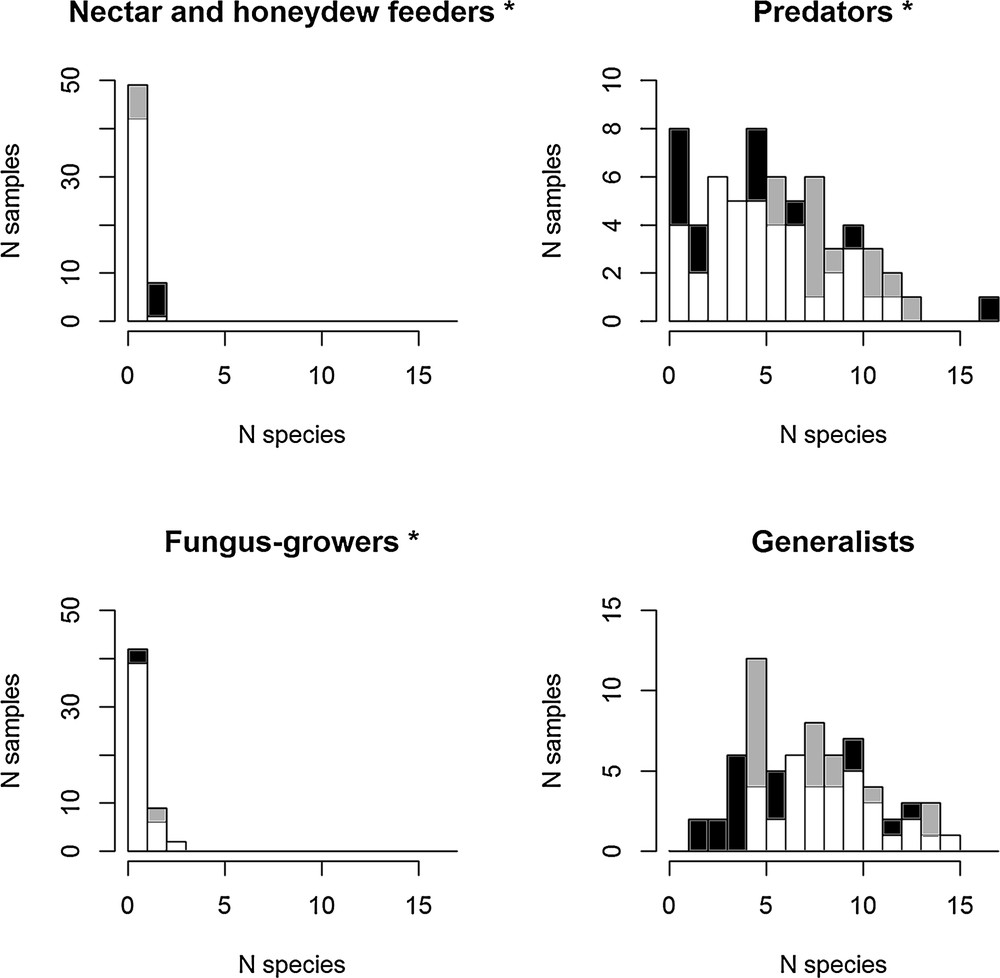
Multiple histograms of species richness per functional group near the cave (grey), far from the cave (black) and overlaps in distribution (white). A generalized linear model with a Poisson error distribution was used to test differences in species richness distribution near and far from the cave. Predators and fungus-growers had significantly more species per transect near the cave. Each histogram bar corresponds to the frequency of the cases with, for example, one, two or three ant species recorded during the sampling (*P < 0.05). See details of the statistical comparison in Appendix S2.
3.2 Comparisons of δ15N between ants from the cave and a control lot
We noted eight ant species inside the cave where the floor was covered with bat guano, plus five others in the area where the ceiling had collapsed and three others in the immediate proximity of this exposed area (16 species in total). However, as we were unable to find control colonies for Acanthostichus kirbyi and Pachycondyla impressa, the stable isotope comparisons were made only between individuals from the 14 remaining species (Table 1).
Comparisons of the δ15N from 14 ant species recorded in the cave, in its exposed area plus its immediate surroundings and their counterparts captured 0.5–1.0 km away constituting a control lot. We did not find control colonies for the Dorylinae Acanthostichus kirbyi and the Ponerinae Pachycondyla impressa found inside the cave.
| Feeding habits | Subfamily | Ant species | Control δ15 N | Cave δ15 N |
| Inside the cave | ||||
| Predator | Ponerinae | Mayaponera constricta | 8.70 | 12.98 |
| Predator | Ponerinae | Pseudoponera gilberti | 8.69 | 9.78 |
| Generalist | Formicinae | Nylanderia sp.1 | 6.91 | 8.15 |
| Generalist | Myrmicinae | Solenopsis sp.1 | 6.65 | 8.35 |
| Fungus-grower | Myrmicinae | Apterostigma sp.3c | 6.41 | 7.19 |
| Fungus-grower | Myrmicinae | Apterostigma auriculatum | 3.91 | 6.03 |
| Fresh guano (under sites where bats congregate)b | 3.52 | |||
| Older guano | 9.29 | |||
| Leaf litter (control 1) | 0.93 | |||
| Leaf litter (control 2) | 1.44 | |||
| Exposed zone of the cavedand the surrounding 4 m | ||||
| Leaf litter impregnated with bat guano | 4.76 | |||
| Predator | Ponerinae | Odontomachus haematodus a | 7.80 | 9.72 |
| Predator | Ponerinae | Anochetus horridus | 6.23 | 8.29 |
| Generalist | Myrmicinae | Pheidole susannae a | 5.72 | 6.98 |
| Generalist | Myrmicinae | Crematogaster carinata a | 4.89 | 5.59 |
| Mostly nectar | Paraponerinae | Paraponera clavata a | 3.52 | 6.73 |
| Nectar and prey | Formicinae | Gigantiops destructor a | 3.89 | 5.19 |
| Nectar and pollen | Myrmicinae | Cephalotes atratus a | 4.11 | 5.11 |
| Plant-ant | Pseudomyrmecinae | Pseudomyrmex penetrator | 2.14 | 5.20 |
a Also forage on trees.
b Guano taken from the sides of the circular areas formed by feces and urine frequently falling under recesses in the ceiling of the cave where bats congregate.
c Apterostigma sp.3 complex pilosum.
d Zone whose ceiling collapsed.
The δ15N values were greater for all of the ant species sampled in the cave and its surroundings, compared to their homologues from the control lot, the statistical comparison resulting in a significant difference (P = 0.0001) (Table 1).
4 Discussion
4.1 Ants inside the cave
Ant nesting and/or foraging in caves has frequently been reported [51–56]; certain species even gather bat guano [57]. The particularity of the cave studied is the important presence of detritivorous fungus-growing ants of the genus Apterostigma (Appendix S1). Note that these ants were not recorded in any of the 27 caves studied in Maranhão and Tocatins, Brazil [56], although they were noted in the surroundings.
4.2 Impact of bat guano on ant communities
That the high amounts of bat guano did not impact ant species richness is likely due to the high ant diversity in both the cave area and the control area (127 and 126 ant species, respectively; a total of 172 species for 100 Winkler samples; non-significant differences between different diversity indices; Fig. 1). Indeed, these values are comparable to the 140 and 102 ant species recorded in a liana forest and a plateau forest, respectively, ca. 90 km west of Kaw Mountain (Nouragues field station) with a greater sampling effort (i.e., the use of pitfall traps in addition to Winkler samples) [58].
From a functional point of view, a trophic web includes a ‘horizontal component’ corresponding to each trophic level characterized by a given number of species, and a ‘vertical component’ corresponding to the number of trophic levels (i.e. trophic chain length). These components have also been defined as horizontal and vertical diversity [59]. Horizontally, we indeed noted a larger number (i.e. a proxy of ant colonies) of detritivorous fungus-growing and predatory ants in the presence of bat guano around the cave compared to the control transect (Fig. 2). That bat guano favored detritivorous fungus-growing ants is not surprising as they are known to grow their fungi on manure composed of plant detritus and feces [60–62]. Vertically, although omnivory (i.e. feeding on more than one trophic level) can blur the boundaries between trophic levels [59], the trophic chain length was likely modified by the presence of bat guano (the δ15N value was higher at each trophic level; Table 1). Guano-derived nutrients entered the arthropod food web at the first trophic levels, favoring detritivorous arthropods (like for the fungus-growing ants above), themselves being a part of generalist predators’ diets. The higher number of predatory ant colonies noted in these guano-rich areas, compared to the control transect (Fig. 2), mirrors the greater number of guano-feeding taxa and individuals among these taxa. Furthermore, superpredators such as Discothyrea spp. (which prey on spider eggs), Acanthostichus spp. (which are ant predators, themselves at least partially predatory [63]), and Tatuidris tatusia (whose prey is still unknown but whose top predator status was shown using δ15N [64]), were mostly or only noted in the guano-rich areas (Appendix S1).
4.3 Impact of bat guano on δ15N in ant tissues
The overall significantly higher δ15N values in the tissues of ants from the cave and surroundings compared to the control ants show that the guano-derived nitrogen was integrated into the entire trophic chain regardless of the ant functional group (i.e. herbivore, detritivore, generalist or predator; Table 1). Note that the trophic chain in the cave is likely based on what we called “fresh” guano (δ15N = 3.52‰) because “older” guano has higher δ15N values than those found in fungus-growing ants (δ15N = 9.29‰ vs. 6.03‰ and 7.19‰; Table 1). These differences in bat guano δ15N values can be compared to the diverse values noted between caves sheltering bats with different feeding habits: 5.2‰–20.9‰ for the insectivorous bat, P. parnelli (the most frequent in the cave studied); 3.8‰–7.0‰ for the frugivorous bat, Artibeus jamaicensis [65]; 23‰ on average for the hematophagous, vampire bat, Desmodus rotundus [15]. These results are consistent with those obtained from hollow, Neotropical trees that serve as bat roosts whose seeds were enriched in 15N compared to control trees without bats, this is particularly true when the trees serve as roosts for vampire bats [66].
Because the ant species studied have diets of multiple origins, we noted a δ15N shift of ca. 3.0‰ between functional groups only if we considered certain generalist and nectar feeders versus predator species (see also the progressive differences in δ15N between nectar-feeders and specialized predators in Bornean rainforest ants [67]). For the plant-ant P. penetrator, whose individuals feed only on products from their specific host myrmecophyte [46], we also noted higher δ15N values for individuals from the surroundings of the cave compared to the control lot. This shows that 15N from bat guano is passed on through this host plant, a primary producer (see also [66]).
In conclusion, we have shown that large, perennial bat roosting sites affect the functional diversity of ant assemblages through the large accumulation of guano that forms biogeochemical hotspots. Guano-derived nitrogen had bottom-up effects on arthropod communities in that it primarily fostered non-predatory insects, while an analysis of δ15N levels in predator tissues revealed the flow of nutrients to the top of the food chain. The ant model, with 15N enrichment regardless of their functional group, suggests that the phenomenon extends to higher trophic levels involving birds and small mammals.
Disclosure of interest
The authors declare that they have no conflicts of interest concerning this article.
Acknowledgements
We are grateful to Andrea Yockey-Dejean for proofreading the manuscript, Frédéric Azémar, Sardadebie Loza, Lucie Toussaint for technical help, and the “Laboratoire environnement de Petit-Saut” for furnishing logistical assistance. Financial support for this study was partially provided by an “Investissement d’avenir” grant managed by the French “Agence nationale de la recherche” (CEBA, ref. ANR-10-LABX-0025). JHCD acknowledges his research grant from CNPq.