

1 Introduction
Delimitation and identification of coral species is rendered difficult by intra- and interpopulational morphological variations that are often similar in range to, or even greater than, differences between currently recognized species [1]. Indeed, coral colonies are known to display phenotypic plasticity in response to “light, sedimentation, current and water agitation, temperature, depth, salinity, emersion, physical damage, predation, intra- and interspecific competition, association with other organisms, disease, substrate topography” [2], and even gravity [3]. Moreover, crossings between morphologically different corals currently considered as distinct species have been demonstrated to bring out intermediate morphologies that add to the general confusion [4].
Since it is not subject to ecophenotypic variation, the DNA of an organism is commonly used as a source of information to tell intraspecific genetic diversity and phenotypic plasticity from interspecific differences. DNA sequence markers are well suited for this purpose as they generally cross-amplify over a wide range of species, genera and families: the mitochondrial cox1 gene, in particular, can be amplified consistently from most living creatures by using universal primers [5] and has been proposed as a reference marker for the ‘barcoding of life’ [6]. The nuclear, ribosomal internal transcribed spacers (ITS) are also widely used [7]: their presence in several hundred copies per genome makes them easy to amplify, whereas concerted evolution [8,9] usually results in the presence of a single dominant ITS type per individual, with little intraspecific variation [10]. More recently, exon-primed, intron-crossing (EPIC) PCR amplification of gene introns [11–13] was proposed as a way to assess variation at several independent nuclear loci.
Coral biodiversity, however, has proved difficult to study using molecular sequence markers. Cnidarian mitochondrial DNA seems to evolve very slowly [14,15], and cox1 sequences typically display little to no variability among congeneric corals [16,17], whereas in Acropora the presence of silenced, mutation-prone ITS pseudogenes [18] as well as of ancestrally shared lineages [19] has cast doubt on the utility of ribosomal DNA for coral species delimitation. As for EPIC-PCR, its application to corals has been limited until now to Acropora [4,20,21] and Montipora [22] and has yet to provide the basis for a taxonomic revision of these genera.
In the discussion surrounding scleractinian coral species delimitation, corals of the genus Pocillopora are of special interest due to their spectacular, supposedly intraspecific morphological variations [23]. Species boundaries in this group are poorly understood, and the resulting taxonomic uncertainties undermine the numerous physiological and ecological studies conducted on these keystone organisms. Previous attempts to develop variable molecular sequence markers in this group have been largely unsuccessful [16,24,25], except for the second internal transcribed spacer (ITS2) [26,27]. The present article reports the development of five other variable sequence markers in Pocillopora: two regions identified as the most variable in the mitochondrial genome of Pocillopora (the putative D-loop and an open reading frame of unknown function) [28], and three nuclear EPIC markers (an intron of calmodulin, an intron of elongation factor-1α and an intron of the nuclear gene encoding the β subunit of the mitochondrial ATP synthase). All six markers (including ITS2) were then tested on a set of Hawaiian coral samples attributed to five different morphospecies in order to assess their utilities and draw guidelines for future studies.
2 Materials and methods
Thirty-seven small coral fragments were sampled at Kaneohe Bay, Kahe Point, and Moku Manu in Oahu from colonies identified as Pocillopora damicornis Linnaeus 1758, Pocillopora eydouxi Milne Edwards and Haime 1860, Pocillopora ligulata Dana 1846, Pocillopora meandrina Dana 1846 and Pocillopora molokensis Vaughan 1907 by the first author based on their morphology (Table 1). In Hawaii, unlike other Indo-Pacific localities, visual identification of Pocillopora morphospecies poses little difficulty, and individuals of dubious or intermediary morphologies are rarely observed. To avoid mistaking small P. eydouxi colonies for P. meandrina, only large colonies of P. eydouxi were sampled. Genomic DNA was purified directly from fresh samples using the Wizard Genomic DNA Extraction kit (Promega).
List of samples showing morphology, sampling location and number of haplotypes for each marker
| Sample | Morphotype | Location | Number of haplotypes | |||||
| ORF | CR | ITS2 | Calm | EF-1α | ATPSβ | |||
| 1 | P. damicornis | KB | 1 | 1 | 1 | 2 | 2 | 1 |
| 2 | – | – | 1 | 1 | 1 | 2 | 2 | 2 |
| 3 | – | – | 1 | 1 | 2 | 4 | 3 | 3 |
| 4 | – | – | 1 | 1 | 1 | 4 | 2 | 3 |
| 5 | – | – | 1 | 1 | 2 | 3 | 2 | 3 |
| 6 | – | – | 1 | 1 | 3 | 2 | 2 | 2 |
| 7 | – | – | 1 | 1 | 2 | 3 | 5 | 2 |
| 8 | – | – | 1 | 1 | 2 | 2 | 1 | 2 |
| 9 | – | – | 1 | 1 | 1 | 2 | 2 | 1 |
| 10 | – | – | 1 | 1 | 1 | 2 | 2 | 2 |
| 11 | – | – | 1 | 1 | 2 | 2 | 2 | 1 |
| 12 | – | – | 1 | 1 | 2 | 2 | 1 | 2 |
| 13 | – | – | 1 | 1 | 2 | 3 | 2 | 2 |
| 14 | – | – | 1 | 1 | 2 | 2 | 2 | 1 |
| 15 | – | – | 1 | 1 | 2 | 2 | 2 | 2 |
| 16 | – | – | 1 | 1 | 1 | 2 | 1 | 2 |
| 17 | P. meandrina | – | 1 | 1 | 2 | 2 | 1 | 2 |
| 18 | – | – | 1 | 1 | 2 | 2 | 2 | 2 |
| 19 | – | – | 1 | 1 | 2 | 2 | 3 | 2 |
| 20 | – | – | 1 | 1 | 2 | 2 | 3 | 2 |
| 21 | – | – | 1 | 1 | 2 | 2 | 3 | 2 |
| 22 | – | – | 1 | 1 | 2 | 2 | 2 | 2 |
| 23 | – | – | 1 | 1 | 2 | 1 | 2 | 2 |
| 24 | P. ligulata | – | 1 | 1 | 2 | 2 | 2 | 2 |
| 25 | – | – | 1 | 1 | 2 | 1 | 2 | 1 |
| 26 | – | – | 1 | 1 | 2 | 1 | 2 | 1 |
| 27 | – | – | 1 | 1 | 1 | 1 | 2 | 1 |
| 28 | – | – | 1 | 1 | 2 | 2 | 2 | 2 |
| 29 | – | – | 1 | 1 | 2 | 1 | 2 | 2 |
| 30 | P. eydouxi | KP | 1 | 1 | 2 | 2 | 1 | 2 |
| 31 | – | – | 1 | 1 | 2 | 2 | 1 | 1 |
| 32 | – | – | 1 | 1 | 2 | 2 | 1 | 1 |
| 33 | P. molokensis | MM | 1 | 1 | 2 | 2 | 1 | 2 |
| 34 | – | – | 1 | 1 | 1 | 2 | 1 | 2 |
| 35 | – | – | 1 | 1 | 2 | 2 | 2 | 1 |
| 36 | – | – | 1 | 1 | 2 | 2 | 2 | 2 |
| 37 | – | – | 1 | 1 | 2 | 2 | 4 | 2 |
As these coral DNA extracts also contained DNA from zooxanthellae and possibly bacteria, coral-specific primers (Table 2) were defined with the help of Primer3 [29] based on alignments of coral, human, bacterial and dinoflagellate sequences (whenever available) obtained from GenBank. Each marker was amplified in 25-μl reaction mixes containing 20 μl H2O, 2.5 μl Red Taq buffer (Sigma), 1 μl dNTP mix (6.6 mmol l−1 total), 1.3 μl DMSO, 0.3 μl primers (25 μmol l−1), 0.3 μl Red Taq (Sigma) and 0.5 μl undiluted DNA extract (containing about 15 ng of total DNA). PCR conditions comprised an initial denaturation step of 60 s at 94 °C, followed by 40 cycles (30 s denaturation at 94 °C, 30 s annealing at 53 °C, 75 s elongation at 72 °C) and a final 5-min elongation step at 72 °C. PCR products were cleaned using a mix of exonuclease I and shrimp alkaline phosphatase and sequenced in both directions with the same primers as for amplification. Sequences were assembled and cleaned using Sequencher 4 (Gene Codes).
List of primers used for PCR amplification
| Marker | Primer name | Primer sequence |
| ORF | FATP6.1 | 5′-TTTGGGSATTCGTTTAGCAG-3′ |
| RORF | 5′-SCCAATATGTTAAACASCATGTCA-3′ | |
| CR | FNAD5.2deg | 5′-GCCYAGRGGTGTTGTTCAAT-3′ |
| RCOI3 | 5′-CGCAGAAAGCTCCAATCGTA-3′ | |
| ITS2 | ITSc2-5 | 5′-AGCCAGCTGCGATAAGTAGTG–3′ |
| R28S1 | 5′-GCTGCAATCCCAAACAACCC-3′ | |
| Calm | FCalmPoc | 5′-TGAGGTTGATGCTGATGGTATG-3′ |
| RCalmInt | 5′-GAAATCAATTGTTCCATTACCTG-3′ | |
| EF-1α | FefIntr2 | 5′-TTACCGGTACTTCACAGTTAAGAC-3′ |
| RefPoc1 | 5′-TCACCAGTACCAGCAGCAAC-3′ | |
| ATPSβ | ATPSβf2 | 5′- TGAAAGACAAGAGCTCCAAGGTA-3′ |
| ATPSβr2 | 5′- GGTTCGTTCATCTGACCATACAC-3′ |
PCR amplification products obtained from nuclear markers frequently contained more than a single sequence type (Table 1). Mixed sequences were disentangled by direct phase extraction [30] with the help of Champuru v1.0 [31], (available online at http://134.157.186.185/champuru) when they differed in length, by interindividual comparison [32] when they had identical lengths, and by resequencing using haplotype-specific internal primers [33,34] whenever the two previous methods yielded ambiguous or uncertain results.
All sequences obtained in this study were deposited in GenBank (accession numbers EU374225–EU374581). For each marker, sequences were imported into MEGA3 [35] and aligned by eye without difficulty. Sequences alignments were converted into the Roehl format using DnaSP [36], and haplotype networks were constructed using the median-joining algorithm [37] implemented in Network 4.1 (available online at http://www.fluxus-engineering.com/).
For mitochondrial DNA, clusters of haplotypes were delimited somewhat arbitrarily by grouping together haplotypes separated by a single mutation step. A different method was used for the nuclear markers: in order to detect clusters of haplotypes corresponding to clusters of individuals, connections between haplotypes found co-occurring in a coral colony were added as curves on the median-joining networks. This is analogous to the proposal by Doyle [38] to consider a group of individuals sharing a common pool of alleles as a ‘field for recombination’ [39] (FFR), i.e., a species-level population unit; with the difference that, in the present case, not all co-occurring haplotypes of a given marker may have the potential to recombine, since it is unclear whether they are orthologous or paralogous sequences (which is also the reason why we call them haplotypes, and not alleles). In the graphical representation introduced here, clusters of haplotypes that correspond to clusters of individuals stand out as having a single connection to the rest of the network: each such cluster of individuals comprises one or several FFRs, but FFRs can be found that are not part of any cluster (see figures).
3 Results and discussion
3.1 Mitochondrial markers yield clusters of individuals that are compatible with morphology
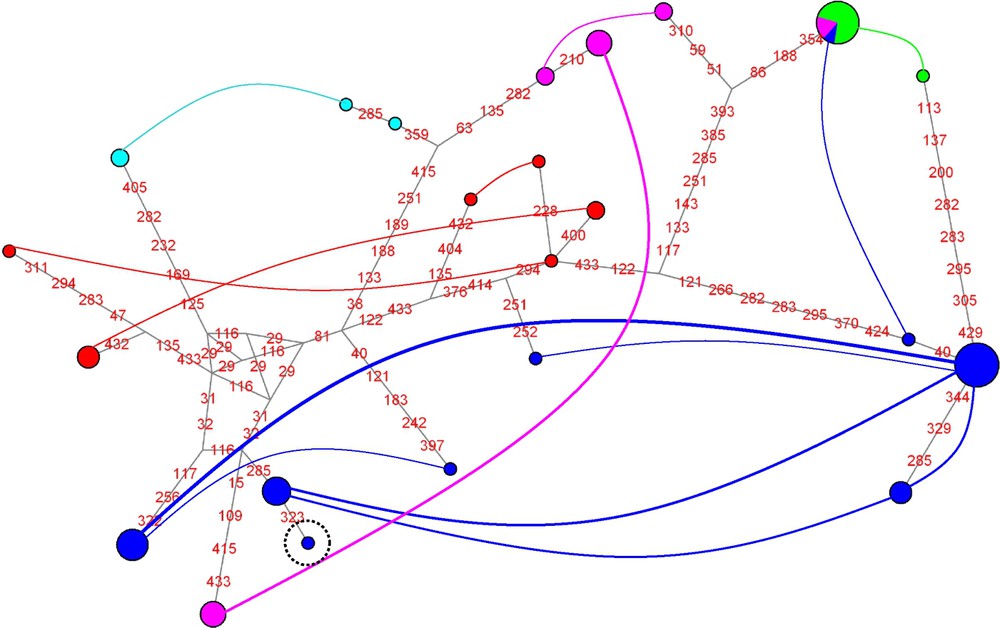
As expected for mitochondrial markers in the absence of recombination, haplotype networks obtained for the open reading frame and for the putative control region are congruent and only the network resulting from the concatenation of both markers is presented here (Fig. 1). A total of seven haplotypes are detected: a single haplotype specific of P. molokensis, two closely related haplotypes (separated by a single mutation) specific of P. ligulata, two closely related haplotypes (separated by a single mutation) for corals of the P. eydouxi and P. meandrina morphotypes and two not-so-closely related haplotypes (separated by 8 mutations) for corals of the P. damicornis morphotype.

Median-joining network of mitochondrial haplotypes. Coloured circles represent haplotypes and their area is proportional to the number of times a given haplotype was sampled. Colours within the circles indicate the morphotypes of the individuals in which each haplotype was detected (dark blue: P. damicornis; pink: P. meandrina; green: P. ligulata; pale blue: P. eydouxi; red: P. molokensis). Mutations are shown in red on the branches (numbers refer to positions in the alignments), and haplotype clusters are enclosed in dashed circles.
P. molokensis and P. ligulata corals fall in two distinct clusters, whereas a single cluster comprises all individuals of the P. meandrina and P. eydouxi morphotypes. Small colonies of P. meandrina and P. eydouxi can be difficult to distinguish in the field: our mitochondrial data suggest that these two morphotypes are either a single species or two closely related ones. Regarding P. damicornis, two morphological variants have been described in Hawaii with slight differences in growth form, pigmentation and reproductive timing, suggesting that they may be sympatric cryptic species [40], which could explain our observation of two divergent mitochondrial lineages; in the present study, unfortunately, morphological details of the corals sampled were not recorded, so this hypothesis cannot be tested here.
3.2 For all nuclear markers, more than two haplotypes are detected in some individuals
Up to three haplotypes per coral colony are detected for ITS2 and the ATP synthase β subunit, up to four for calmodulin, and up to five for elongation factor-1α (Table 1). As haplotypes have variable lengths, the number of end peaks of a chromatogram can be used as a minimal estimate of the number of haplotypes (Fig. 2); obtaining the sequence of each haplotype, however, is the only way to determine this number, since haplotypes of identical lengths have their end peaks superimposed [30].
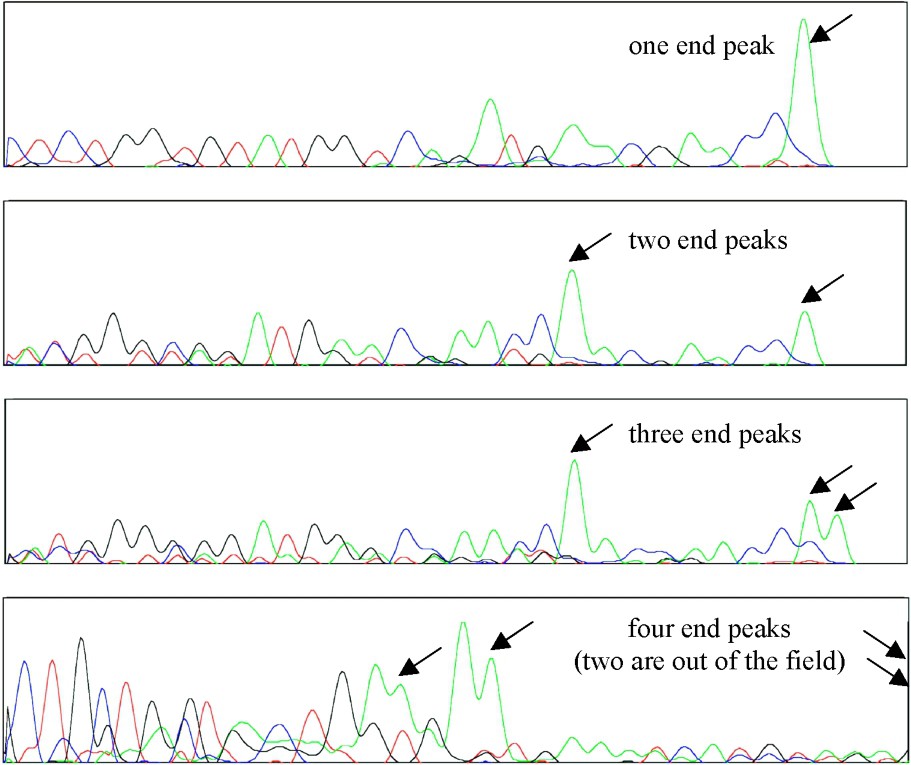
Examples of traces showing variation in the number of end peaks due to different numbers of haplotypes per individual. From top to bottom: ATP synthase, sample 9; ATP synthase, sample 2; ATP synthase, sample 4; calmodulin, sample 37. All ATP synthase haplotypes end with a C (a A overhang is added by the polymerase during the PCR process), whereas calmodulin haplotypes end with a A that appears artefactually larger than the actual end peak.
The occurrence of several dominant ITS types per individual is well documented in various organisms, such as oaks [41] and corals [19], and can be explained by a failure or delay in homogenization among the several hundred copies of ribosomal DNA present in a typical genome [8,9,42]. In the case of nuclear introns, however, the finding of more than two sequences per individual comes unexpected, even though similar observations have been previously reported in periwinkles for calmodulin [43] and in Penaeus shrimps for elongation factor-1α [44]. Presence of more than two gene copies in some individuals could result from gene duplication, but this explanation seems unlikely for the ATP synthase β subunit marker, since it was short-listed as “likely not to be member of a multigene family” by Jarman et al. [13] based on examination of the complete genomes of Homo, Caenorhabditis, and Drosophila. Moreover, our primers were designed overlapping the exon-intron boundaries for enhanced specificity and should have discriminated between paralogous gene copies, except if duplication happened recently or if concerted evolution limits divergence [45].
Other mechanisms may be responsible for the increased numbers of haplotypes observed in our study: there is no karyotypic information available for Pocillopora, but variations in chromosome numbers have been reported for corals of the genus Acropora [46,47], and a study of microsatellite inheritance using controlled crosses in Acropora palmata yielded triploid larvae possessing one paternal and two maternal alleles [48]. Chimeric colonies resulting from the fusion of two or more genetically distinct organisms have also been reported in corals of the genus Pocillopora [49,50], which may explain the high numbers of haplotypes per colony observed here. Finally, intraspecific variations in gene copy numbers have recently been discovered in humans [51,52] and other mammals (reviewed in [53]), but it is not yet known whether such phenomenon occurs in non-mammalian organisms. In any case, our observation of more than two sequences per individual for each nuclear sequence marker investigated contrasts strongly with the results of previous studies using microsatellites in Pocillopora [54–56] that never reported the occurrence of more than two alleles in any single individual: further studies will be required to determine the reason for this discrepancy.
3.3 Nuclear sequence markers yield clusters of individuals that are also compatible with morphology
For ITS2 (Fig. 3), two clusters are detected that comprise more than a single individual: one includes all individuals of the P. ligulata morphotype, and the other all individuals of the P. eydouxi morphotype. In addition, two clusters of a single individual are detected, each of them of the P. damicornis morphotype. For calmodulin (Fig. 4), a single cluster of individuals is detected that comprises three samples of the P. meandrina morphotype. For elongation factor-1α (Fig. 5), two clusters stand out, each of them made of a single P. eydouxi individual, whereas for the ATP synthase β subunit (Fig. 6), only one cluster of one P. damicornis coral sample is detected.
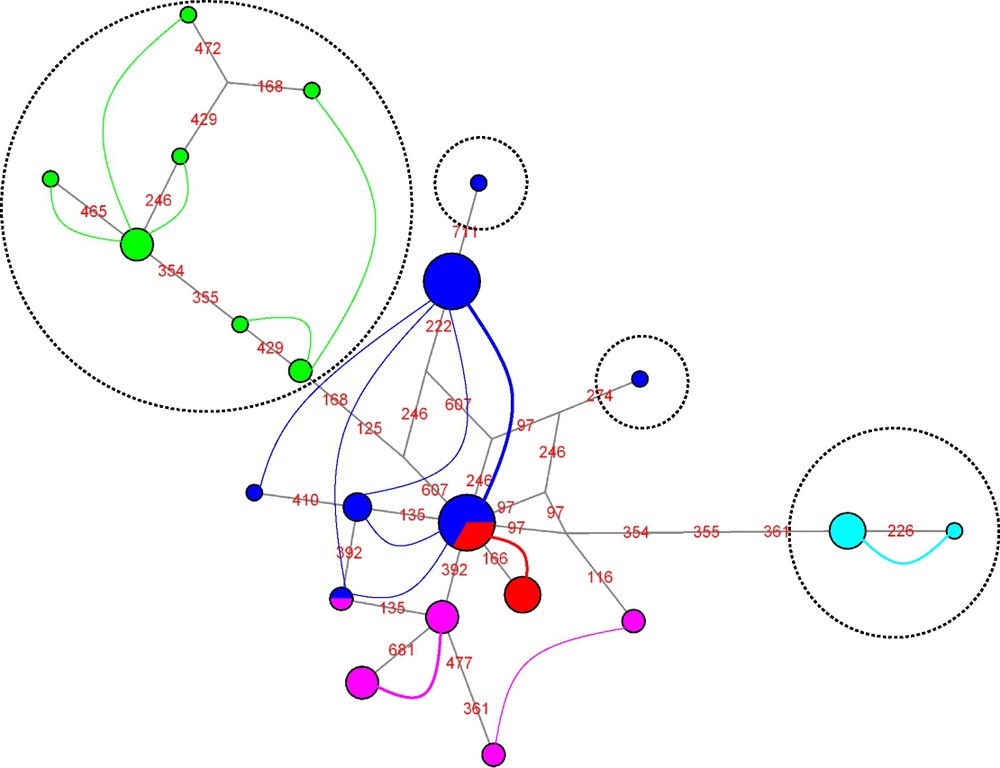
Network of ITS2 haplotypes. Coloured curves connect haplotypes that co-occur in at least one individual, and their width is drawn proportional to the number of individuals in which the two haplotypes co-occur. Mutations are shown in red on the branches (numbers refer to positions in the alignments). The colour code for the curves is the same as for the haplotypes (dark blue: P. damicornis; pink: P. meandrina; green: P. ligulata; pale blue: P. eydouxi; red: P. molokensis). Clusters of haplotypes that correspond to clusters of individuals are enclosed in dashed circle: for instance, all P. ligulata haplotypes fall into one such cluster, and each of the two pools of co-occurring haplotypes observed within this cluster corresponds to a distinct potential field for recombination (FFR). The P. eydouxi cluster on the right side of the network comprises a single pool of co-occurring haplotypes; hence, in our dataset all individuals of the P. eydouxi morphotype are part of a single FFR.
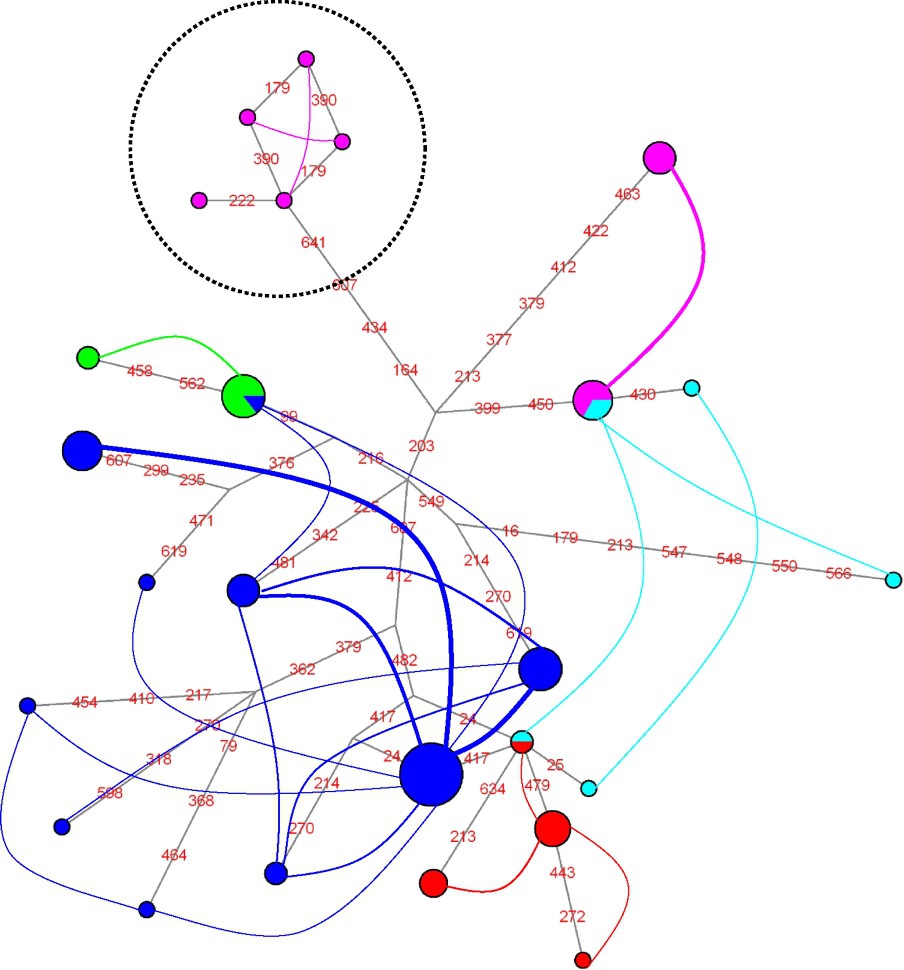
Network of calmodulin haplotypes (dark blue: P. damicornis; pink: P. meandrina; green: P. ligulata; pale blue: P. eydouxi; red: P. molokensis).
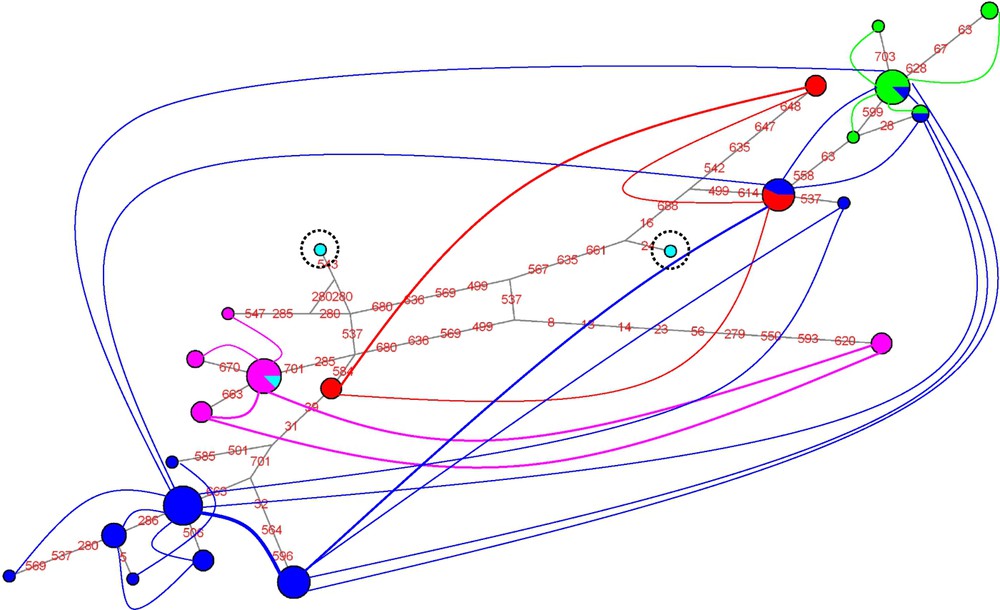
Network of elongation factor-1α haplotypes (dark blue: P. damicornis; pink: P. meandrina; green: P. ligulata; pale blue: P. eydouxi; red: P. molokensis).
Network of ATP synthase β subunit haplotypes (dark blue: P. damicornis; pink: P. meandrina; green: P. ligulata; pale blue: P. eydouxi; red: P. molokensis).
None of these clusters comprises colonies of different morphotypes; hence, our nuclear datasets do not contradict previous morphological hypotheses, but do not support many of them either. Despite their higher variability in terms of haplotype numbers and of differences between haplotypes, nuclear markers turn out to be less informative than mitochondrial ones for delimiting clusters of individuals. The same apparent paradox is observed when comparing ITS2 and the other nuclear markers: haplotypes are fewer and less divergent for ITS2 than for calmodulin, elongation factor-1α and the ATP synthase β subunit, but nevertheless ITS2 seems to yield more clusters of individuals.
Two main hypotheses can be proposed to explain why fewer clusters of individuals are detected by using nuclear markers than by looking at mitochondrial DNA. First, it might be that individuals belonging to different mitochondrial clusters are exchanging genes through sexual reproduction; however, in that case, it would be difficult to explain why clusters of mitochondrial and nuclear haplotypes are compatible with morphology, unless some strong environmental selection is acting concomitantly on both genomes. Such selection may explain part of the molecular differences observed between P. damicornis and P. eydouxi, two morphotypes found in contrasting reef environments in Hawaii (calm shallow waters for P. damicornis, deeper exposed locations for P. eydouxi) but not between P. ligulata and P. meandrina that are usually found interspersed among each other on shallow reef parts exposed to wave action.
Alternatively, second, the different mitochondrial clusters may correspond to reproductively isolated sympatric populations (i.e., biological species), in which case incomplete lineage sorting and retention of a shared ancestral polymorphism could explain why these species cannot be distinguished using nuclear intron sequences. A prediction from this second hypothesis would be that, among nuclear markers, those with shorter coalescence time due to concerted evolution, such as ITS2, should yield clearer patterns than other genes; and this is precisely what is observed here.
4 Conclusions
Our results show that mitochondrial data obtained by sequencing the putative control region and the recently described open reading frame can be useful for resolving interpopulational relationships among pocilloporid corals. On the other hand, nuclear markers in Pocillopora are plagued with high numbers of haplotypes in some individuals that make sequencing cumbersome and costly; moreover, these markers turn out not to be very informative in terms of clusters of individuals. Among nuclear markers, ITS2 provides a slightly clearer picture than nuclear gene introns, but apparently does not resolve all potential interspecific relationships, i.e. does not allow identification of the more restricted clusters delineated by mitochondrial and morphological data. Had our nuclear markers displayed only one or two haplotypes per individual as expected, we could have tried to sort individuals into clusters by using population genetic models that are not hindered by shared ancestral haplotypes [57]. However, since orthology/paralogy relationships among our sequences are unclear, the actual number of copies of each marker remains unknown, and a population genetic analysis of our data is impossible.
The data presented here bring partial support to the morphological delimitation of species in Hawaiian corals of the genus Pocillopora. ITS2 and mitochondrial data concur with the delimitation of P. ligulata as a distinct populational unit of possible species level, whereas mitochondrial data also strongly support the distinctiveness of P. molokensis: these results may have significant implications regarding conservation, since these two morphospecies are listed as putative Hawaiian endemics [58]. However, and with regard to the high level of intra- and interpopulational variation, determining whether these Hawaiian morphological and genetic clusters may belong to more widespread genetic clusters will require further investigation. It is also unclear whether the two mitochondrial lineages identified among corals of the P. damicornis morphotype are two cryptic species or just an instance of intraspecific variation similar to the one previously reported for corals of the genus Montastrea [17]. Moreover, further research will be needed to clarify the status of the P. meandrina and P. eydouxi morphotypes that could only be distinguished using ITS2, not using mitochondrial markers: given our small sample size for P. eydouxi, the hypothesis that these two morphotypes may be growth forms of a single species cannot be rejected. Hence, this report is a first step toward a molecular reassessment of species boundaries in the coral genus Pocillopora, but examination of a larger number of specimens collected over the whole area of distribution of this genus will be required before more general conclusions can be reached.
Acknowledgements
Research by J.-F. Flot was supported by a PhD scholarship from the French Ministry of Research and Education and by a research grant from the MNHN program État et structure phylogénétique de la biodiversité actuelle et fossile. Support from the Consortium national de recherche en génomique is acknowledged (agreement No. 2005/67 on the project ‘Macrophylogeny of life’ directed by Guillaume Lecointre). This project benefited greatly from the assistance of Annie Tillier, Josie Lambourdière, and Céline Bonillo at the Service de systématique moléculaire (MNHN CNRS IFR 101). Thanks to Evelyn Cox, Frank Stanton and Daniel Thornhill for helping with sample collection during the 2002 Pauley Summer Program ‘Molecular Biology of Corals’; participation of J.-F. Flot in this program was supported by the E. W. Pauley Foundation. Thanks also to Keoki Stender for providing field information, to Marie-Catherine Boisselier, Magalie Castelin, Julien Lorion, and Nicolas Puillandre for useful discussions, and to Sarah Samadi for critically reading an earlier version of this paper.