

1 Introduction
The benthic marine fauna of the Antarctic is highly endemic and, unlike its northern counterpart [1], is comparable in diversity to many temperate and tropical non-reef benthic communities [2]. Although the Mollusca is generally poorly represented in the Southern Ocean [3], the octopod fauna is both rich and unique: 12 cirrate (Octopoda: Cirrata) and incirrate (Octopoda: Incirrata) genera are currently recognized from the Southern Ocean, of which five are endemic (Adelieledone, Bathypurpurata, Megaleledone, Pareledone, and Praealtus [4]). The most speciose genus, Pareledone, currently contains 14 extant species [4,5] and probably radiated with the development of the Circum Antarctic Current approximately 35 Ma [6]. With several of these species and genera described [5,7–10] and revised [5,11] during the last decades, a large proportion of the Southern Ocean octopod fauna taxonomy is well mapped and up to date. Furthermore, the incorporation of mitochondrial cytochrome oxidase subunit I (COI) sequences in several of these studies, as well as in other higher level phylogenetic studies [12–15], Antarctic octopods are relatively well covered in terms of species sequenced for COI. This mainly applies to the western sector of the Southern Ocean, however, as most of the species described and sequenced have only previously been registered from the Antarctic Peninsula region [4].
A common feature of many studies dealing with the application of DNA barcoding as proposed by Hebert et al. [16] is the difficulty in morphologically distinguishing between species, particularly for non-experts [17,18]. This issue applies to the identification of many of the octopod species registered from Antarctic waters, where diagnostic features at genus and species level includes traits often difficult to classify correctly for the non-expert, such as beak shape, mantle papillae and coloration [8,19]. The morphological plasticity of cephalopods [20] as well as the lack of a dichotomous key including locally sampled specimens also makes the task of identifying East Antarctic specimens to species, or corresponding clades, particularly difficult. Employing DNA barcoding as a means of identifying samples [16,21] may represent a way around these issues in specimen identification. In addition, a molecular approach to sample identification bypasses problems that arise when there is little morphology left to interpret, such as when identifying stomach contents of cephalopod predators or when specimens are heavily damaged by trawls.
There are, however, issues that have been raised regarding the use of DNA barcoding in the identification of cephalopod samples [22]. One of these relates to the method by which the obtained COI sequences are analyzed and specimens identified. Two main approaches to identifying samples to species using DNA barcodes have been put forward; the distance-based Neighbor Joining (NJ) analysis using the Kimura-2-Parameter (K2P) model for nucleotide substitutions [16,23,24] and the character-based method using the freeware Phylogenomenclature (P-Gnome) [25] to identify phylogenetically informative apomorphic sites [26–28]. Both these approaches identify unknown samples in terms of a lack of matching sequences, but while the NJ analysis gives an estimate of the taxonomic status of the unknowns, the character-based method can only list these within the last identified node. However, it has been argued that a character-based approach is less dependent on a “barcoding gap”, a distinct gap between intraspecific variation and interspecific divergence [27], which has been found to be present in some molluscan taxa [29] but not others [30]. A third, less powerful, but faster and more accessible method to identify specimens by DNA barcoding is Basic Local Alignment Search Tool [31]. Employing BLASTN 2.2.22+ [32] to search for the most similar sequence lodged in GenBank (http://www.ncbi.nlm.nih.gov/Genbank/), however, will always give a closest match, and is therefore unable to unequivocally detect new sequences.
During the 2007–2008 Voyage 3 research cruise aboard R/V Aurora Australis, tissue samples were collected from more than 200 specimens of cirrate and incirrate octopods caught by bottom trawl off George V Land. However, due to time constraints and specimen allocation, most of these specimens could not be identified morphologically. Here, we compare four approaches for the identification of these samples to species by means of mtDNA sequencing. In addition to the three methods mentioned above (NJ by K2P-based distances, Character-based, and BLAST), the phylogenetically more powerful analysis of Bayesian Inference of Phylogeny [33,34] is used as a comparison to the more commonly employed methods for grouping barcode sequence data.
2 Methods
2.1 Sample collection
Samples were taken with benthic beam trawls and box corer (one individual) off the coast of George V's Land (139°E to 145°E), Antarctica, during Voyage 3 2007–2008 onboard R/V Aurora Australis. All specimens were photographed, brief morphological observations noted, locality and depth recorded, and a tissue sample taken from the tip of a non-hectocotylized arm. Tissue samples were stored in liquid nitrogen. We deposited specimens with the Collaborative East Antarctic Marine Census (CEAMARC) collection, with each specimen and its tissue sample given a unique CEAMARC reference number (Supplementary table). Tissue samples used for this study are stored in the research collection of B.G. Fry, University of Melbourne, along with a small number of specimens retained for further histological studies (see the Supplementary table).
2.2 DNA extraction, amplification and sequencing
We extracted DNA using the Qiagen® DNeasy extraction kit, following the manufacturer's recommendations. We then modified universal invertebrate COI forward and reverse primers (LCO1490 and HCO2198 respectively) to better fit octopod COI using complete COI sequences from Octopus vulgaris (AB158363) downloaded from Genbank (http://www.ncbi.nlm.nih.gov/sites/entrez) and ordered the following M13-tailed primer sequences primers from geneworks:
- • eCOI-F 5′ CACGACGTTGTAAAACGAC - TCTCAACAAAYCATAAAGAYATTGG
- • eCOI-R 5′ GGATAACAATTTCACACAGG - TATACTTCTGGGTGTCCAAARAAYCA
PCR reaction mixtures contained 1 μL DNA template, 4 μL Go Taq Green Mastermix (Promega), and 0.32 μM forward and reverse primers to a total reaction volume of 10 μL. PCR was conducted using the thermal cycle: 95 °C for 2 min; 40 cycles of 95 °C for 20 s, 58 °C for 20 s, 72 °C for 20 s; and a final extension at 72 °C for 5 min. Gel-electrophoresis using 1.2% agarose gels and subsequent staining with EtBr was used to check the PCR products. We used a molecular weight marker (Hyperladder II, Bioline®) to determine approximate fragment sizes of the respective bands. PCR product purification, DNA sequencing (using M13R or F as sequencing primers) and electrophoretic separation were all performed by the Australian Genomic Research Facility (AGRF). We proofread and aligned sequences by eye using PROcessor of SEQuences (ProSeq) v3 [35] and MEGA v4 [36]. All octopod COI sequences deposited in GenBank were then obtained and included in the dataset, once again aligned by eye using ProSeq3 and MEGA4.
2.3 Variation at COI
We assessed the extent of intra- and interspecific variation in octopod mtCOI from all the 111 previously lodged sequences. Distances were calculated using the Kimura two-parameter (K2P) model for nucleotide substitutions in MEGA4, with a standard error calculated from a bootstrap analysis using 500 replicates. Only interspecific variation between congeners was included in the analysis.
2.4 Identification of samples
2.4.1 K2P distance and Neighbor-Joining
We used MEGA4 to infer a Neighbor-Joining phylogenetic tree for the entire dataset (313 sequences) based on distances calculated assuming a K2P model for nucleotide substitutions. Bootstrap support was estimated using 500 iterations. Values obtained from the analyzes of intra- and interspecific variations were then used to delimit sequences to species clades.
2.4.2 Bayesian inference
We estimated phylogenetic relationships Bayesian analysis using Mr.Bayes v3.1.4 [33,34] with GTR + I + Γ model of nucleotide substitutions (as employed by e.g. [5,37]), and setting Vampyroteuthis infernalis (AF000071) as the outgroup, as studies have shown it is basal to both cirrate and incirrate octopods [15,38]. The analyzes were performed with two parallel independent chains, each with a random tree as starting point and four simultaneous chains, for three million generations and sampled every 100 generations, discarding the first 750 000 generations as burn in. We then put together a second truncated dataset comprising the 202 East Antarctic specimens and representative GenBank sequences contained in the same main clade as the sample sequences. This dataset was rerun with Mr.Bayes v3.1.4, using the same model and settings, except for a chain temperature reduced to 0.1 and the number of generations increased to 6 million which were sampled every 1000 generations, discarding the first 1.5 million generations as burn in. We then compared sequence clusters to the results obtained with K2P distance and NJ.
2.4.3 Online BLAST
We used BLASTnucleotide to find the closest matching sequences lodged in GenBank (http://blast.ncbi.nlm.nih.gov/Blast.cgi). The search was conducted in the nucleotide collection database (nr/nt), optimizing for highly similar sequences (megablast). As well as the accession number and species label, we noted BLAST max and indent scores for the closest matching sequences for each search.
2.4.4 Character-based approach
Application of characteristic attributes organization system (CAOS) [28,39] as a barcode identifier was carried out as described by Rach et al. [27] with some modifications. We constructed a Maximum Likelihood tree from the sequences obtained from GenBank using PhyML [40]. This tree was in concurrence with both earlier phylogenetic studies and results obtained in the two other phylogenetic analyses (NJ and Bayesian Inference). We then imported the tree along with its corresponding NEXUS file was into Mesquite v2.6 [41] and saved these as one file before applying the CAOS algorithm to search for characteristic attributes (CAs) using P-Gnome [25]. As the DIAGVIEWER script [27] failed to identify any apomorphic traits, we used the standard P-Gnome attributes-output for classification of the sample sequences.
2.4.5 Support from catchment data
As specimens were photographed and brief morphological observations noted, these provided information on a few but informative traits commonly used in distinguishing between some species of octopus. We could therefore supplement results from the molecular approaches by comparing observational notes and photographs with species descriptions and dichotomous keys from the literature.
3 Results
3.1 COI variation
Intraspecific variation in an approximately 650 bp region of octopod COI was assessed using published sequences for 54 species in 19 genera. Levels of intraspecific COI divergence were variable, ranging from 0 in Pareledone cornuta and P. felix, to 1.3% in P. turqueti (SE 0.5%), and 2.5% (SE 0.6%) in P. aequipapillae. Removing one of the P. aequipapillae sequences (EF102179), which had a high number of degenerate bases, reduced the maximum intraspecific variation in this species to 0.3% (SE 0.2%). Thaumeledone peninsulae had a maximum pairwise intraspecific distance of 1% (SE 0.4%) while values in Octopus vulgaris ranged from 0 to 1.3% (SE 0.05%). As the number of sequences published for each species was generally low, (one to three sequences per species) and lacked comprehensive geographic coverage, these values may underestimate levels of COI diversity within species. Although Octopus vulgaris first appears as an exception, with 22 sequences available for analysis, these only cover a small section of this species extensive range. Interspecific variation between congeners was in most cases higher than 2% but ranged from 1.0% to 7.7%. In Thaumeledone the mean distance between the two species was 3.5% (SE 0.7%), while within Benthoctopus the mean interspecific distances ranged from 6.7% (SE 1.1%) to 7.7% (SE 1.1%). Within Graneledone, interspecific divergences ranged from a low of 1.3% (SE 0.4%) between G. verrucosa and G. boreopacifica to 3.2% (SE 0.7%) and 3.7% (SE 0.8%) in other comparisons. Similarly, several cases of low interspecific divergence were recorded in Pareledone, although 32 of the 45 possible pairwise species combinations examined revealed distances > 2.4%. Species comparisons showing low interspecific divergences include P. felix and P. serperastrata (1% SE 0.4%), P. serperastrata and P. panchroma (1.9% SE 0.6%), P. serperastrata and P. cornuta (1.6% SE 0.5%), and P. serperastrata and P. aurata (1% SE 0.4%). This means that, at least for the genus Pareledone, no overall “barcode gap” between intra- and interspecific variation is apparent. Species with low intraspecific variation, however, seem to diverge at about 1%, while more variable species at distances above 2.5% although this appearance may be misleading, considering that such few sequences could be examined for each species. Regardless, the distributions of intraspecific variation and interspecific divergence did not uniformly follow the proposed 10× rule [24]. Two different sets of thresholds were therefore used for delimiting species: For most clades a distance of less than 1% was interpreted as a positive identification, although sequences grouping with species showing higher intraspecific variation were considered conspecific if differing by less than 1.3%. This latter value was derived from intraspecific variation found in Pareledone turqueti and Octopus vulgaris.
3.2 Identification of samples
3.2.1 K2P distance and Neighbor-Joining
Results of the NJ analysis using K2P distances are summarized in Fig. 1 along with mean with and between species clade variation summarized in Table 1. 145 of the 202 East Antarctic specimens (71.8%) were found to belong to the genus Pareledone. 61 specimens formed a clade containing P. turqueti sequences, 47 were similarly identified as P. aequipapillae, 14 as P. cornuta, six as P. subtilis, four as P. panchroma, and one as P. aurata. 12 specimens failed to group within clades containing sequences from pre-identified specimens. Specimens grouping with P. turqueti had pairwise distances ranging from 0 to 3% (SE 0.7%) with a mean of 0.8% (SE 0.3%), and the distance from previously identified specimens averaging 1.3% (SE 0.4). While the maximum distance of 3% at first appears too high for inclusion in the P. turqueti species clade, there is no clear cut-off between this sequence (GU073616, clade Ptu 5 in Fig. 1) and the remaining sequences within the P. turqueti clade, with stepwise distances to the template sequences being less than or equal to the calculated intraspecific divergence. The samples forming a clade containing P. aequipapillae, showed intraclade pairwise distances ranging from 0 to 0.6% (SE 0.3) with a mean distance to the lodged sequences of 1.7% (SE 0.6%), and 1% (SE 0.4%) if EF102179 was removed. The clade identified as P. cornuta had a intraclade variation maximum of 0.8% (SE 0.3%) and a mean distance between sample and lodged sequences of 0.4% (SE 0.2%), while the P. panchroma clade showed no variation between the samples and had a distance of 0.6% (SE 0.3%) between samples and previously lodged sequences. The sample identified as P. aurata had distances of 0.9% (SE 0.4%) and 0.6% (SE 0.3%) to the pre-identified sequences, which themselves exhibited a genetic difference of 0.3% (SE 0.2%). The 12 samples that failed to identify to species were divided into three separate clades that had distances of at least 1.1% (SE 0.4%) to the other species clades within Pareledone, which was higher than the minimum interspecific divergences between template sequences in the same main Pareledone clade (containing all but P. turqueti).
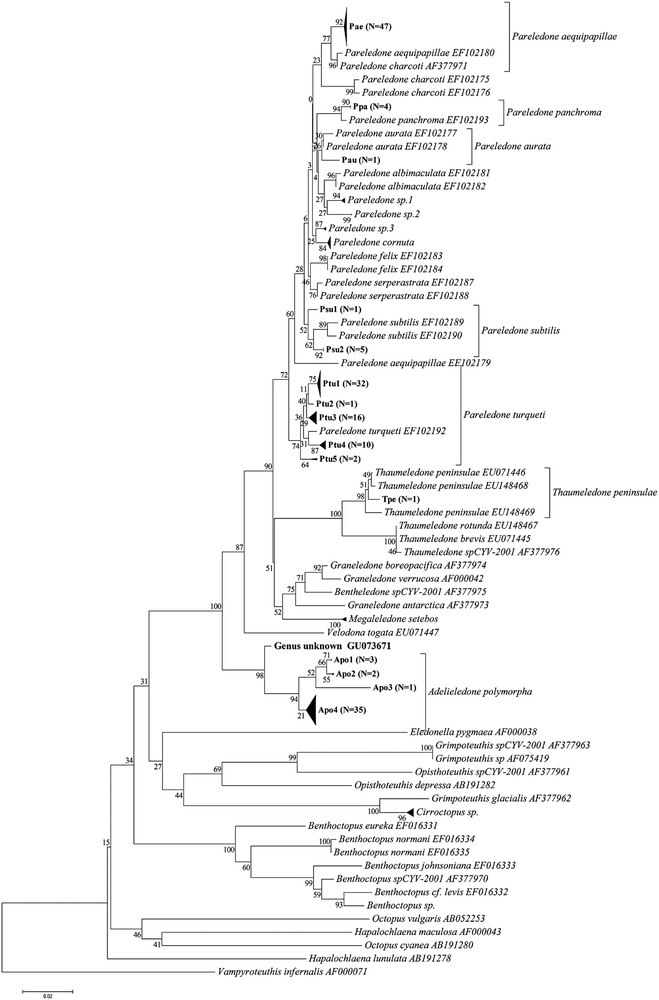
Kimura two-parameter based neighbor joining phylogenetic tree of sample sequences on template sequences obtained from GenBank. Branches with a distance of 0.3 are collapsed, as are polytomies with more than ten branches. Numbers on branches indicate bootstrap support calculated using 500 iterations. Labelling of clades within plausible species clades corresponds to that used in Supplementary table containing sequence accession numbers, CEAMARC voucher numbers and catch data. N indicates the number of sample sequences contained in each collapsed clade.
Between and within Pareledone spp. clade distances as estimated using Kimura's 2 Parameter model for nucleotide substitution rates. Distances are as mean number of substitutions per nucleotide. Values enclosed by square brackets denote Standard Error of distances as estimated by the Bootstrap method using 500 replicates while italicized values denote within species variation.
| Species | P. turqueti | P. aeqipapillae | P. charcoti | P. panchroma | P. aurata | P. albimaculata | P. sp.1 | P. sp.2 | P. sp.3 | P. cornuta | P. felix | P. serperastrata | P. subtilis |
| P. turqueti | 0.008 [0.002] | [0.007] | [0.007] | [0.007] | [0.006] | [0.006] | [0.006] | [0.007] | [0.006] | [0.006] | [0.006] | [0.006] | [0.005] |
| P. aeqipapillae | 0.034 | 0.003 [0.001] | [0.006] | [0.007] | [0.006] | [0.006] | [0.007] | [0.006] | [0.006] | [0.006] | [0.007] | [0.006] | [0.006] |
| P. charcoti | 0.037 | 0.024 | 0.003 [0.002] | [0.006] | [0.005] | [0.006] | [0.005] | [0.005] | [0.005] | [0.005] | [0.006] | [0.005] | [0.006] |
| P. panchroma | 0.033 | 0.029 | 0.026 | 0.002 [0.001] | [0.005] | [0.005] | [0.006] | [0.006] | [0.005] | [0.006] | [0.006] | [0.005] | [0.005] |
| P. aurata | 0.029 | 0.024 | 0.021 | 0.017 | 0.006 [0.003] | [0.004] | [0.004] | [0.004] | [0.004] | [0.004] | [0.004] | [0.004] | [0.004] |
| P. albimaculata | 0.03 | 0.022 | 0.024 | 0.018 | 0.014 | 0.002 [0.002] | [0.003] | [0.005] | [0.004] | [0.004] | [0.006] | [0.005] | [0.005] |
| P. sp.1 | 0.03 | 0.027 | 0.021 | 0.022 | 0.014 | 0.01 | 0.001 [0.001] | [0.005] | [0.004] | [0.004] | [0.006] | [0.005] | [0.005] |
| P. sp.2 | 0.035 | 0.026 | 0.021 | 0.022 | 0.016 | 0.015 | 0.014 | 0.00 [0.00] | [0.004] | [0.005] | [0.006] | [0.005] | [0.006] |
| P. sp.3 | 0.025 | 0.022 | 0.018 | 0.017 | 0.012 | 0.011 | 0.013 | 0.012 | 0.001 [0.001] | [0.003] | [0.005] | [0.005] | [0.005] |
| P. cornuta | 0.028 | 0.025 | 0.017 | 0.02 | 0.012 | 0.015 | 0.013 | 0.016 | 0.009 | 0.002 [0.001] | [0.005] | [0.004] | [0.005] |
| P. felix | 0.029 | 0.029 | 0.026 | 0.023 | 0.013 | 0.022 | 0.022 | 0.024 | 0.018 | 0.017 | 0.00 [0.00] | [0.004] | [0.005] |
| P. serperastrata | 0.027 | 0.025 | 0.022 | 0.018 | 0.011 | 0.018 | 0.018 | 0.02 | 0.014 | 0.013 | 0.009 | 0.002 [0.002] | [0.004] |
| P. subtilis | 0.026 | 0.028 | 0.028 | 0.022 | 0.018 | 0.021 | 0.021 | 0.023 | 0.018 | 0.019 | 0.02 | 0.017 | 0.009 [0.002] |
Forty-one specimens were found to belong to the genus Adelieledone. NJ phylogenetic analysis suggested these formed two clades; one containing previously lodged A. polymorpha sequences while the other remaining unidentified. There was, however, significant overlap in the within and between clade pairwise distances, suggesting all 41 specimens belong to Adelieledone polymorpha. The sampled sequences had a mean distance of 1.1% (SE 0.4%) from the published sequences. The intraclade pairwise distances ranged from 0% to 1.4% (SE 0.5%), with a mean of 1.1% (SE 0.4%) and the largest distance being between two collected specimens from nearby locations at different depths (411 m and 748 m), suggesting perhaps bathymetric structuring.
Ten specimens were assigned to the cirrate genus Cirroctopus although identification to species level failed. All samples grouped within a single clade with a mean internal variation of 0.3% (SE 0.2%), with a mean distance of 2.2% (SE 0.7%) to the closest related previously registered sequence, Grimpoteuthis glacialis (Accession no. AF377962), a species which has recently been removed from Grimpoteuthis to Cirroctopus [42]. Of the six remaining specimens, four were identified to species level (one as Thaumeledone peninsulae, three as Megaleledone setebos), one to genus but not species (Benthoctopus), and one to neither species nor genus (CEAMARC V3 3624). This means the standard K2P distance and NJ phylogenetic analysis approach gave identification success rates of 99.5% (201 of 202 specimens) to genus level and 88.1% (178 of 202 specimens) to species level. Details on sequences contained within each clade and their respective GenBank accession numbers, CEAMARC specimen vouchers, preservation, and catch data can be found in the supplementary table.
3.2.2 Bayesian Inference
Results obtained through Bayesian Inference can be seen in Fig. 2. The proportion of samples that could be identified to genus and species was the same as for the K2P distance-based NJ phylogeny method. Also in this method, the lack of a clear gap between intra- and interspecific variation made species delimitation difficult and partially subjective.
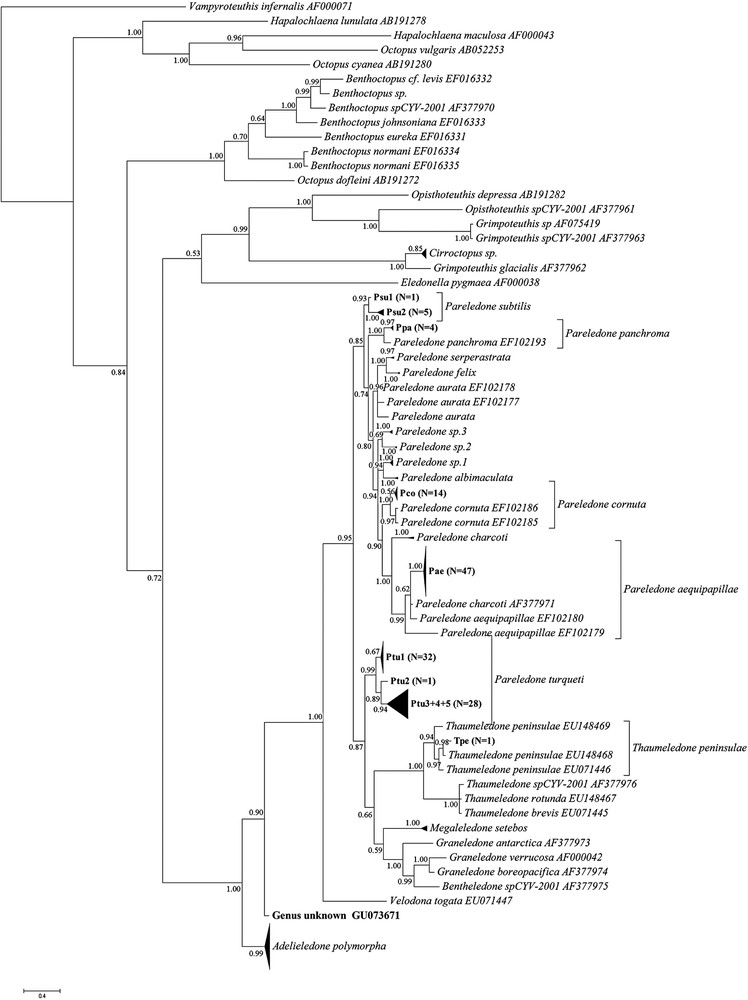
Phylogenetic tree of sample sequences on template sequences obtained from GenBank as obtained by Bayesian Inference of Phylogeny. Branches with a distance of 0.3 are collapsed, as are polytomies with more than ten branches. Numbers on branches indicate posterior probabilities. Labeling of clades within plausible species clades corresponds to that used in Supplementary table containing sequence accession numbers, CEAMARC voucher numbers and catch data. N indicates the number of sample sequences contained in each collapsed clade.
3.2.3 Online BLAST
Using the online BLAST for specimen identification by searching among sequences published on GenBank gave a 40% error rate compared to the results using K2P distance and Bayesian Inference methods. Most of this disagreement, almost 60%, was due to a sequence (GenBank accession no. AF377971) published prior to the review of P. charcoti by Allcock [19], causing all P. aequipapillae to be identified as P. charcoti. However, apart from the 23 samples from probably previously unsequenced species, where the most closely related species came up as probable candidates, there was disagreement between the methods regarding the samples identified as P. subtilis by K2P NJ and Bayesian inference (CEAMARC V3 3491, 3504-6, 3610, 3623; Accession numbers GU073628, GU073640-2, GU073669, GU073670, respectively). BLAST instead gave P. aurata as the most likely species, with a slightly higher maximum and total BLAST score than P. subtilis (1175 and 1164 respectively). No sequences were found to be new or unknown; the sample that could not be assigned to species nor genus by K2P NJ and Bayesian Inference (CEAMARC V3 3624) was identified as Adelieledone polymorpha using BLAST.
3.2.4 CAOS
Applying the CAOS algorithm-based software P-Gnome [25] on a Maximum Likelihood Tree of pre-identified sequences to identify pure characteristic attributes failed to recover apomorphies for several species-level nodes, including M. setebos, G. boreopacifica, G. verrucosa, T. peninsulae, T. rotunda, P. albimaculata, P. aurata, P. felix, P. panchroma, P. serperastrata and P. subtilis. Classifying the sample sequences according to the CA's defined by P-Gnome gave conflicting results compared to the identifications obtained by the previous three methods with 80 of 202 samples assigned to species other than those estimated by both NJ and Bayesian Inference. Of these, 48 were sequences found to belong to M. setebos but which were identified as P. turqueti by the distance approaches. All incirrate specimens were assigned to an unidentified species of Opisthoteuthis (Opisthoteuthis spCYV-2001, GenBank Accession no. AF377961), while all specimens previously found to belong to P. panchroma were identified as P. aequipapillae. The sample that could not be assigned to species nor genus (CEAMARC V3 3624) came up as Thaumeledone peninsulae. Four sequences could only be assigned to an internal node below species level within the Pareledone clade, and thus failed to identify to species.
3.2.5 Support from catchment data
Despite the overlap in inter- and intraspecific variation creating problems in the delimitation of species clades, and the lack of rigorous morphological taxonomic work verifying the molecular results, photographs taken of the majority of the specimens provided some support for the identifications: While Pareledone “sp.1” and Pareledone “sp.2” appear as closely related sister clades in the NJ analysis (Fig. 1, Table 1), they looked quite different. The degrees of webbing, relative arm length and coloration were very different, with P. “sp.1” having much deeper webbing, shorter arms, and a light bluish mantle with dark purple arms as opposed to the brown mantle with light grey arms of P.“sp.2”. Members of these two clades could furthermore be distinguished from the P.“sp.3” and P. albimaculata (Fig. 2) by their smooth skin [19]. P. “sp.3” differed from all sequenced members of Pareledone in that both dorsal and ventral surfaces of the mantle were papillated, a trait only possessed by P. framensis [19]. Further crude morphological support for the species clades shown in Figs. 1 and 2 includes, in addition to dorsally papillated and ventrally smooth mantle, dorsally papillated skin that stop at the lateral fold in specimens identified as P. aequipapillae; “warts” noted present above eyes in specimens labeled P. cornuta; no enlarged papillae above eyes in specimens found to belong to P. panchroma; and relatively deep webbing and no enlarged papillae above eyes in specimens identified as P. subtilis [19]. These observations indicate that the failure of BLAST and CAOS to recognize P.“sp.1”, P.“sp.2” and P.“sp.3” as unidentifiable sequences and the identifications of P. subtilis as P. aurata were indeed errors, although they do not necessarily verify the overall “success rates” of the K2P-based and Bayesian approaches.
Similar crude support for the identification of the remaining species can also be gathered from the sampling data collected. While only two of the three specimens identified as Megaleledone setebos could be readily distinguished from P. turqueti by their large size, the third was distinguished by its very deep webbing [43]. The specimens designated to P. turqueti were of brownish or grayish color and had similar appearances in terms of relative arm lengths and webbing. One of the male specimens identified as Adelieledone polymorpha (Accession no. GU073666, Apo1 in Fig. 1) had a mantle length of 70 mm, (total length 155 mm) and a hectocotylus with eight transverse ridges, which distinguishes it from A. piatkowski and A. adeliana but fits the description of A. polymorpha [8]. Specimens identified as A. polymorpha were otherwise of similar color and relative proportions, and the basal clade (Apo 4, Fig. 1) contained several specimens, including mature males, with mantle and total lengths longer than that described for A. adeliana and A.piatkowski, e.g. GU073562 (Mantle length 60 mm, total length approx. 175 mm). Similarly, specimens that clustered in the sister clade to Cirroctopus glacialis were all very similar in appearance to both each other and photos of Cirroctopus glacialis, more so than any other incirrate genus [44]. The specimen identified as Thaumeledone peninsulae was small (28 mm total length) and of a purplish color, while the specimen designated to the genus Benthoctopus was the only octopus with biserial suckers.
4 Discussion
Of the 202 sequenced specimens, only one failed to identify to genus level using Neighbor-Joining phylogenetic analysis from Kimura-2-Parameter model-based distances. The proportion of specimens identified to species was also high, with 178, or 88.1%, of the 202 sample sequences grouping within clades containing sequences from previously identified specimens. The use of the more powerful Bayesian Inference of Phylogeny supported the results obtained by Neighbor Joining, with sequences producing very similar species clusters.
However, in comparison to previous observations on congeneric mtCOI variation in members of Mollusca [23,29], the level of interspecific divergence within Pareledone was very low. Also, compared to other genera within the Octopoda, such as Thaumeledone or Octopus, there was little variation between many of the species within Pareledone. Intraspecific variation was found to be variable between members of Pareledone, and in the cases of P. turqueti and P. aequipapillae actually exceeding the interspecific variation between other species in genus. The overlap between inter- and intraspecific variation within Pareledone may be due to several factors (Summarized by Funk and Omland [45]), which require more thorough investigations to disentangle. Regardless of the cause, however, the implication of this overlap is that the level of certainty at which specimens could be designated to species was reduced. The proportion of specimens here identified to species level by the use of K2P distances, NJ and Bayesian Inference is therefore dependent on an interpretation of inter- and intra-clade distances in combination with clustering of sequences relative to a set of template sequences. This highlights one of the limitations of the distance-based barcoding approach to species identification in largely unsampled areas or taxa, as a thorough understanding of the genetic variation is needed to know the thresholds which delimit species, particularly if inter- and intraspecific variation overlaps, or nearly so [30].
The overlap between intra- and interspecific variation at COI also has implications for the accuracy of BLAST as a means of identifying unknown samples; levels of variation deviating from the set standard for species delimitation may lead to misidentification of specimens in reality belonging to unsequenced species [46]. Such was the case for the specimens belonging to “species-clades” rendered unknown by both K2P NJ and Bayesian Inference and supported by morphological indications, which were all assigned to previously sequenced species by BLAST. In addition, the lack of a “barcoding-gap” led to disagreement between BLAST and phylogenetic methods in assigning of specimens to species sequenced for COI. The major source of error in specimen identification by BLAST, however, was an incorrect species-label for one of the sequences (GenBank Accession number AF377971). Such errors are less likely to occur when performing a BLAST search on official barcoding sequences, as these are subjected to a strict set of protocols designed to avoid such complications (http://www.barcoding.si.edu/protocols.html) (but see Meier et al. [47]). Thus, excluding the misidentifications due to incorrect sequence-labeling and lack of probable conspecific sequences, the proportion of disagreement to the tree building approaches in identification of samples to previously sequenced species was only 5%. While an identification accuracy as such needs verification by more rigorous morphological data, the similar results obtained by BLAST to those of more powerful phylogenetic analyses suggest it performs reasonably well even with closely related sequences. Contrary to previous results from molluscan barcoding studies [48], BLAST therefore appears potentially useful in the identification, particularly preliminary, of octopod samples. In contrast, with an “error rate” of almost 40%, there was little agreement between the character and distance-based methods. This disagreement is probably the result of a lack of unique sets of characteristics for many of the pre-identified sequences. The high number of species nodes where no simple pure apomorphic CA's were identified indicates that also a character-based approach is negatively affected by an overlap between intra- and interspecific variation, perhaps even to a larger degree than the distance-based methods. Furthermore, as compound CA's in isolation can be unreliable [28], the application of a character-based DNA barcode system for octopods is unlikely to be accurate. In addition, a character-based approach to genetic barcoding of species is at least as vulnerable to insufficient previous sampling as distance-based methods [cf. 27]: Relying on one to just a few individuals, as is the case in poorly sampled taxa, will not give any high level of certainty about the identified CA's [27,28]. In a larger population sample, these CA's may or may not be included in a character-based genetic barcode, depending on their prevalence in the remaining sample [27]. This means that, just as when relying on distance-based methods [26], a continuous update on CA's are required as the database is populated with additional sequences from the same population, species, and new species.
As this study represents the first sampling of octopods from the slope off George V Land since the major revisions of Adelieledone [8], Pareledone [5,11,19], and Thaumeledone [7,14], the catchment data provides an important contribution to the current understanding of the species distributions of these genera. Most notable is the large number of species previously thought to be confined to the west Antarctic, which now appear to be circum-Antarctic in distribution, namely A. polymorpha, P. aequipapillae, P. aurata, P. cornuta, P. panchroma, P. subtilis, P. turqueti, and T. peninsulae [4] (Table 2). Interestingly, the presence of East Antarctic specimens with very little genetic distance separating them from their West Antarctic counterparts indicates substantial genetic exchange could be taking place. While this could also be due to a low evolutionary rate of the octopod COI reducing the rate of differentiation between populations, one might then expect low intraspecific variation in local populations. Instead, there is significant structuring of several of the East Antarctic populations, particularly A. polymorpha and P. turqueti (Figs. 1 and 2). Allcock et al. [49] found high genetic divergence between Pareledone turqueti island shelf populations isolated by a deep trench (> 1000 m) and attributed this to poor dispersal abilities across unsuitable habitat due to direct development. Although no obvious bathymetric or geographic partitioning was observed in the present study, there were indications that at least depth may have an effect on the genetic structuring of A. polymorpha.
Revised distributions and bathymetric ranges of eledonine octopods obtained off George V's Land, Antarctica, during Voyage 3 2007-2008 onboard R/V Aurora Australis. Abundance shows number of specimens obtained and their catch depths are listed with bathymetric ranges from the literature noted in parentheses and citations in superscript.
| Species | Abundance | Depth range | Distribution |
| Adelieledone polymorpha | 41 | 195–870 m (62–930 m) [6] | Circum-Antarctic |
| Megaleledone setebos | 3 | 265–445 m (32–850 m) [51] | Circum-Antarctic |
| Pareledone aequipapillae | 47 | 190–750 m (110–465 m) [19] | Circum-Antarctic |
| Pareledone aurata | 1 | 220 m (89–465 m) [19] | Circum-Antarctic |
| Pareledone cornuta | 14 | 165–445 m (130–434 m) [19] | Circum-Antarctic |
| Pareledone panchroma | 4 | 1096–1711 m (400–930 m) [19] | Circum-Antarctic |
| Pareledone subtilis | 6 | 410–750 m (190–430 m) [19] | Circum-Antarctic |
| Pareledone turqueti | 61 | 150–1160 m (25–1047 m) [4,6] | Circum-Antarctic |
| Pareledone “sp.1” | 6 | 580–930 m | Confined to Eastern Antarctica? |
| Pareledone “sp 2” | 2 | 255–280 m | Confined to Eastern Antarctica? |
| Pareledone “sp 3” | 4 | 800–1160 m | Confined to Eastern Antarctica? |
| Thaumeledone peninsulae | 1 | 1096 m (377–1530 m) [7] | Circum-Antarctic |
Another interesting issue that arises with the apparent extended species range of A. polymorpha regards its relationship with A. adeliana. Few characters separate these two species, and it was noted in its redescription by Allcock et al. [8] that A. adelieana was most likely a valid species due to the geographic distances separating their type localities. The authors also noted, however, that the apparent continuum of morphological forms around Antarctica and their status can probably only be resolved using molecular techniques. Considering that A. polymorpha and A. adeliana now appear to be sympatric, or even conspecific, a review of Adelieledone incorporating molecular data and samples from a wider geographical range would be useful.
Further sampling off the coast of George V Land, Antarctica, is likely to provide important and interesting insights into the biology, phylogeography and phylogenetics of Southern Ocean octopodids. While the taxonomic value of the present study suffered under the lack of rigorous morphological verifications, the results still provided identifications useful in further non-systematic studies. Even if the species label given to each sample were to be incorrect, the use of a phylogenetic approach in identifying specimens from a large sample nevertheless grouped samples into plausible species clades, enabling further work to be undertaken. This provides a great advantage in non-systematic studies of organisms which taxonomy has yet to be resolved, but where a basic phylogenetic understanding is necessary [50]. That said, the use of even crude morphological observations greatly improved the degree of confidence with which the results could be interpreted, illustrating the indispensability of traditional morphology-based taxonomy.
Acknowledgements
Funding for this project was provided by the Australian Antarctic Division and the Herman Slade Foundation. We would like to express our sincere thanks and gratitude to the Australian Antarctic Division for providing sea-time aboard RV Aurora Australis, the crew onboard RV Aurora Australis for bringing up countless trawl catches, and to voyage leader Dr Martin Riddle and deputy voyage leader Ms Sarah Robinson for a productive research cruise. We would also like to thank Amanda Talaba for her very helpful constructive criticism on the manuscript.