

1 Introduction
The giant red shrimp, Aristaeomorpha foliacea (Risso 1827), is an important economic resource exploited in the Mediterranean Sea since 1959 [1]. Recently, a new fishing ground in the Mozambique Channel has been established [2]. In the Mediterranean Sea, the species inhabits muddy bottoms of the continental slope between approximately 100 and 1200 meters depth [3,4] and its geographical distribution is described as patchy with abundances higher in the Eastern than in the Western basin of the Mediterranean Sea [5]. Due to its economic relevance, several aspects of its biology, ecology and fisheries potential have been investigated [3,6 and cites therein,7]. However, as far as the authors’ knowledge is concerned, no genetic studies have been conducted on population genetics issues on this species.
In this work, we tested the suitability of Inter Simple Sequence Repeats (ISSRs) as molecular markers for A. foliacea, in order to give an insight into genetic variability and structure of the species. The molecular technique of ISSRs relies on the amplification of DNA fragments between two closely and inversely oriented microsatellites [8]. ISSRs do not require any previous knowledge of the species’ genome, as primers comprise a short representation of the repeated motif plus one to three degenerated anchoring nucleotides. Given that microsatellites are randomly spread along the genome, amplifications of ISSRs are multilocus and polymorphic [8]. Since the first application of ISSRs in the marine realm on the bivalve Gemma gemma [9], these markers have been further implemented in genetic studies of other marine invertebrates [10–13].
2 Materials and methods
2.1 Sampling and DNA extraction
A total of 303 adult specimens of A. foliacea were sampled from six locations of the Mediterranean Sea and one location in the Western Indian Ocean (Mozambique Channel) (Fig. 1). Mazara del Vallo (MAZ) and Portopalo (PPA) samples were purchased from local fishermen. The specimens from Ibiza Channel (IBI, 39° 02’ N, 02° 39’ E) and Indian Ocean (MOZ, 25° 57’ S, 34° 38’ E) were supplied by the Instituto Español de Oceanografia; those from the Aegean Sea (AEG, 37° 17’ N, 22° 53’ E) and Ionian Sea (ION, 37° 31’ N, 21° 22’ E; MEDITS08) were provided by the Hellenic Centre for Marine Research, and that from the Tyrrhenian Sea (TYR, 42° 28’ N, 9° 43′ E; MEDITS08) was provided by the IFREMER. DNA extraction followed the procedure outlined in Fernández et al. [14]. Genomic DNA and a 25 ng/μl subsample for amplification were diluted in ddH2O and preserved at −4 °C.
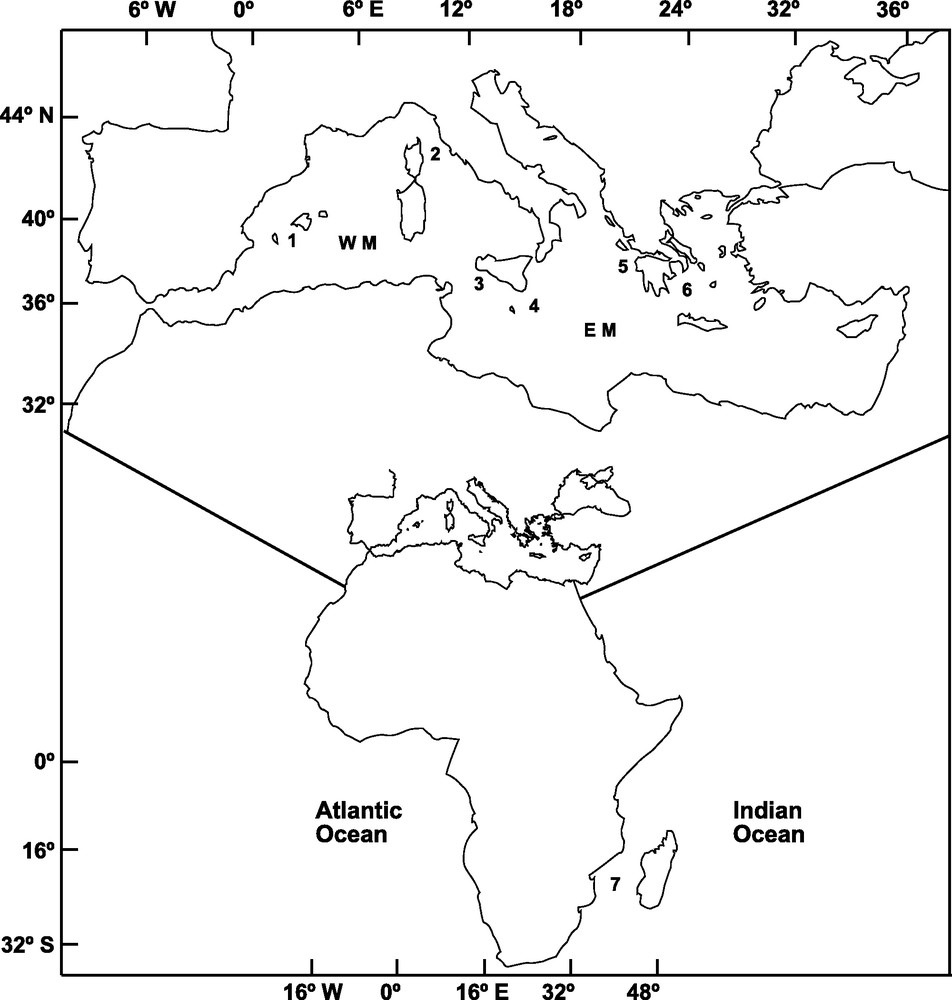
Sampling locations of Aristaeomorpha foliacea in the Western Mediterranean (WM): 1: Ibiza Channel, 2: Tyrrhenian Sea, 3: Mazara del Vallo; in the Eastern Mediterranean (EM): 4: Portopalo, 5: Ionian Sea, 6: Aegean Sea; and in the Indian Ocean: 7: Mozambique Channel.
2.2 Inter Simple Sequence Repeat
Thirteen ISSR primers were preliminary tested: IT 1, IT 2, IT 3, SAS 1, SAS 2, SAS 3, SAS 4, SAS 5var, SAS 6, PT 1, UBC 811, UBC 827 and UBC 809 ([12 and references therein], except for SAS 5var that was newly designed). Primers IT 1, IT 2, IT 3, SAS 2, SAS 3 (Table 1) yielded clear banding patterns that could be scored with confidence and they were chosen for subsequent analysis. All PCRs were carried out in a 10 μl final volume, containing ∼2.5 ng of template DNA, 0.5 U Taq DNA Polymerase (EuroTaq by EuroClone), 1 × PCR buffer (EuroClone), 200 μM of each dNTP (Sigma), 0.4 μM of primer (Sigma-Genosys), 2 mM (for IT 1, IT 2, IT 3) and 2.5 mM (for SAS 2, SAS 3) of MgCl2 (EuroClone) and H2O to bring to volume. Amplifications were performed in a thermal cycler GeneAmp PCR System 2700 (Applied Byosystems) under the following conditions: 3 min of initial denaturation at 94 °C, followed by 35 cycles of 40 sec for denaturation at 94 °C, 45 sec for annealing at 55 °C (for IT 1, IT 2, IT 3) or 60 °C (for SAS 2, SAS 3) (Table 1) and 1 min and 40 sec for extension at 72 °C, followed by 5 min final extension at 72 °C. For each primer and PCR, replicates and negative controls were included in the amplification in order to verify consistency of results. Procedure for electrophoresis and visualization of PCR products were as in Pannacciulli et al. [13]. The size of ISSR fragments obtained varied between 300 and 1500 bp (Table 1).
Inter Simple Sequence Repeat (ISSR) primer names and sequences tested in the analysis of Aristaeomorpha foliacea, with details on the melting temperature (Tm), annealing temperature (Ta), number of polymorphic bands and range of molecular weight in base pairs (bp) of each primer amplified by PCR.
| Primer | Sequence | Tm (°C) | Ta (°C) | N° of polymorphic bands | Size range (bp) |
| IT 1 | 5′-(CA)8GT-3′ | 54 | 60 | 34 | 300–1500 |
| IT 2 | 5′-(CA)8AC-3′ | 54 | 60 | 29 | 375–1500 |
| IT 3 | 5′-(CA)8AG-3′ | 54 | 60 | 26 | 300–1500 |
| SAS 1 | 5′-(GTG)4GC-3′ | 48 | No products | – | |
| SAS 2 | 5′-(CTC)4GC-3′ | 48 | 55 | 31 | 400–1500 |
| SAS 3 | 5′-(GAG)4GC-3′ | 48 | 55 | 30 | 300–1500 |
| SAS 4 | 5′-(CAC)5GC-3′ | 58 | No products | – | |
| SAS 5var | 5′-(GTG)5TC-3′ | 52 | No products | – | |
| SAS 6 | 5′-(AT)8G-3′ | 56 | No products | – | |
| PT 1 | 5′-(GT)8C-3′ | 54 | No products | – | |
| UBC 811 | 5′-(GA)8C-3′ | 52 | No products | – | |
| UBC 827 | 5′-(AC)8G-3′ | 52 | No products | – | |
| UBC 809 | 5′-(AG)8G-3′ | 52 | No products | – |
2.3 Data analysis
ISSRs are interpreted as dominant diallelic markers with the dominant allele determining the presence of band [8]. Hence, dominant homozygotes and heterozygotes produce presence of band, whereas absence of band is indicative of recessive homozygotes. According to this interpretation, our dataset was constituted by a presence/absence (1/0) matrix of 150 loci and 295 individuals. When a specimen did not amplify for one primer, data were considered as missing for the bands corresponding to that primer. Taking into account that ISSRs are random markers, it is necessary to check that all loci behave as neutral, so as to confidently apply all subsequent statistical models. The probability that a locus departs from the distribution of FST under a neutral model was assessed with Bayescan 1.0 [15]. This method relies on estimates of genetic structure among sampling sites with the rationale that loci under positive selection present a significantly higher genetic differentiation than the large part of neutral loci over the whole genome, whereas loci under selection show lower differentiation. After 10,000 iterations, Bayescan determined that nine of the 150 loci were likely subject to selection (Table 2). Those loci were, therefore, removed from further analyses, reducing the dataset to 141 loci. Discrete bands information was transformed into allele frequencies using the Lynch and Milligan's [16] correction, which assumes Hardy-Weinberg equilibrium, as implemented in TFPGA [17]. Nei's [18] genetic diversity (H) was used to estimate within-sample genetic variability. Differences between Nei's H values were tested for significance in all possible pairs of samples by t-tests of arcsine square root transformed values [19]. Two-tailed t-tests were employed, as there was no expected direction of differences in H values. Multiple tests were adjusted with sequential Bonferroni adjustment with an initial α = 0.05 to correct for Type I error [20]. Weir and Cockerham's [21] coancestry coefficient (θ), an unbiased estimator of FST, was calculated with TFPGA [17]. Gene flow was estimated by Wright's [22] formula, Nm = [(1/θ)–1]/4, where Nm is the number of effective migrants per generation. Furthermore, the correlation between the matrices of pairwise values of θ and minimal nautical distances in kilometres between localities was tested with Mantel test [23] as implemented in the IBDWS program [24]. ARLEQUIN 3.5 [25] was used to carry out the analysis of molecular variance (AMOVA [26]) to examine the partitioning of genetic variation within samples, among samples within geographical regions and among geographical regions. As the samples from MAZ and PPA lie close to the bordering line between Western and Eastern Mediterranean basins, two alternative groupings were tested: first, MAZ and PPA were both associated with the Eastern basin; second, both localities were associated with the Western basin. The significance of partitioning was evaluated by using non-parametric permutation tests with 10,000 replicates [26]. Nei's [27] genetic distance and Cavalli-Sforza and Edwards’ [28] chord distances between localities were calculated with GENDIST. Cavalli-Sforza and Edward's [28] was used to construct a Neighbor-joining tree [29] with NEIGHBOR. CONSENS was used to create a consensus tree after 1000 replicates with SEQBOOT. All these programs are included in PHYLIP package [30]. Alternatively, data from specimens were pooled into populations by creating a matrix of 149 loci and 7 localities (Appendix 1 (Supplementary Material)). Autapomorphies (1 locus) and those loci which were present in all localities (61) were removed from the matrix, creating a final dataset of 79 polymorphic loci and 7 localities. This dataset was used to run PAUP v. 4.0b10 [31] in order to infer Wagner and Fitch [32,33] and Dollo's [34] parsimony, using heuristic search and tree bisection reconnection branch-swapping algorithm with hundred random sequence addition. Robustness of trees was tested using bootstrap analysis [35] with 1000 replicates. Species’ genetic structuring was further investigated by means of an individual based approach, as implemented in STRUCTURE 2.3.1 [36,37], in order to avoid the artefacts due to the assumption of predefined populations [38]. The underlying population structure was inferred by the Bayesian model-based clustering algorithm applying the admixture model with independent allelic frequencies [39]. This method allows to identify the number of clusters of genetically related individuals (K) from multilocus genotypes, irrespective of their geographical location. The method described in Evanno et al. [40], which retrieves the highest hierarchical structure present in the data, was employed to accept the correct K-value. For each value of K ranging from one to the maximum number of local samples considered, five independent runs were performed, each consisting of 100,000 iterations after a burn-in period of 100,000. Consistency of results across replicated runs in providing the average value of the logarithm of posterior probability of data ln P(D) was considered to identify clusters of individuals.
Estimates of within-sample genetic diversity (± standard deviation) and performance of each ISSR primer tested on Aristaeomorpha foliacea for each locality and total, with the number of specimens (N), number of amplified specimens (nA), Nei's [18] genetic diversity (H), number of specimens which have amplified for all and each primer (nT, nIT 1, nIT 2, nIT 3, nSAS 2, nSAS 3) and number of bands obtained for all and each primer (Total, IT 1, IT 2, IT 3, SAS 2, SAS 3).
| Region | Locality | N | nA | H | nT | Total | nIT 1 | IT 1 | nIT 2 | IT 2 | nIT 3 | IT 3 | nSAS 2 | SAS 2 | nSAS 3 | SAS 3 |
| Western Mediterranean (WM) | ||||||||||||||||
| Ibiza Channel, Spain (IBI) | 51 | 49 | 0.111 ± 0.107 | 35 | 133 | 45 | 33 | 44 | 24 | 48 | 23 | 41 | 28 | 49 | 25 | |
| Tyrrhenian Sea, France (TYR) | 48 | 48 | 0.101 ± 0.107 | 39 | 133 | 46 | 33 | 46 | 24 | 46 | 23 | 44 | 28 | 46 | 25 | |
| Mazara del Valo, Italy (MAZ) | 40 | 39 | 0.100 ± 0.113 | 32 | 117 | 39 | 27 | 37 | 17 | 37 | 22 | 36 | 26 | 39 | 25 | |
| Eastern Mediterranean (EM) | ||||||||||||||||
| Portopalo, Italy (PPA) | 40 | 36 | 0.078 ± 0.099 | 20 | 105 | 27 | 26 | 34 | 16 | 28 | 17 | 26 | 24 | 31 | 22 | |
| Ionian Sea, Greece (ION) | 38 | 37 | 0.084 ± 0.102 | 25 | 112 | 34 | 30 | 35 | 17 | 35 | 18 | 28 | 26 | 36 | 21 | |
| Aegean Sea, Greece (AEG) | 44 | 44 | 0.110 ± 0.116 | 35 | 125 | 44 | 32 | 38 | 21 | 42 | 21 | 41 | 29 | 43 | 22 | |
| Indian Ocean (IO) | ||||||||||||||||
| Mozambique Channel, Mozambique (MOZ) | 42 | 42 | 0.090 ± 0.017 | 33 | 118 | 41 | 27 | 38 | 18 | 40 | 17 | 36 | 28 | 42 | 28 | |
| Total | 303 | 295 | 0.100 ± 0.099 | 211 | 150a | 276 | 34 | 270 | 29 | 276 | 26 | 252 | 31 | 286 | 30 |
a After Bayescan analysis, 9 loci were removed because they were found to be under selection (2 from IT 1, 2 from IT 2, 1 from IT 3, 3 from SAS 2, 1 from SAS 3).
3 Results
Only bands which produced consistent profiles in two amplification replicates were considered. Overall, 150 different bands, varying from 300 to 1500 bp were obtained with five primers across seven samples and 295 individuals. The number of polymorphic bands per primer ranged between 26 for IT 3 to 34 for IT 1; however, the primer which amplified the highest mean number of bands per population was IT 1 (28.71 ± 3.04 polymorphic bands); whereas that producing the lowest mean value was IT 2 (19.57 ± 3.41 polymorphic bands). IBI and TYR were the localities where the highest mean number of bands was obtained (26.60 ± 4.04 polymorphic bands); whilst PPA was the sample which amplified the lowest mean value (21.00 ± 4.36 polymorphic bands) (Table 2). We did not find individuals sharing identical banding pattern at any site neither across locations. Average estimates of genetic diversity after pairwise t-test and Bonferroni correction did not significantly differ among localities, with mean H = 0.105 ± 0.015 (Table 2). The coancestry coefficient indicated low genetic divergence among localities within regions (θ = 0.013 ± 0.002), and the removal of MOZ from the dataset did not affect that result (θ = 0.012 ± 0.001). The estimate of gene flow (Nm = 18.407) and the Mantel test (Z = 2269.73, P = 0.269) suggested high levels of population genetic connectivity and absence of isolation by distance, even when MOZ was omitted from the analysis (Nm = 21.489; Z = 205.04, P = 0.006).
AMOVA analysis (Table 3) of the whole dataset indicated that most of the molecular variance was present within samples (98.7%); however the Φ-statistics value associated to the remaining part of variance was significant (ΦST = 0.013, P < 0.005). The situation did not change when the sample from MOZ was omitted from the analysis, assigning the greatest portion of variance to differences within samples (98.8%, ΦST = 0.012, P < 0.001). When localities were grouped according to geographical regions (EM, WM, MOZ), no genetic variance was assigned to the among-region level (−0.1%, ΦST = 0.012, P = 0.002). After omitting MOZ from analysis, no genetic variation was either attributed to the among-region level (slightly negative variance), as it was mostly associated to the within-sample (98.9%, ΦST = 0.011, P = 0.007) component and secondly to the within-region component (1.4%). Alternative grouping criteria did not provide any different results (Table 3).
Analysis of molecular variance (AMOVA) of Aristaeomorpha foliacea. Sample codes are as in Table 2.
| Hypothesis | Source of variation | df | Components of variance | % of variance | Φ-statistics | P |
| Unstructured | Among samples | 6 | 0.02737 | 1.28 | ΦST = 0.013 | 0.002 |
| Within samples | 289 | 2.10821 | 98.72 | |||
| Unstructured - MOZ omitted | Among samples | 5 | 0.02571 | 1.23 | ΦST = 0.012 | < 0.001 |
| Within samples | 248 | 2.06187 | 98.77 | |||
| Three regions (MOZ)(IBI, TYR, MAZ)(PPA, ION, EAG) |
Among regions | 2 | −0.00149 | −0.07 | ΦCT = −0.001 | 0.472 |
| Among samples within regions | 4 | 0.02844 | 1.33 | ΦSC = 0.013 | 0.005 | |
| Within samples | 289 | 2.10821 | 98.74 | ΦST = 0.012 | 0.002 | |
| Two regions (IBI, TYR, MAZ)(PPA, ION, EAG) |
Among regions | 1 | −0.00639 | −0.31 | ΦCT = −0.003 | 0.700 |
| Among samples within regions | 4 | 0.02954 | 1.42 | ΦSC = 0.014 | 0.006 | |
| Within samples | 248 | 2.06187 | 98.89 | ΦST = 0.011 | 0.007 | |
| Two regions (IBI, TYR)(MAZ, PPA, ION, AEG) |
Among regions | 1 | −0.00868 | −0.42 | ΦCT = −0.004 | 0.731 |
| Among samples within regions | 4 | 0.03066 | 1.47 | ΦSC = 0.015 | 0.005 | |
| Within samples | 248 | 2.06187 | 98.94 | ΦST = 0.011 | 0.007 | |
| Two regions (IBI, TYR, MAZ, PPA)(ION, AEG) |
Among regions | 1 | −0.00490 | −0.24 | ΦCT = −0.002 | 0.603 |
| Among samples within regions | 4 | 0.02828 | 1.36 | ΦSC = 0.014 | 0.007 | |
| Within samples | 248 | 2.06187 | 98.88 | ΦST = 0.011 | 0.008 |
Genetic distances between populations (Table 4) showed that IBI and AEG were the two samples more closely related. In contrast, the two more genetically distant were PPA and ION, according to Cavalli-Sforza and Edwards’ [28] genetic chord distance, and PPA and MAZ, according to Nei's [27] genetic distance. The Neighbor-joining tree (Fig. 2) did not show any clustering that could be associated to the geographical position of samples. In fact, the AEG and the IBI samples were grouped together, as well as the MOZ and the ION samples. Only one most parsimonious tree was found for both parsimony algorithms employed (Fig. 3). Again, both cladograms did not show any expected geographical association, grouping localities as distant as IBI and AEG together, and PPA and MOZ together.
Nei's [27] genetic distance (above diagonal) and Cavalli-Sforza and Edwards’ [28] chord distance (below diagonal) between localities of Aristaeomorpha foliacea. Sample codes are as in Table 2.
| IBI | TYR | MAZ | PPA | ION | AEG | MOZ | |
| IBI | – | 0.0019 | 0.0033 | 0.0033 | 0.0023 | 0.0013 | 0.0029 |
| TYR | 0.0176 | – | 0.0026 | 0.0033 | 0.0026 | 0.0023 | 0.0025 |
| MAZ | 0.0271 | 0.0239 | – | 0.0047 | 0.0029 | 0.0027 | 0.0029 |
| PPA | 0.0324 | 0.0278 | 0.0355 | – | 0.0038 | 0.0043 | 0.0044 |
| ION | 0.0284 | 0.0280 | 0.0305 | 0.0373 | – | 0.0029 | 0.0021 |
| AEG | 0.0134 | 0.0221 | 0.0249 | 0.0357 | 0.0327 | – | 0.0035 |
| MOZ | 0.0326 | 0.0296 | 0.0275 | 0.0338 | 0.0255 | 0.0337 | – |
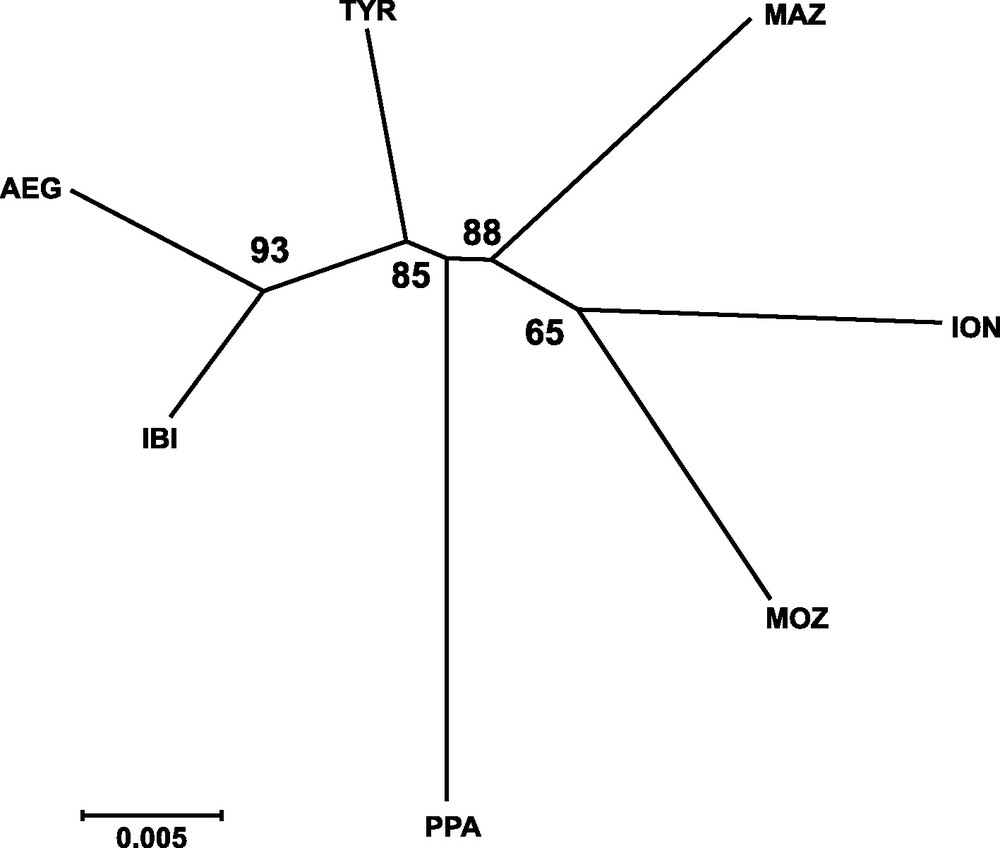
Neighbor-joining tree based on Cavalli-Sforza and Edwards’ [29] chord genetic distance illustrating the relationships among sampled localities of Aristaeomorpha foliacea. Bootstrap values after 1,000 replicates are indicated on the nodes. Sample codes are as in Table 2.
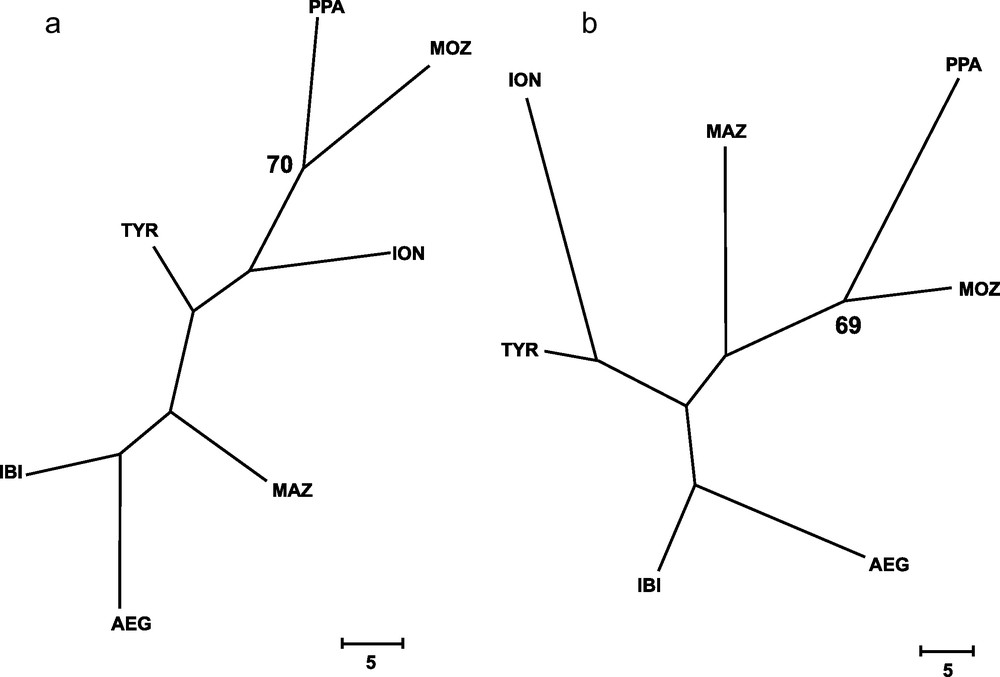
Wagner's (a) and Dollo's (b) most parsimonious trees, inferred from 79 loci for all samples of Aristaeomorpha foliacea, after 131 and 142 mutational steps, respectively. Bootstrap values after 1,000 replicates (> 65%) are indicated on the nodes. Sample codes are as in Table 2.
Replicate runs of STRUCTURE yielded consistent results and the uppermost hierarchical structure present in the entire dataset was detected for K = 2 by the K statistics [40] (data not shown). The distribution of the two clusters across individuals did not show any geographical meaning (Fig. 4).
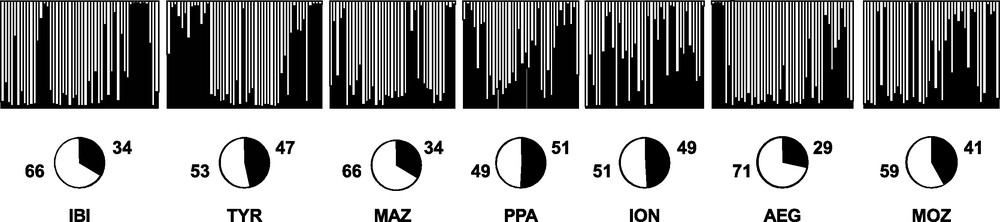
Bayesian assignment analysis for K = 2. Each bar represents an individual of Aristaeomorpha foliacea and its associated probability of belonging to one of the two genetic clusters detected (black and white). Pie charts indicate percentages of the haplogroups contributing to each sample.
4 Discussion
ISSRs proved to be useful markers for addressing a number of genetic problems, such as the correct assignment of doubtful fish specimens to their taxa [41,42], identifying a species complex within polychaetes [10], or depicting colonization patterns in a platyhelminthe species [43]. Nevertheless, their use in population genetic studies highlighted differences in their resolution power in marine species [9,11,13]. The present work is the first application of the ISSR technique to assess the genetic variability of a marine decapod and shows how these markers can be highly polymorphic and sensitive at the individual level.
Four of the five primers used in this study (IT 1, IT 2, IT 3, SAS 3) were also used in revised published literature. A comparison of results revealed that the number of loci scored in A. foliacea (119) was higher than those previously reported (59 in the gastropod Patella ferruginea, [11]; 29 in the red coral Corallum rubrum, [12]; 42 in three cyprinodontid fish, [41]; 40 in five sparid fish, [42]). The genetic diversity values (Table 2) obtained for A. foliacea (H = 0.078–0.111) were similar to those recorded by Pannacciulli et al. [13] in the barnacles Tesseropora atlantica (H = 0.067–0.122) and Chthamalus stellatus (H = 0.080–0.123). The high levels of genetic polymorphism ultimately implied that each specimen was characterized with a different fingerprint. The large amount of different genotypes identified was reflected in the large portion of variance (98.7%) allocated to the within-locality level (Table 3). Again, this proportion is noticeably higher than those reported for other marine invertebrates (61.0% for Gemma gemma [9]; 49.7% in P. ferruginea, [11]; 71.9% in T. atlantica and 94.6% in C. stellatus, [13]).
The dispersal capabilities of the species, at both adults and larval stage, may account for the large genetic heterogeneity at the within-locality level. A. foliacea adult shrimps undergo extensive movements along the water column [6]; thereby, horizontal migrations are also contemplated as possible. There are no studies on the larval biology of A. foliacea, but it is believed that it should be similar to that of the blue and red shrimp Aristeus antennatus, whose pelagic life lasts three to six weeks (F. Sardà, personal communication). In A. antennatus, larvae released into the pelagic environment, can be transported by currents for hundreds of kilometers downstream [44], so limiting the chances of local recruitment while favoring mixing on the large scale [45,46]. The efficient mixing of specimens with different genotypes originated from distant areas can lead to high within-locality genetic diversity and account for the absence of genetic structure on the large spatial-scale. The high number of migrants per generation, the low values of genetic divergence among regions, the relatively similar values of genetic distance (even among geographically distant localities), the topology of all trees together with the low bootstrap values, and the presence of both genetic clusters in all localities are consistent in giving support to the lack of significant large-scale genetic structuring.
Sound explanations for the lack of genetic differentiation between the Mediterranean Sea and the Indian Ocean samples are not easy to formulate. In previous studies, the transition from Mediterranean to Atlantic waters has resulted in a point of phylogeographic break for decapods such as Palinurus elephas (mitochondrial control region [47]). Conversely, Nephrops norvegicus did not show any sign of Atlantic-Mediterranean genetic differentiation by means of allozymes [48] or RFLPs of mitochondrial DNA [49]. In the latest species, the absence of significant genetic structuring was attributed to the homogenizing effect of larval dispersal. In a recent work on A. antennatus [14], based on a sampling strategy similar to the one of the present study and mitochondrial markers, a consistent genetic divergence was detected among biogeographical regions (Eastern Mediterranean, Western Mediterranean, Atlantic Ocean and Indian Ocean). This pattern was interpreted on the basis of the results of historical vicariance events and isolation by distance [14]. As partially sympatric species, life histories of A. foliacea and A. antennatus could have been similarly affected by these events. Against this suggestion and despite the geographical overlap of the sampling scheme, the genetic patterns of the two aristeid species were very different. Such results could be attributed to the different markers employed in the studies: mtDNA and ISSRs. On the one hand, the four-fold smaller effective size of the mitochondrial genome, compared to the nuclear one [50] could have made visible the footprint of the vicariance events detected in A. antennatus. On the other hand, the higher mutability rate and consequent possible saturation of ISSRs would be masking a possible situation of genetic differentiation.
Future research on A. foliacea employing different molecular markers is needed to understand whether: (i) ISSRs are unable to detect genetic structuring in A. foliacea due to their hypervariability; or (ii) this species actually lacks genetic differentiation over the large scale. Furthermore, the sampling scheme should be extended to the whole species’ distribution, in order to provide a global understanding of A. foliacea population genetic structure. Finally, it is believed that genetic information on this species would help to clarify aspects of its distribution and population dynamics, so providing fundamental knowledge for stock identification and management of this important fisheries resource.
Disclosure of interest
The authors declare that they have no conflicts of interest concerning this article.
Acknowledgements
Authors wish to thank A.M. Carbonell, K. Kapiris, C.Y. Politou, I. Sobrino, A. Souplet and A. Turco for their help in sample collection and P. Cossu for his technical assistance. Two reviewers provided constructive comments on the manuscript. This work was supported by a grant to MIR by Ministerio de Ciencia e Innovación, Spain (AGL2009-09228) and by a predoctoral fellowship to MVF by Ministerio de Educación y Ciencia, Spain (BES-2007-15865).