

1 Introduction
The diversity of life is perhaps the most stunning feature of our planet and has consequently stimulated ever-increasing interest in understanding how regional and local differences in the number of species arise and are maintained [1]. Coral reef ecosystem diversity is one of the highest in the world both by species richness and by the number of interrelations between species [2]. Mellin et al. [3] explored the environmental and spatial predictors of species richness and abundance in coral reef fishes at the Great Barrier Reef. Four annual surveys of coral reef fishes were combined with a 0.01 degree-resolution grid of environmental variables including depth, sea surface temperature, salinity and nutrient concentrations. This study demonstrated that distance-to-domain boundaries (i.e. relative geographical location) can offer an ecologically relevant alternative to geographical coordinates (i.e. absolute geographical location) when predicting biodiversity patterns, providing a proxy for multivariate and complex environmental processes that are often difficult or expensive to estimate. Similarly, Arias-Gonzales et al. [4] used extensive ecological data on depth, fish and habitat characteristics to perform a spatial prediction in the Quintana Roo state, Mexico. Fish species assemblages and different biotic variables of benthic organisms were characterized at 119 sampling stations. This study demonstrated that predictive accuracy of the diversity index map presented a good correlation coefficient, with maximum diversity index values in reefscapes composed of aggregation of coral colonies with seagrass beds. Overall, the question of variation in species richness of coral reefs has a long history and has spawned numerous hypotheses [5]. The nature, form and structure of data quantifying taxonomic diversity and its ecological or evolutionary correlates differ greatly between large and small scales [6], as do the methods used to measure them [7]. Thus, a number of reviews have examined diversity gradients at different scales in relation to various factors, including latitude, climate, elevation, productivity and temperature [5,6]. At the island scale, Willig et al. [8] reviewed at least 30 hypotheses that could explain the marine diversity. Despite nearly two centuries of inquiry, the mechanisms responsible for biodiversity gradients remain poorly understood [5,7].
In the present study, we aimed to test the relative contribution of several environmental variables in shaping diversity patterns of coral reef fish among 10 French Polynesian atolls. The diversity patterns were related to a range of geomorphologic descriptors of atolls (e.g. size of atoll, number of pass, length of submerged rim), morphological biotopes (e.g. pinnacles, fringing reef) and habitat descriptors in the lagoons (e.g. percentage cover of live coral, algae, coral rubble).
2 Material and methods
2.1 Study location
The present study was conducted on 10 French Polynesian atolls (Fig. 1) during one year (1995/1996). The lagoons were characterized by six morphological biotopes: fringing reef (crowns, which are areas along the submerged reef flat without any emergent land), inner reef flat of motu (emerged coral cays), pinnacle (hard substrate rising from the lagoon floor to near the water surface), pass (channels which are interruptions of the algal ridge on the oceanic side), hoa (shallow reef flat spillways between emergent deposits of coral rubble), and closed brackish water pools. The number of sampling sites devoted to each morphological biotope was related to its relative surface area in the lagoon, with a minimum of one site per biotope (Table 1).
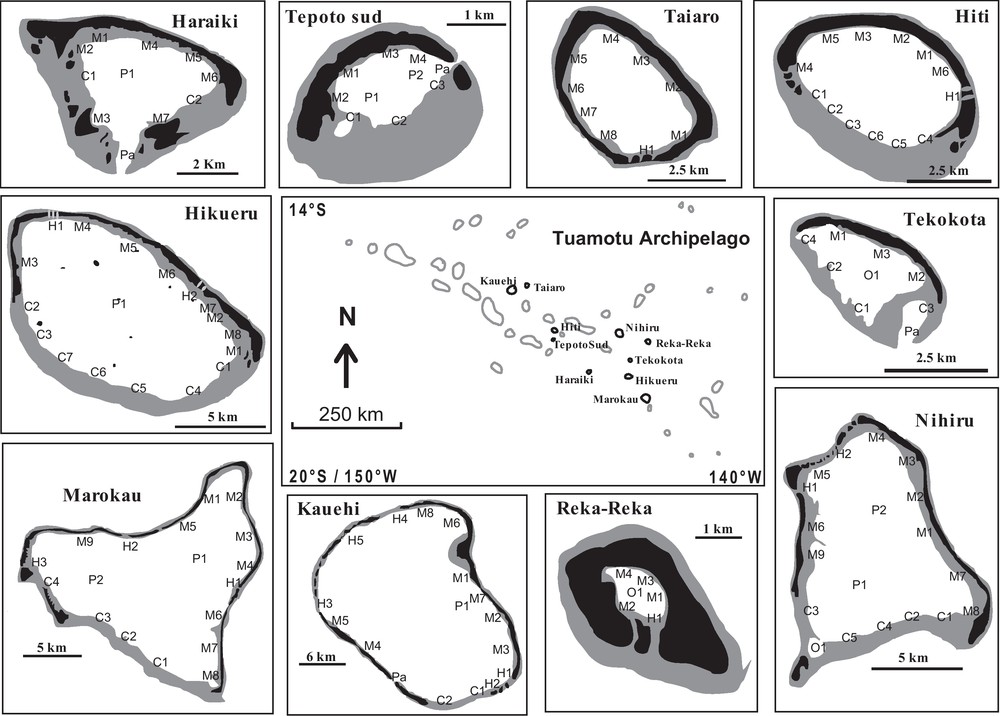
Map of Tuamotu Archipelago (French Polynesia). In each atoll, the sampling sites were encoded with a letter which characterised the different biotopes (M: motu; H: hoa; FR: fringing reef; P: pinnacles; Pa: pass; O: closed brackish water pools), and a number which distinguished sites censured in each biotope. Black shading indicates emerged areas; grey shading represent submerged reef rim.
Range of geomorphologic descriptors represented by the 10 French Polynesian atolls.
| n | Area (km2) | Mean depth | Length (km) | LWE (%) | % of perimeter occupied by | Index (0–3) | ||||||||
| Atoll | Lagoon | Crest | Motu | Perimeter | Subm. rim | Reef flat | Hoa | Pass | Pass | Pinnacle | ||||
| Kauehi | 17 | 343 | 315 | 27 | 15 | 45 | 71 | 15 | 22 | 58 | 38 | 4 | 2 | 2 |
| Taiaro | 9 | 17 | 11 | 5 | 4 | 15 | 15 | 0.2 | 1 | 0 | 100 | 0 | 0 | 0 |
| Hiti | 13 | 25 | 15 | 9 | 3 | 10 | 18 | 3 | 18 | 100 | 0 | 0 | 0 | 0 |
| Tepoto | 10 | 6 | 2 | 4 | 2 | 5 | 9 | 1 | 15 | 0 | 93 | 7 | 2 | 1 |
| Nihiru | 19 | 100 | 79 | 20 | 6 | 21 | 45 | 11 | 25 | 80 | 20 | 0 | 0 | 3 |
| Haraiki | 11 | 25 | 10 | 14 | 4 | 12 | 19 | 3 | 19 | 0 | 85 | 15 | 3 | 1 |
| Reka | 6 | 5 | 1 | 4 | 2 | 2 | 8 | 0.2 | 2 | 0 | 100 | 0 | 0 | 0 |
| Tekokota | 9 | 7 | 5 | 2 | 1 | 3 | 10 | 6 | 59 | 0 | 54 | 46 | 3 | 3 |
| Hikueru | 18 | 107 | 82 | 24 | 5 | 28 | 40 | 7 | 18 | 74 | 26 | 0 | 0 | 2 |
| Marokau | 18 | 256 | 217 | 38 | 14 | 30 | 75 | 12 | 17 | 71 | 28 | 1 | 1 | 3 |
2.2 Sampling strategy
At each sampling site, diurnal underwater visual counting of fish was carried out along four belt-transects (50 m long × 20 m wide, perpendicular to the isobaths) located 100 to 300 m apart. On each transect, fish were identified to species and total abundances were recorded for each species. The description of habitat was performed along each transect by the Line Intercept Transect Method [9]. One point every meter was assigned to one of the following categories: mud, sand, gravel, coral rubble, rock, flagstones, dead coral, live coral, boulders, green algae and brown algae. The percentage cover of each habitat category was then calculated for each transect.
2.3 Statistical analyses
Fish diversity was calculated for each sampling site (gathering the four transects within each biotope of each atoll) by measuring the number of species or species richness (S), and Shannon-Wiener's species diversity index (H’ = incorporates the number of species and the proportional distribution of individuals among the species) [10]. To explore the spatial autocorrelation between the 10 atolls, we conducted, firstly, a correspondence analysis (i.e. comparison of the relative abundance of different fish species among biotopes of each atoll) and, secondly, a PROTEST (i.e. Procrustean randomization test of community environment concordance: H’ and S values of each atoll vs. spatial distances between the 10 atolls) [10,11]. To explore the influence of geomorphologic and habitat descriptors on spatial variation of fish diversity among biotopes of each atoll, each descriptor was regressed in turn against values of S and H’. Then, stepwise regression analyses were used (using P < 0.05 of the F-test as the inclusion and/or rejection criterion) to identify the best linear models accounting for the observed variation of diversity estimates [10]. Prior to regression analyses, the extreme and influential cases were detected by carrying out analyses of residuals. The leverage and the Cook statistic of each sampling unit (six morphological biotopes) were measured so that any one with high values of leverage and influence could be removed and the model refitted to ensure consistency. Final models were compared based on the proportion of variance they explained in S or H’, expressed by the coefficient of determination.
3 Results
A total of 136,614 fish belonging to 302 species were recorded in the 10 atolls, corresponding to a mean density of 0.8 fish.m–2 (± 0.25 SE). The density and species richness displayed high variation among biotopes of each atoll and among the atolls (Fig. 2). For example, the species richness ranged from 6 species (fringing reef at Tepoto) to 118 species (Motu at Hikueru). The Shannon-Wiener index varied also: from 1.0 bits individual–1 (fringing reef at Tepoto) to 3.7 bits individual–1 (pass at Kauehi) (Fig. 2). Spatial patterns in fish species richness according to correspondence analysis was characterized by an apparent separation of Reka and Taiaro atolls (coordinates < −1.5 on axis 1) and Kauehi atoll (coordinates > 1.3 on axis 1) from the seven other atolls (Fig. 3). On axis 2, the analysis revealed some separation of motu and fringing reef biotopes (coordinates > 0 on axis 2) from the four other biotopes (coordinates < 0). As the 10 atolls were not divided into several groups according to their spatial coordinates (Figs. 1, 3), and as Protest analysis was not significant (no concordance between the spatial distances between the 10 atolls and H’ and S values of each atoll, 20,000 permutations, R2 = 0.03, P-value = 0.84), these results highlighted the absence of spatial autocorrelation.
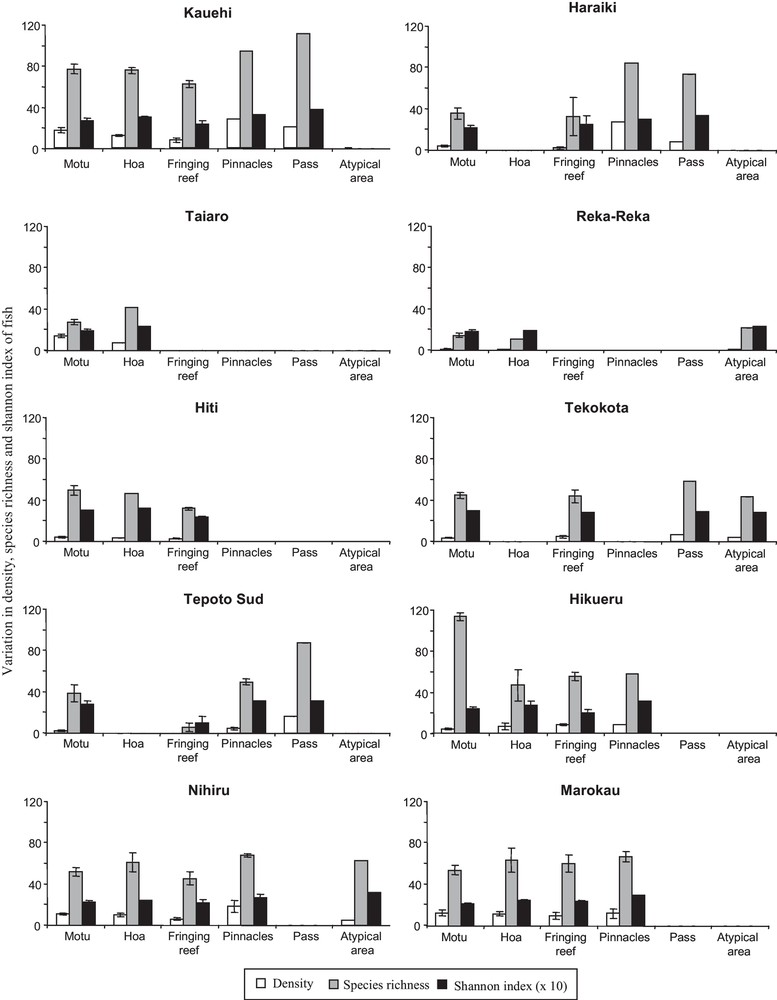
Variation in density (number of fish per 10 m2), species richness (total number of species) and Shannon-Wiener index (number of species and proportional distribution of fish among the species per biotope) of coral reef fish among biotopes of each atoll. Error bars represent one standard error.
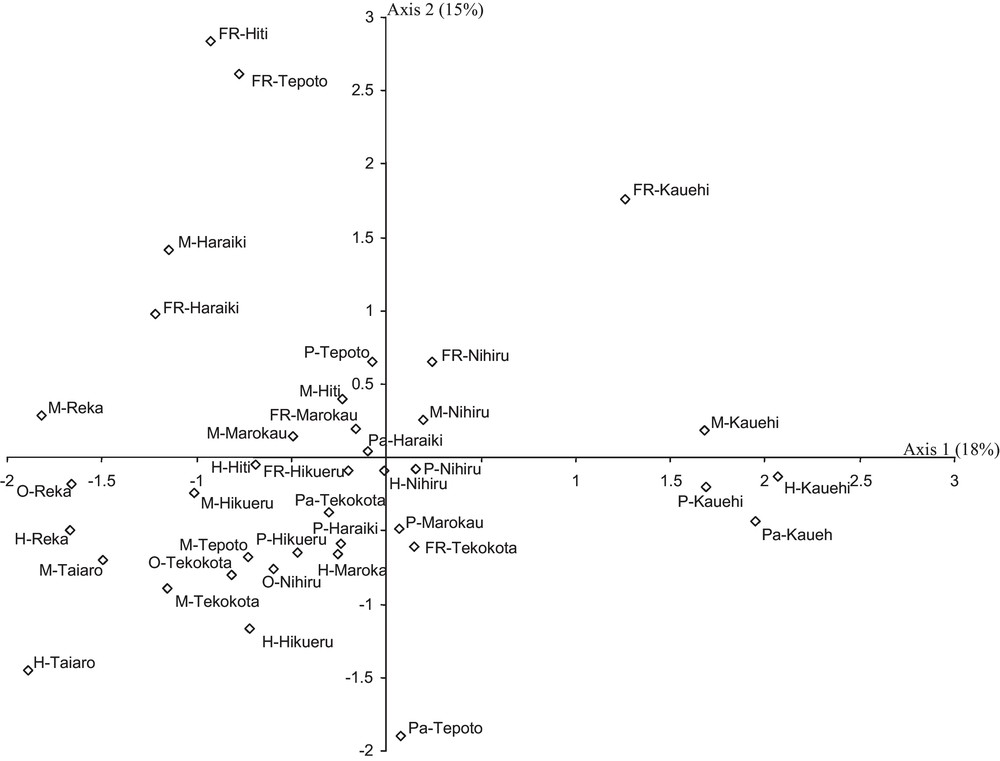
Correspondence analysis (CA) showing the spatial repartition of fish species richness among biotopes of each atoll. Plots of the CA show ordination along the first two axes (the inertia of each axis is given). The stations are coded by the abbreviation of biotopes (M: motu; H: hoa; FR: fringing reef; P: pinnacles; Pa: pass; O: closed brackish water pools) followed by the name of atolls.
The regression analysis with each habitat descriptor showed that percentage cover of rock accounted for the highest part of variation (28%) in species richness (Table 2). Other habitat descriptors accounting for a substantial amount of variation in species richness were percentage covers of boulders (19%), live coral (19%) and mud (18%). In contrast, the regression analysis with each geomorphologic descriptor showed that the length of submerged rim accounted for the highest part of variation (43%) in species richness, followed by lagoon area (36%), lagoon perimeter (35%), mean depth (35%) and atoll area (35%) (Table 2).
To explore the influence of habitat and geomorphologic descriptors on spatial variation of fish diversity among biotopes of each atoll, each descriptor was regressed in turn against values of S and H’.
| S | H’ | |||||
| R 2 | Sign | P | R 2 | Sign | P | |
| Habitat descriptors | ||||||
| Mud | 0.18 | − | *** | 0.16 | − | *** |
| Sand | 0.07 | − | ** | 0.03 | − | * |
| Gravel | 0.04 | − | * | |||
| Rubbles | ||||||
| Rock | 0.28 | + | *** | 0.26 | + | *** |
| Flagstone | ||||||
| Dead coral | 0.09 | + | *** | 0.10 | + | *** |
| Small boulders | 0.19 | + | *** | 0.07 | + | ** |
| Green algae | ||||||
| Brown algae | ||||||
| Live coral | 0.19 | + | *** | 0.09 | + | *** |
| Geomorphologic descriptors | ||||||
| Lagoon area | 0.36 | + | *** | 0.06 | + | ** |
| Atoll area | 0.35 | + | *** | 0.05 | + | ** |
| Crest area | 0.23 | + | *** | |||
| Motu area | 0.26 | + | *** | |||
| Mean depth | 0.35 | + | *** | 0.07 | + | ** |
| Atoll perimeter | 0.36 | + | *** | 0.05 | + | ** |
| Submerged rim | 0.43 | + | *** | 0.12 | + | *** |
| Level water exchange | 0.05 | + | ** | 0.13 | + | *** |
| % reef flat | 0.11 | + | *** | 0.02 | + | * |
| % hoa | 0.13 | − | *** | 0.07 | − | ** |
| % pass | 0.02 | + | * | |||
| Pass category | 0.03 | + | * | 0.06 | + | ** |
| Pinnacle category | 0.20 | + | *** | 0.08 | + | *** |
Stepwise multiple regression analyses were performed taking all geomorphologic and habitat descriptors together into consideration. The resulting model for S (once extracting the variability due to biotopes) included three geomorphologic descriptors (atoll perimeter, submerged rim and pinnacles) and two habitat descriptors (percentage cover of dead coral and sand) to account for 55% of total variation in S (Table 3). The resulting model for H’ (once extracting the variability due to biotopes) included two geomorphologic descriptors (mean depth and level of water exchange) and three habitat descriptors (percentage cover of mud, dead coral and gravel) to account for 43% of total variation in H’ (Table 3).
Results of stepwise regression analyses used to explain the observed variation of species richness S and Shannon-Wiener diversity index H’.
| P | R 2 | Model | ||
| Species richness S | ||||
| All descriptors | Raw | *** | 0.77 | Rock - Dead coral - Boulders - Green algae - Live coral + Submerged rim - Pinnacle |
| Res. | *** | 0.55 | Dead coral - Sand + Atoll perimeter - Submerged rim - Pinnacle | |
| Shannon-Wiener index H’ | ||||
| All descriptors | Raw | *** | 0.60 | Sand - Gravel - Rock - Dead coral - Green algae + Pass category |
| Res. | *** | 0.43 | Mud - Dead coral - Gravel + Mean depth - Level water exchange |
4 Discussion
Our results showed that nine environmental descriptors explained fish diversity patterns among the atolls. Willig [8] reviewed at least 30 hypotheses explaining the marine diversity at the island scale. In the present study, we focussed on the two main hypotheses: energy input [12] and habitat area [2] to explain the influence of the five geomorphologic descriptors (atoll perimeter, length of submerged rim, number of pinnacles, mean depth and level of water exchange) and the four habitat descriptors (percentage cover of dead coral, sand, mud and gravel).
The energy hypothesis refers to the amount of kinetic energy (i.e. temperature and some other times measured as productivity) and the proposed mechanisms are:
- • that increased temperature increase frequency of reproduction increasing the amount of mutations and chances of speciation;
- • that food increases abundance and abundance increases richness;
- • and that more species are likely to tolerate warmer environments than colder ones [12–15].
Even if we did not measure the sea surface temperature in each atoll (ranged of temperature between 27 and 29 °C according to the atolls, data available on: http://ferret.pmel.noaa.gov/NVODS/getUI.do), two geomorphologic descriptors (length of submerged reef and level of water exchange) could support the energy hypothesis. Indeed, the length of submerged reef rim and the level of water exchange represent the potential water exchanges between the lagoon and the ocean. A high influx of water in lagoons is likely associated with a high supply of available energy (plankton and nutrients) and a high number of recruits (larval colonization increases with the water influx) [16–18].
In contrast, the other geomorphologic descriptors and all habitat descriptors could support the area hypothesis. In the species richness-area hypothesis, an increase in the number of habitats leads to an increase in species diversity in a landscape because of an expansion in the number of partitionable niche dimensions [2,19,20]. In our study, the increase of atoll perimeter had a positive effect on species richness, suggesting that larger French Polynesian lagoons lead to more fish species. Similarly, the number of species was affected by the abundance of pinnacles. Pinnacles represent a particular habitat in atoll lagoons with a high structural complexity [21]. More complex habitats support greater niche diversification, reduce interference competition and stabilize predator-prey interactions and thus allow a higher number of species to coexist [22]. The level of habitat complexity also exerts an influence on diversity through microhabitat characteristics, like benthic coverage of dead coral, sand, mud and gravel. Thus, the four habitat descriptors played an important role in regression models, whereas they were not individually the most important in enhancing fish species richness (Tables 2 and 3). Thus, larger areas would have a higher probability of containing more habitat types; this increase in habitat diversity with area generates the species–area relationships because of species’ habitat associations [20,23].
To conclude, while the species–area and the species–energy relationships have been successfully studied for marine and terrestrial organisms [1,15,24], there is currently debate about their relative importance in explaining patterns of species richness [25]. In our study, the best models of variation in species richness and Shannon-Wiener index incorporated five geomorphologic descriptors and four habitat descriptors, which could be related to energy or area hypothesis [2,12]. Nevertheless, the remaining “unexplained” portion of the variation (23% of species richness and 40% of Shannon-Wiener index) could be attributable to pure spatial variation (the amount of spatial structuring in the species matrix), and/or variation due to other environmental and historical factors not measured in this study [8]. Overall, the present article provides an important contribution to the growing field of coral reef macroecology. Moreover, as many reefs in French Polynesia have recently changed to alternate states (coral to algal dominance) [26], a similar study conducted at present would allow to understand the influence of coral reef degradations on fish diversity patterns and on the importance of geomorphologic and habitat descriptors across time.
Disclosure of interest
The authors declare that they have no conflicts of interest concerning this article.
Acknowledgements
This study was carried out within the framework of the program ‘Typatoll’ (IRD, PNRCO, territoire de la Polynésie française). The assistance of the officers and crew of the RV “Alis” and the staff of Typatoll is gratefully acknowledged.