

1 Introduction
The term ancient DNA (aDNA) describes DNA fragments found in preserved or fossilized biological materials [1]. In the past, scientists believed that DNA degraded rapidly after death; so, aDNA was only considered as an “unusable curiosity” [2]. aDNA received great attention when scientific publications reported the sequencing of secular Egyptian mummy, or ancient wood, genetic elements [3,4]. These studies stimulated new archaeological research and the trust in aDNA potentialities. Fossil sample genetic analysis can provide, support and extend essential information about the human past, archaeological site interpretations and the development of higher level hypotheses [2]. Until now, aDNA researchers were less attracted by plant remains than animal or human ones. In reality, ancient botanical samples (seeds, pollen, wood and sometimes leaves) are very useful to study past plant use [5], agriculture, customs [6], diet [7], economy, migrations, trades, vegetation, biogeography, ecology [4] and even palaeoclimatology [8]. In particular, seeds and pollen are ideal sources for DNA because of their lignified or sturdy tegument that protects the nucleic acid from degradation, fragmentation and modification of original sequence information [6,9]. Usually, archaeobotanists try to reconstruct the past by vegetal remain morphological evidence. This type of analysis has many advantages: it is quick, technically simple and based on extensive reference collections for data interpretation [6]. Nevertheless, this approach has also some limits: the empiric interpretation and the influence of environmental conditions and genetic diversity on sample morphology [10,11]. In these cases, considerable new information and evident, accurate and scientific results may be obtained by genetic studies. DNA barcoding is a novel technology that uses a standard DNA sequence analysis for species identification [12–14]. An optimal DNA barcode is a small genetic region having invariable nucleotide sequence in all members of the same species but with sufficient divergence to discriminate among the species [15]. An useful barcode gene must possess:
- • elevated species-level genetic variability (discrimination);
- • conserved flanking sites for the construction of universal PCR primers for a large taxonomic application (universality);
- • short nucleotide sequence to facilitate its amplification (quality) [16].
The mitochondrial cytochrome c oxidase subunit-1 (CO1) gene is considered the best genetic region in animal barcoding, but it is not applicable to plants, because of a much slower rate of evolution than in animals [17]. The selection of a vegetal universal barcode was not so simple. A general agreement determined that it must include more than one genetic region belonging to the plastidial genome [18]. Different sequences have been suggested as plant DNA barcodes; recently, researchers proposed the combined analysis of the following genes, as a standardized protocol to barcode all land plants: ribulose 1,5-bisphosphate carboxylase/oxygenase large subunit (RuBisCO large subunit, rbcL) gene + maturase K (matK) gene + intragenic spacer between tRNAHisGUG gene and photosystem II thylakoid membrane protein of Mr 32,000 gene (trnH-psbA) [18–21]. The object of this research was the application of the DNA barcode technique for the identification of botanical species found in Palo Montano archaeological cave, near the town of Jenne (Rome, Latium, Central Italy) (Fig. 1A). The site, called “Mora Cavorso”, opens to 720 m a.s.l. and is formed by a succession of rooms and ducts (Fig. 1B) [22,23]. Two radiometric datings (on human bone, 6405 ± 35 years BP, calibrated 5472–5314 BC 1σ), (on a charcoal fragment, 6275 ± 45 years BP, calibrated 5322–5084 BC 1σ) dated the cave to the early Neolithic. This work focused on taxonomic classification of “Mora Cavorso” ancient seeds, to facilitate historical interpretation of the Italian Neolithic population life, but it also supported DNA barcode application as approach, rarely used before, for vegetal fossil study.
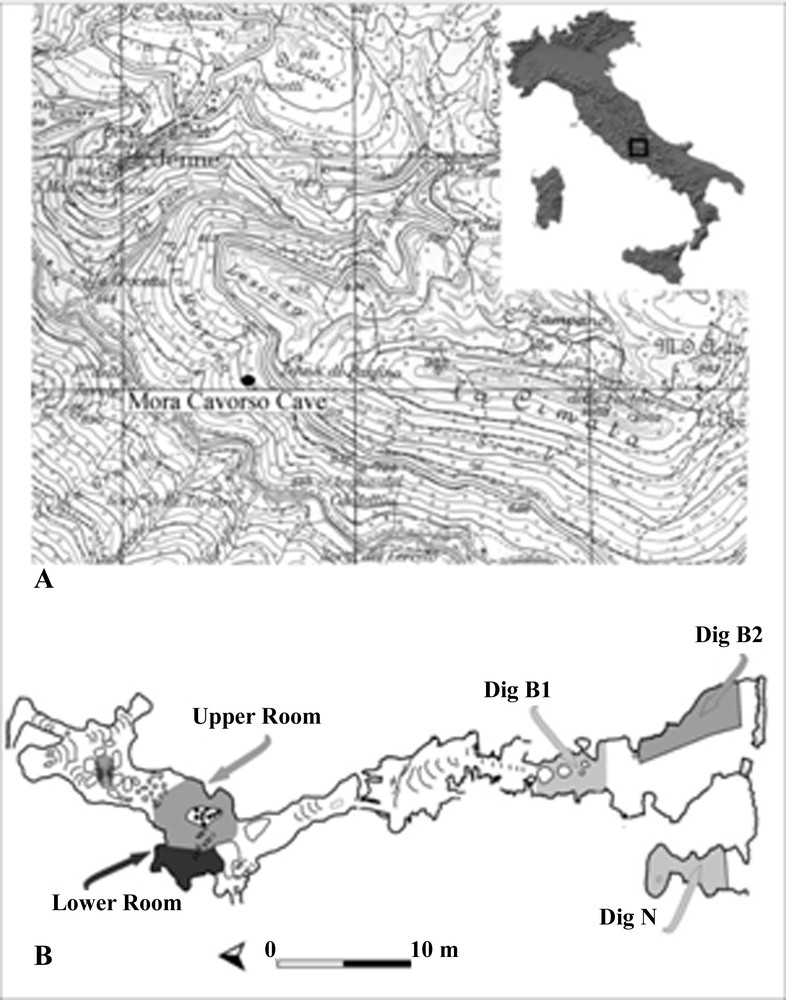
“Mora Cavorso” cave. A. The archaeological site was found in Palo Montano locality, near the town of Jenne (Rome, Latium, Central Italy). B. Map of the cave: ducts and rooms are indicated with a specific name.
Rolfo et al., 2009, 2010 [22,23].
2 Methods
2.1 Excavation and external cleaning of remains
Seeds, kindly provided by Dr. Mario Rolfo (Department of History, University of Rome “Tor Vergata”), were found directly in the excavation sites. Researchers took care to prevent environment and human contamination of samples. They were dry sifted, decontaminated by UV-light treatment and then stored cold, to slow further aDNA degradation [24,25].
2.2 Morphological description
Sample detailed morphological documentation was necessary as genetic investigations required the destruction of remains. We photographed seeds with a Fujifilm Finepix S1000fd and then also with a scanning electron microscope (SEM) Leika/LEO stereoscan 440 (18–20 × enlargement).
2.3 DNA extraction
At present, there are no preferred DNA extraction methods for ancient plant material, nor is there any comprehensive comparison of protocols, such as exists for animals [26]. aDNA was extracted according to a laboratory manual [27] modified method. Briefly, seeds were ground to fine powder in a Laboratory Blender Waring Commercial grinder and then further powdered with pestle, mortar and liquid nitrogen. Samples (0.2 g) were transferred to a 2 mL Eppendorf tube and 0.8 mL of extraction buffer (10 mM Tris-HCl pH 8; 100 mM EDTA pH 8; 0.5% SDS; 20 μg/mL Ribonuclease A, RNase Sigma-Aldrich) was added. After incubation at 37 °C for 1 hour, proteinase K (100 μg/mL, Sigma-Aldrich) was added and samples were re-incubated at 37 °C for 3 hours. 0.8 mL of cold phenol:chloroform (1:1, pH 8) was added to each sample; then, tubes were mixed by gentle inversion and centrifuged at 12,000 rpm/min for 5 min at 4 °C. Supernatants were transferred to new tubes including 0.4 mL of CTAB solution (35 mM cetyl trimethylammonium bromide; 100 mM NaCl). Samples were incubated at room temperature for 1 hour in agitation; then, two extractions with a volume of phenol:chloroform (1:1; pH 8), as before, and an extraction with a volume of chloroform were performed. The aqueous phase of each sample was collected into a new tube including 100 μL of 2 M NaCl and 1 mL of cold 2-propanol. Samples were incubated at –80 °C over night and then centrifuged at 12.000 rpm/min for 30 min at 4 °C. Supernatants were discarded and pellets were resuspended in 50 μL of TE buffer (10 mM Tris-HCl pH 8; 1 mM EDTA pH 8). 40 μg RNase A was further added to samples and a final incubation at 37 °C for 20 min was performed. All samples were stored at –20 °C.
2.4 Spectrophotometric analysis
DNA quality and concentration in samples were determined by spectrophotometric analysis; the optical density of each sample of DNA was determined at 230, 260 and 280 nm.
2.5 PCR amplification and gel electrophoresis
PCR-based amplification of the purified aDNA was carried out in a 50 μL reaction mixture; it contained: 50–200 ng template aDNA, 2.5 U JumpStart REDAccu Taq LA DNA Polymerase (for high fidelity PCR, Sigma-Aldrich), 20 μM of each primers (below described, Sigma-Aldrich), 0.2 mM each dNTP (Sigma-Aldrich), 1X Taq LA DNA Polymerase buffer (Sigma-Aldrich), 3 mM MgCl2 and 5% DMSO. Amplification of the DNA was done using a Biorad (ICycler) thermocycler with following parameters:
- • initial denaturation at 95 °C for 4 min;
- • 50 cycles of denaturation at 95 °C for 1 min, primer annealing at the adequate temperature for each primer pair (below described) for 1 min and extension at 68 °C for 2 min;
- • final extension at 68 °C for 15 min.
The reaction was stored at 4 °C. Chosen barcode genes were: rbcL, matK and trnH-psbA. Primers are described, in detail (name, target gene, amplified region, sequence, melting temperature used in PCR assay, references), in Table 1. For each barcode gene we decided to analyze three nucleotide sequences, as shown in Fig. 2: region 1; region 2 consequent and overlapped with region 1; region 1 + 2 the whole considered sequence. PCR products were fractionated on 1% agarose gel using 1X TAE buffer (40 mM Tris; 1 mM EDTA; 20 mM acetic acid; pH 8.5) containing 10 mg/mL ethidium bromide and were visualized and photographed under UV-light (Gel Doc 2000 Biorad).
Primer pair names (F: forward; R: reverse), their sequences, target gene and size (in base pairs) of amplified regions and Tm (°C) used in PCRs.
| Primer pair name | Sequence* (5′-3′) | Target gene | Amplified region (BP) | Tm °C |
| rbcL F1 | ATGTCACCACAAACAGAGACT | rbcL | Region 1 (120) | 57.6 |
| rbcL R1 | GAATGCTGCCAAGATATCAGT | |||
| rbcL F2 | ATTATACTCCTGAATACGAAA | rbcL | Region 2 (130) | 54 |
| rbcL R2 | TGTCCATGTACCAGTAGAAGA | |||
| rbcL F1 | ATGTCACCACAAACAGAGACT | rbcL | Region 1 + 2 (201) | 52 |
| rbcL R2 | TGTCCATGTACCAGTAGAAGA | |||
| matK F1 | GTTCTAGCACAAGAAAGTCGA | matK | Region 1 (128) | 52.2 |
| matK R1 | CTCAGATTATGATATTATTGA | |||
| matK F2 | TGCATATACGCCCAAATCGAT | matK | Region 2 (129) | 54 |
| matK R2 | CCAATTATTCCTCTGATTGGA | |||
| matK F1 | GTTCTAGCACAAGAAAGTCGA | matK | Region 1 + 2 (217) | 56.4 |
| matK R2 | CCAATTATTCCTCTGATTGGA | |||
| trnH-psbA F1 | ATAAAGGAGCAATAACGCCCT | trnH-psbA | Region 1 (120) | 60 |
| trnH-psbA R1 | CGAAGTTCCATCTACAAATGG | |||
| trnH-psbA F2 | GGTAATGTAACGAATAAAAGT | trnH-psbA | Region 2 (120) | 52 |
| trnH-psbA R2 | GAGCAATAAACTCTTTCTTGT | |||
| trnH-psbA F1 | ATAAAGGAGCAATAACGCCCT | trnH-psbA | Region 1 + 2 (190) | 60 |
| trnH-psbA R2 | GAGCAATAAACTCTTTCTTGT |
* References: [17,19,20].
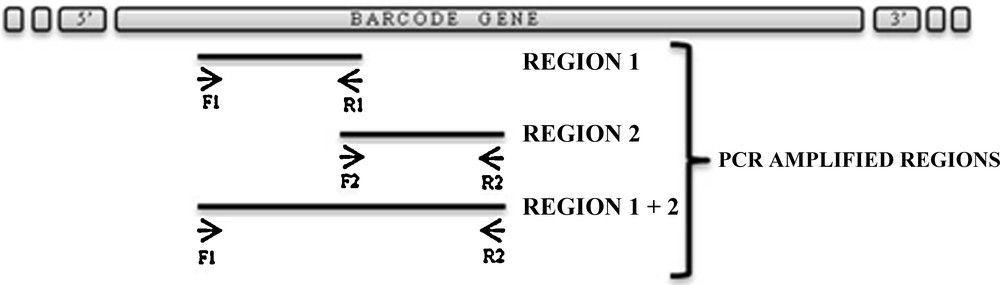
Standard representation of PCR amplified regions (1; 2 and 1 + 2) of barcode genes.
2.6 Sequencing and data analysis
PCR products (3 μL) were treated with ExoSAP-IT (Afflymetrix) for 15 min at 37 °C, to remove unused primers and nucleotides. 1.5 μL of BigDye (Applied Biosystems) and 1.5 μL of forward primer were added to samples. Then, they were subjected to PCR (25 cycles of denaturation at 96 °C for 10 sec, annealing 50 °C for 5 sec and final extension at 64 °C for 4 min). DNA was precipitated in samples by adding 50 μL of 95% ethanol and 2 μL of 3 M Sodium Acetate pH 5.2. After incubation at room temperature for 15 min, samples were centrifuged for 30 min at 2500 rpm/min. Pellets were resuspended in 150 μL of 70% ethanol and then centrifuged for 10 min at 13,000 rpm/min. Finally, DNA was resuspended in 20 μL of 100% formamide. Sequencing analysis was performed using 3100 Avant Genetic Analyzer (HITACHI, Applied Biosystem). Obtained aDNA nucleotide sequences were compared with known sequences present in scientific databases, such as GenBank/EMBL/nucleotide, and matched with Nucleotide Basic Local Alignment Search Tool program (BLAST, blastn, http://blast.ncbi.nlm.nih.gov/Blast). Simplification of species lists for each sample was supported by morphological comparison with modern seeds (dimension, shape and surface), possible geographical distribution, scientific/historical literature data, high value of nucleotide sequence max identity between subject and query and, in particular, by the intersection of result lists obtained from the same sample.
3 Results and discussion
In this research, vegetal remains (seven seeds), found in the “Mora Cavorso” archaeological site (locality Palo Montano, Rome, Latium, Central Italy) (Fig. 1A), were identified and classified to increase knowledge about Central Italy past populations by DNA barcode method. This work wanted also to encourage and stimulate this approach for archaeobotanical taxonomic identification. Ancient seeds were found in three different places of the site; so, they were named according to their location in the cave. A single seed, excavated in the upper room of the cave, was called X sample; three seeds, called X2 samples, were found in the dig B2 and three other seeds (named X3 samples) in the dig N (Fig. 1B) [23,24]. Samples were analyzed by morphological studies and DNA barcode technique. Morphological analysis consisted in the study of seed size and shape: at first, samples were documented with photos (Fig. 3). Morphological observations showed no particular features on seed structures. Only X2 samples showed macroscopic differences: two of them presented a wrinkled surface with respect to the third one that had a smooth tegument. So, for further analysis, we decided to study separately wrinkled surface seeds (that we called Z sample) with respect to the smooth surface one (named Y sample). As X3 samples were all alike, we decided to study only one of them (we called K sample) (Table 2). Ancient seeds were morphologically very similar: on average, they measured 0.7–1 cm in length and 0.3–0.6 cm in width. Seeds were also studied by light and SEM microscopes. These analyses did not indicate us the presence of characteristic microscopic features on seeds; tegument cells were compact and constituted an irregular surface, determining seed mechanical resistance (Fig. 4). These subjective, restrictive and not very informative data suggested to us to support the morphological analysis with a molecular approach. aDNA was successfully extracted from all seeds. Y and Z DNAs, analyzed on 1% agarose gel, showed a smear probably because they were more degraded than X and K samples (Fig. 5). To identify seed botanical species, aDNAs were used as templates to amplify specific genes, selected and standardized to barcode all land plants (rbcL; matK; trnH-psbA) [18–21]. DNA barcode is generally a sensitive, simple and reproducible technique that is able to provide results even in presence of scarce amounts of template. Problems associated with aDNA study can be alteration and degradation of DNA molecules over time, by physical and chemical agents [28,29]. Because aDNA is sometimes deteriorated and fragmented, PCR target region sizes should be between 80 and 300 bp [6]. Therefore, each barcode gene was amplified in short portions of 120–200 bp (Fig. 2 and Table 1). All PCR products were verified in size (Fig. 6). Probably because aDNAs were too much degraded in chosen regions, not all amplification reactions resulted positive (Table 3). We excluded the presence of PCR inhibitory elements in aDNA extracts because in some cases the same extracts were successful. K sample proved to be very difficult: we could analyze only one rbcL barcode gene region (Table 3). The concept of aDNA contamination refers to modern DNA molecules, which could be indiscriminately amplified by PCR. Essentially the major contaminator is the researcher, who excavates or analyzes samples, but for vegetal aDNA studies human DNA should not be considered a contamination source if PCR primers are carefully chosen. However, to prevent contaminations, as recommended [28,30–32], we observed the following devices:
- • a dedicated aDNA laboratory was used to extract DNA from ancient plant samples (no modern DNA has never been processed in the same place);
- • PCR amplifications were conducted in a physically separated laboratory;
- • each PCR amplification and sequencing analysis was repeated, at least, three times (also using different PCR thermocyclers situated in separated laboratories);
- • instruments were subjected to UV irradiation, washing and other decontamination procedures after their use;
- • positive controls were avoided, as they could provide a contamination risk, instead of negative ones that are always performed.
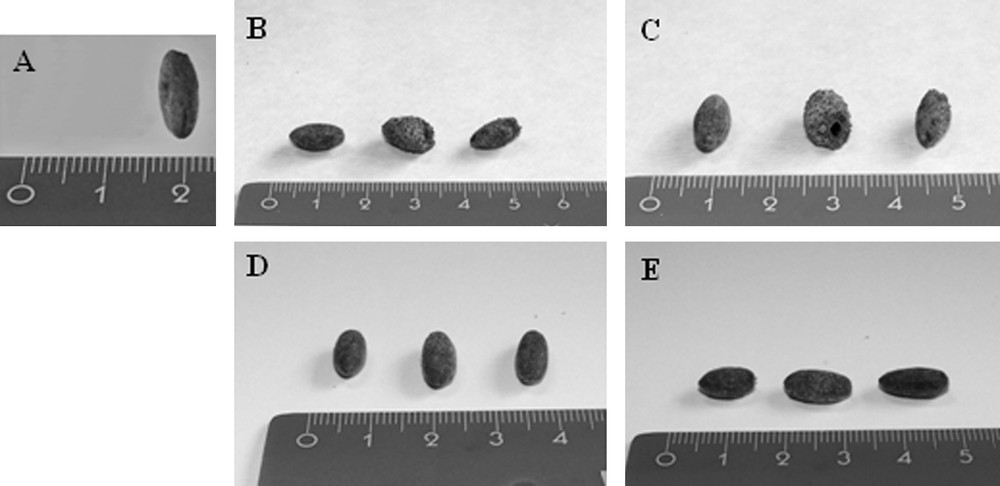
Ancient seeds were documented with photos for morphological studies. A. X sample (lateral profile). B. X2 samples (frontal profiles). C. X2 samples (lateral profiles). D. X3 samples (frontal profiles). E. X3 samples (lateral profiles).
The name of plant seed remains is reported in table with their localization in the cave, amount and representative analyzed sample name of the analyzed samples.
| Excavated sample name | Localization in the cave | Seed No. | Analyzed sample name |
| X | Upper room | 1 | X |
| X2 | Dig B2 | 3 | Y (smooth) |
| Z (wrinkled) | |||
| X3 | Dig N | 3 | K |
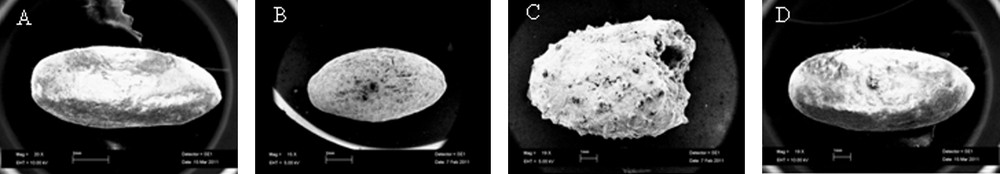
SEM observations of ancient seeds (18–20 × enlargement). A. X sample. B. Y sample. C. Z sample. D. K sample.
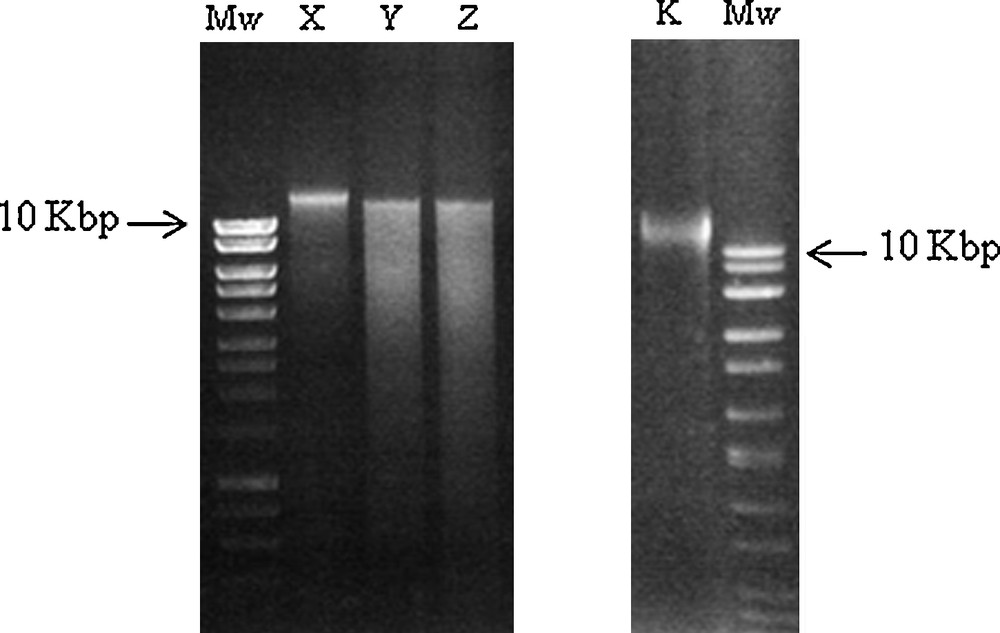
aDNA extracted from seeds was visualized by UV-light after separation on 1% agarose gel (Mw: molecular weight). A. X, Y and Z samples. B. K sample.
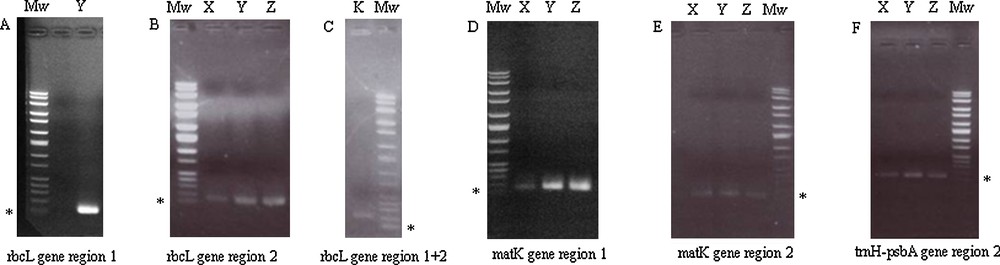
PCR positive amplifications were detected by UV-light after migration on 1% agarose gels (Mw: Molecular weight; * = 100 base pairs). A. PCR products of rbcL gene region 1 of Y sample. B. Amplifications of rbcL gene region 2 of X, Y and Z samples. C. PCR amplification of rbcL gene region 1 + 2 of K aDNA. D. PCR products of matK gene region 1 of X, Y and Z samples. E. PCR products of matK gene region 2 of X, Y and Z samples. F. Amplifications of trnH-psbA gene region 2 of X, Y and Z aDNA.
PCR amplification results.
| Seed aDNA sample | Barcode gene (PCR target region) |
||||||||
| rbcL | matK | trnH-psbA | |||||||
| (1) | (2) | (1 + 2) | (1) | (2) | (1 + 2) | (1) | (2) | (1 + 2) | |
| X | − | + | − | + | + | − | − | + | − |
| Y | + | + | − | + | + | − | − | + | − |
| Z | − | + | − | + | + | − | − | + | − |
| K | − | − | + | − | − | − | − | − | − |
Using these advices, no contamination was detected. The whole process was labor-intensive and time-consuming. Positive PCR products were sequenced and compared with plant DNA sequence databases to obtain species lists that showed high nucleotide similarity with seed aDNAs (Supplemental Table 1). These results were simplified excluding species that could not be compatible with samples for morphological comparison (dimension, shape and surface), possible geographical distribution, scientific/historical literature data [33–38] and too much low nucleotide sequence maximum identity between subjects. Finally, the intersection between result lists, obtained from the analysis of different barcode genes of the same seed, permitted to individuate sample botanical species. Final outcomes showed that “Mora Cavorso” fossil remains could be classified as two different plant species seeds: Olea europaea L. for X, Y and Z samples and Cornus mas L. for K sample. We have left historical interpretation of the presence of these seeds to specialists: we could only suppose that identified seed relative fruits were probably used as food or funeral offerings. This work permitted the botanical classification of “Mora Cavorso” ancient seeds but it also demonstrated the importance of the DNA barcode technique, with respect to morphological approach, usually not completely informative, for archaeobotanical sample scientific identification. In fact, Y and Z samples that, by morphological analysis, seemed belonging to two different species in reality were both Olea europaea L. rests; Z sample wrinkled surface would be probably due to time degradation, atmospheric agents or animal action.
Disclosure of interest
The authors have not supplied their declaration of conflict of interest.
Acknowledgments
This work has been carried out by PRIN 2008 grant N° 2008B4J2HS.