

1 Introduction
Influenza A virus infection continues to be a major public health threat to human society and animals. In 1997, an outbreak of highly pathogenic avian influenza A (H5N1) spread from poultry to human in Hong Kong, resulting in 18 infected people and six deaths [1], and reemerged in 2003, causing two similar cases with one fatality [2]. As human exposure to and infection with H5N1 viruses continue to increase, so too does the likelihood of the generation of an avian-human reassortant virus that may be transmitted efficiently to the global human population, which currently lacks H5N1-specific immunity. Consequently, H5N1 viruses could be strong candidates for causing the next influenza pandemic [3].
As widely recognized, zoonotic infectious diseases are inextricably linked to their surrounding environment [4–7]. The understanding of viruses’ spatiotemporal spreading patterns is a fundamental component to assess human risk for zoonotic diseases [8]. The previous reports [4,9] indicated that a number of landscape features are closely associated with the transmission of zoonotic diseases. In particular, climate, water, and landscape patterns are important triggering factors [4,10]. A more precise understanding of the landscape features distribution of influenza virus would contribute to the recognition of virus spreading tendency and risk assessment [4,9–13].
To our knowledge, there are two basic elements in explaining the global outbreak patterns of H5N1avian influenza virus: anthropogenic and natural elements. The anthropogenic element includes all events related to human activities, for example, global human migration and traveling, international poultry trade [14], and so on. The natural element is mainly composed of bird migration and environmental stimuli, corresponding to the migration model and the latency model proposed by a previous study [15]. In the latency model, virus isolates keep constant in outbreak locations and become infectious when climatic adaptation exists. However, in the migration model, virus isolates were transmitted through global avian migration. Bird migration related to global H5N1 outbreak has been well documented, and the seasonal patterns of human influenza in temperate regions have been reported [16]. However, little attention has been paid to ecological aspects of H5N1 infection in the world. More importantly, the question has not been seriously addressed: which element, natural or anthropogenic, is more important in explaining the global outbreak of H5N1? Based on the available global data sets, we believe this problem can be approached through multivariate analysis techniques.
In this paper, we tested whether ecoregions (we name “ecoregions hypothesis” hereafter) could interpret global patterns of H5N1 distribution [17]. The previous study [17] proposed that ecoregions could explain the outbreak dominance zones of H5N1 worldwide. Accordingly, they suggested that some important ecoregions could be used to predict the outbreak of H5N1. Because their conclusion of H5N1-related ecoregions is only based on individual outbreak observations, we introduced ecological niche modeling [9], which will significantly improve the quality in finding suitable areas closely correlated to H5N1 occurrence, to model the compatible environmental envelope [10] and preferentially suitable areas [9]. In comparison with the predicted suitable range and the proposed ecogeographic regions, we could identify the adequacy of ecoregions hypothesis. To run ecological niche modeling, we used multiple regression analysis [18] and BioClim [19] as the methods to predict the risking hotspots for H5N1 at global scale. By gathering the outbreak information of H5N1 during 2003 and 2007 around the world, we will make attempts to:
- • find out the potential outbreak hotspots using ecological niche modeling to test the ecoregions hypothesis;
- • understand the important variables and reconcile the effects of natural and human elements in regulating the global outbreak of H5N1;
- • predict the potential spreading dynamic based on a niche presentation of H5N1.
The threefold analysis provides a consecutive recognition of H5N1 spatial characteristics from an ecological perspective [20]. In a word, our study might provide further evidences to the current ongoing epidemiologic and ecological studies of avian influenza [21], as well as help launch public health intervention strategies to highest-risk areas for H5N1.
2 Materials and methods
2.1 Data sets
The worldwide occurrence cases of H5N1 between November 2003 and March 2007 were derived from the database constructed by Declan Butler for Google Earth (http://declanbutler.info/Flumaps1/avianflu.html), who had collected all the real-time data from WHO website (http://www.who.int). Each outbreak case has been georeferenced to input into the geographic information system. Because the data of Declan Butler is in the format of KML, we extracted the geographic coordinates for each outbreak case using Visual Basic for Excel (Microsoft, http://www.microsoft.com/). The software ArcView (ESRI Inc., http://www.esri.com/) was used to map global H5N1 outbreak cases.
We used two groups of variables to predict H5N1 distribution, which has not been effectively integrated in previous works and can well correspond to the two basic elements of H5N1 distribution as discussed above: environmental and socioeconomic variables. In general, environmental variables used denoted abiotic factors, reflecting natural element of H5N1 outbreak. For example, climatic and topographic factors can be classified as abiotic factors. The socioeconomic variables used principally denoted the biotic and anthropogenic ones. This variable group reflects the anthropogenic element of H5N1 outbreak: for example, human population density, global vegetation, etc. We downloaded these two groups of variables from different resources as mentioned below:
- • the environmental variables were extracted from WorldClim (http://www.worldclim.org/) database. In sum, eight representative variables [9] were used as the environmental variables explaining the distribution of H5N1, which were average elevation, annual average temperature, annual minimal temperature, annual maximal temperature, precipitation, evaporation, radiation and absolute humidity;
- • for socioeconomic variables, the six typical ones were human population density, human built-up land density, cropland density, livestock population density (mainly denotes these typical ungulates: sheep, goat and pig), poultry population density (mainly denotes chicken) and vegetation type;
- • world livestock distribution information was obtained from the Food and Agriculture Organization of the United Nations (FAO) [22]. Data related to the global vegetation layer were collected form the Atlas of the Biosphere (http://www.sage.wisc.edu/atlas/). Worldwide human population density and built-up land density were downloaded from Gridded Population of the World Version 3 (Center for International Earth Science Information Network, Columbia University; http://sedac.ciesin.columbia.edu/gpw).
All data were standardized prior to analysis using software Statistica version 6.0 (http://www.statsoft.com/).
3 Methods
To predict the potential distribution of H5N1, we developed a two-step prediction procedure. The first step consists in selecting potential suitable areas. This is done by BioClim algorithm using software OpenModeler (http://openmodeller.sourceforge.net/). The second step is to refine the risking classification of all the candidate areas using multiple regression analysis (MAR), which is performed using Statistica version 6.0 (http://www.statsoft.com/). BioClim is a simple environmental envelope algorithm that identifies locations that have environmental values that fall within the range of values measured from the occurrence dataset [19,23]. The advantage of BioClim algorithm is the fact that it generates the potential suitable areas at a fast speed. MAR is a discriminative probabilistic classification model that operates over real-valued variables. It makes use of predictor variables that may be either numerical or categorical. MAR was used to refine the prediction based on the output of BioClim model (only the areas with predicted probability = 1 are considered). MAR was implemented considering spatial autocorrelation by forcing an additional covariate, termed autoregressive term, into the MAR model [18]. This autoregressive term accounts for spatial dependency in the response variable and is estimated by averaging the presence/absence among a set of neighbors defined by the limit of autocorrelation, weighted by the inverse of the Euclidean distance [24]. The purpose of the two-step prediction procedure is to eliminate the influence of unimportant areas to the prediction power of MAR. The first step is to retain those areas with high correlation with response variables and guarantee the power of MAR [18]. To evaluate the validation of the model performance, we employed the areas under the curve (AUC) of the receiver-operating characteristic (ROC).
To identify the contribution of environmental and socioeconomic factors to the global distribution of H5N1, we performed a principal component analysis (PCA) using R software [25]. PCA is effective and robust in the identification of dominant variables [26].
In the two-dimensional visualization of suitable niches for H5N1 [27], for each environmental attribute, a t test for two independent samples was applied to detect whether there was a significant difference between the observed outbreak locations and the predicted suitable sites; the predicted sites were derived from BioClim output.
4 Results
The global outbreak cases during November 2003 and March 2007 are displayed in Fig. 1A, while the outbreak hotspots (or areas with high risking probabilities) based on MAR model are showed in Fig. 1B. The model performance is very good based on the high AUC value of the ROC curve (AUC = 0.955). The outbreak hotspots were mainly located in southern Europe, East Asia and Middle Africa. These risk hotspots corresponded mostly to the ecoregions proposed in Sengupta et al. (2007). However, some additional ecoregions have been overlooked in Sengupta et al. (2007), but identified in our modeling. These regions were principally located in Latin America and South America, where there are no outbreak records but where there is a high likelihood of the H5N1 risk (Fig. 1B).
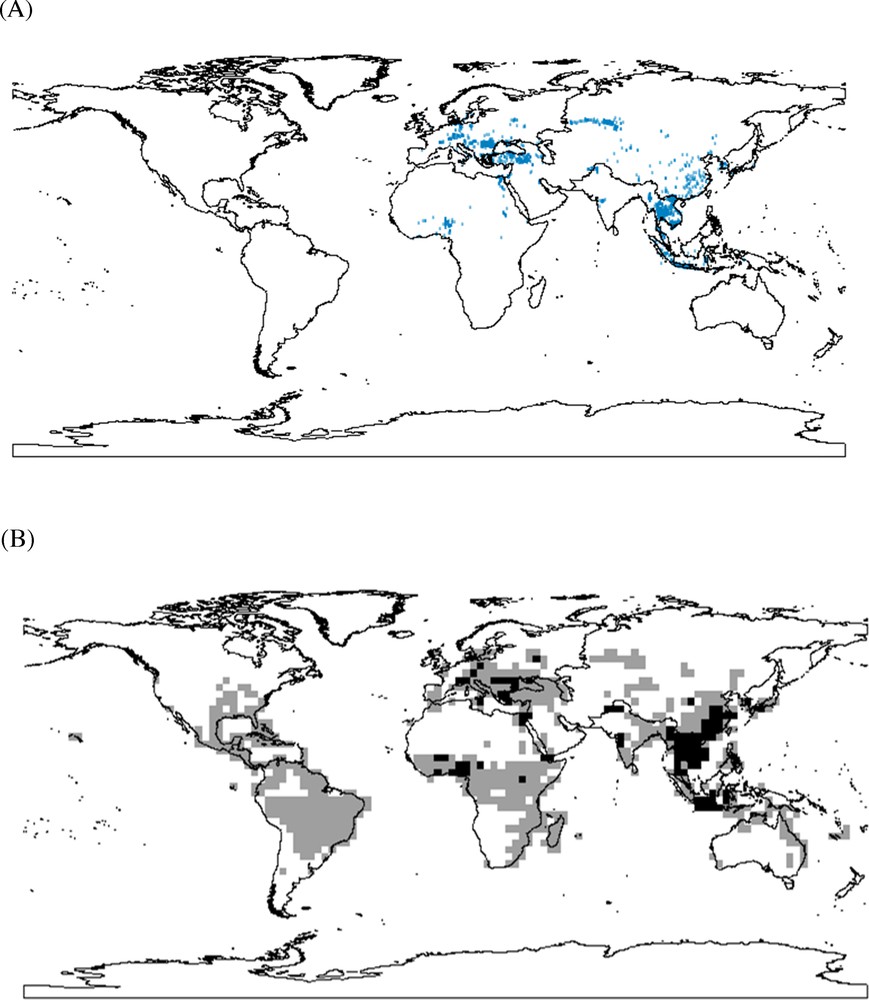
(A) (Color online). Outbreak records of H5N1 during November 2003 and March 2007. (B) Predicted global distribution of H5N1 using multiple-variable autologistic regression analysis on the basis of BioClim output. (Colors from light grey to black represent the risking probabilities from low to high).
Results from PCA are displayed in Table 1. The first four axes (axes 1, 2, 3, and 4) explained 70.20% of the total variance. In axis 1, the most important factor was evaporation, followed by annual minimal temperature and annual average temperature. Axis 1 mainly characterized the thermal gradient of H5N1 outbreak, while in axis 2, the pivotal factor was humidity, which characterized the water gradient of the outbreak. The most influencing factors for axis 3 and 4 were human population density and livestock density, respectively, reflecting the anthropogenic impact of H5N1 outbreak.
PCA resulting reports, including the eigenvalues for the four axes and the related variable loadings.
| Axis 1 | Axis 2 | Axis 3 | Axis 4 | |
| Items | ||||
| Eigenvalues | 5.203 | 1.74 | 1.471 | 1.414 |
| Percentage | 37.165 | 12.428 | 10.508 | 10.097 |
| Cumulated percentage | 37.165 | 49.593 | 60.101 | 70.198 |
| PCA variable loadings | ||||
| Radiation | –0.072 | 0.556 | 0.026 | 0.134 |
| Elevation | 0.178 | 0.151 | –0.112 | 0.183 |
| Annual maximal temperature | –0.404 | 0.26 | –0.034 | –0.038 |
| Annual minimal temperature | –0.421 | 0.163 | –0.02 | –0.027 |
| Annual average precipitation | –0.365 | –0.251 | –0.081 | 0.068 |
| Annual average temperature | –0.416 | 0.213 | –0.027 | –0.032 |
| Evaporation | –0.428 | 0.014 | –0.042 | –0.041 |
| Humidity | –0.137 | –0.596 | –0.026 | 0.11 |
| Human population density | –0.077 | –0.042 | 0.614 | –0.251 |
| Human built-up land density | 0.009 | 0.006 | 0.604 | –0.368 |
| Cropland density | –0.052 | –0.09 | 0.002 | –0.171 |
| Poultry population density | –0.168 | –0.102 | 0.319 | 0.521 |
| Livestock population density | –0.042 | –0.033 | 0.321 | 0.63 |
| Vegetation type | 0.276 | 0.297 | 0.169 | 0.175 |
We presented the visualization of suitable niches for H5N1 in Fig. 2. Only the two most important environmental variables were present. The points of current occurrence were principally located within the boundary of predicted occurrences. The t-test for independence indicated that there was a significant difference between the observed (mean = 177.17, SD = 84.17) and predicted points (Mean = 162.14, SD = 69.05) along the gradient of evaporation (P < 0.005). However, along the gradient of humidity, the difference between the observed (mean = 114.68, SD = 36.62) and predicted points (mean = 112.50, SD = 37.41) is not significant (P = 0.22). This visualization illustrated that the potential transmission trend around the world of H5N1 will probably shift to areas with lower evaporation, which are generally cold-temperature areas (low temperatures could decrease evaporation), for example, much of Europe, northern Asia, and so on.
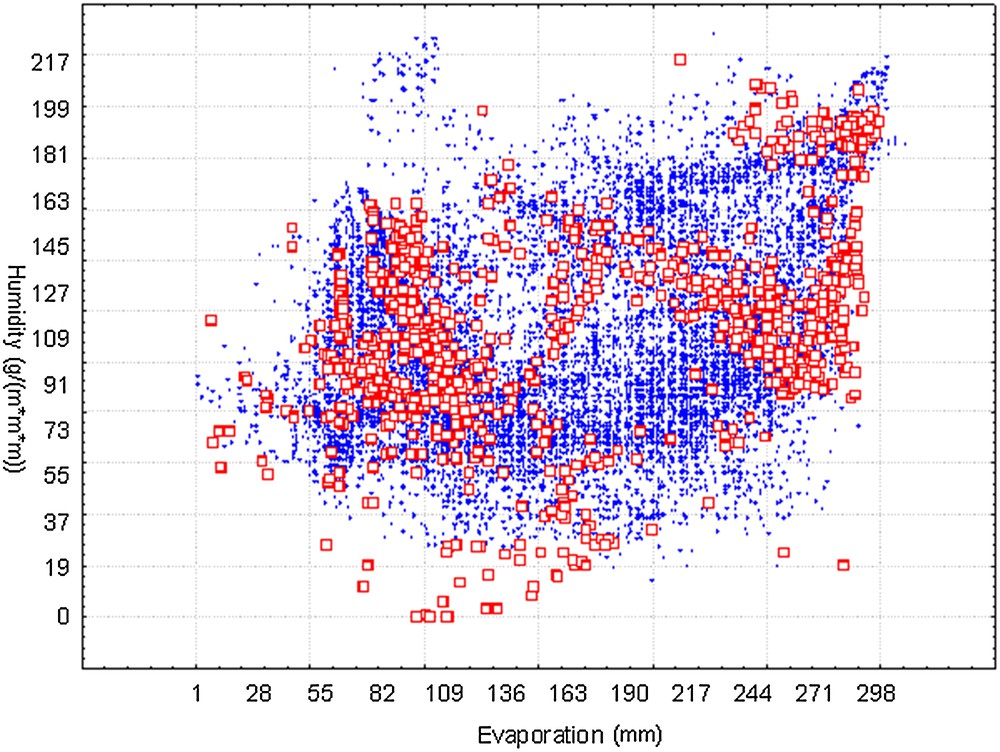
(Color online). Visualization of suitable ecological niches from BioClim model (X, Y axes represent the most influencing factors evaporation and humidity from axes 1 and 2, respectively). Dots denote the randomly selected 60,000 predicted suitable areas, while squares denote the outbreak cases.
5 Discussion
We present the global map of the risk of H5N1 outbreak in this contribution. We have addressed these following issues and provided new evidences relevant to the epidemiology of H5N1 transmission: the testing of ecoregions hypothesis; the outbreak hotspots’ identification based on species distribution modeling; the presentation of niche differentiation of H5N1 in the spreading process; the importance of combining environmental and socioeconomic variables in building prediction models.
Ecological niche modeling has identified the most preferential areas for virus transmission and outbreak [27,28]. Most of these areas correspond to the ecoregions proposed in the previous study [17]. Such outbreak hotspots have the highest probability of avian influenza risk; therefore, through a simple comparison, we could conclude that the ecoregion hypothesis should be able to explain its global spreading.
Geographical information systems have become a ripe technique in mapping and managing global diseases and vectors [4,8,11,29–31]. It provides a direct view of the transmission of virus vectors through distribution mapping [27]. Meanwhile, ecological niche modeling for predicting potential risks posed by the viruses is gaining increasing attention [4,9,26]. The available data, the various mathematical approaches, and the ecological theories make ecological niche modeling become a more robust means for interpreting ecological patterns of infectious viruses at the spatial scale [9].
BioClim model is very conservative compared to other modeling techniques [32], although it is likely to fail when modeling the impact of climate change on species’ distribution [33,34]. Moreover, BioClim model is simple to implement and the mathematical basis is very easy to understand [34]. BioClim algorithm is one of the most common ones that have been used in the course of history and in current time when modeling species’ potential distributions [34,35]. It consists simply in comparing the values of the environmental variables across all the locations to the ones where the species is present. The more similar the values are, the more suitable the location is [34]. These are the reasons why we preferentially selected its output for niche visualization of H5N1. Multiple-variable autologistic regression analysis is gaining increasing attention in H5N1 distribution modeling [18,36]. We integrated these two algorithms into the prediction model to form a two-step prediction process, which has the merit of reducing the influence of irrelevant areas and enhancing the power of MAR. Because the predicted map of BioClim algorithm is conservative, the retained candidate sites (with probability = 1) are certainly correlated with the response variables. The power of MAR considering spatial autocorrelation is thereby assured.
Another problem may be the selection of variables for modeling [37]. Some studies also emphasized the essence of biotic interaction in explaining the distribution range [38–40]. However, the degree of this interconnection is still ambiguous up to date [41]. Considering the available data and the objective of our study, we did not include biotic interaction in the modeling. Besides, the dubiety of the choice of modeling techniques is negligible to some extent. In some works [42], it has been revealed that the disparities among the results generated using different modeling approaches were not remarkably significant.
The previous study, concerning Southeast Asia [18], identified the most influencing socioeconomic factors associated with H5N1 outbreak, including duck abundance, human population and rice cropping intensity. They did not involve abiotic variables as predictors, which might lead to the biased recognition of the role played by socioeconomic factors.
Our findings also differed from those of the previous study conducted on Mainland China [36], which identified that the distance to roads and precipitation were the most associated factors. A possible problem of variable selection in the study on the outbreak of H5N1 in Mainland China [36] is that they did not include temperature, which has been suggested very important in ecological niche modeling [9]. Besides, as showed in our study, the first axis of PCA reflected the thermal gradient of H5N1 outbreak. If the previous study [36] includes thermal or water-related variables, they might obtain a different result. It is impossible to compare our finding with that of the previous study [36] directly therefore.
Although having inconsistent aspects in determining the relative importance of variables, our study, along with the pervious studies [18,36], represented the distribution modeling of avian influenza from three spatial scales—global, regional, and national, respectively. They provide some insights into H5N1 transmission at different spatial dimensions.
Very interestingly, our findings suggested that the natural element played a more important role than the human element in H5N1 transmission. Compared to previous works [18,36], we did not have a biased treatment of environmental or socioeconomic factors; therefore our results can provide a further understanding of H5N1 transmission. Through the combination of human and nature-related variables as model predictors, our study indicated that the thermal requirement was most essential for H5N1 outbreak. This may be related to global bird migrations. Water requirement was also very pivotal for H5N1 transmission, as revealed by the second axis of PCA. This gradient reflected the physiological requirement of migrating waterfowl [17]. Human-related socioeconomic variables seemed less important compared to environmental variables, and were only indicated in the third and fourth axes of PCA. Based on variable-combination modeling, we stand in line with the conclusions of the previous study [17]: the natural (or environmental) element can explain H5N1 outbreak, the ecological dominance of H5N1 supports the “ecoregions” hypothesis. The importance of climate and water variables associated with infectious diseases is strictly in line with previous conclusions [4,10]. Although our recognition, like that of the previous study [17], may be criticized by many other researchers [43,44] who emphasized the extreme importance of the anthropogenic element, we still suggest that the natural element cannot be overlooked, leastways if we want to have a better understanding of the H5N1 spreading pattern, especially at the global scale.
Currently, the global potential risk of infectious diseases is predicted based on the assumption of virus’ ecological requirement [13,27]. Another prediction modeling complementary to our approach is to take advantage of the phylogenetic relationship inferred from molecular data [15,45], namely phylogeographic approach, which is capable of handling the rapid evolutionary dynamics [46] and spreading estimation of avian influenza [45]. Here we suggest that phylogeographic analysis integration [45] and ecological niche modeling [47] will contribute to the knowledge on worldwide surveillance of avian influenza A.
Disclosure of interest
The authors declare that they have no conflicts of interest concerning this article.
Acknowledgements
This work was supported by the China Scholarship Council grant number 201308180004, http://www.csc.edu.cn.