

1 Introduction
Non-alcoholic fatty liver disease (NAFLD) is the result of the accumulation of excess fat in the liver when no other pathology is present [1]. More recently, the World Health Organization has proposed the new term “metabolic syndrome”, which is defined as the glucose intolerance or type-2 diabetes mellitus and/or insulin resistance associated with high blood pressure, increased serum levels of triglycerides, and abdominal obesity. Now NAFLD is associated with these diseases, constituting this syndrome [2]. In modern societies, energy intake diets exceeding the daily needs for long-term consumption cause an alarming increase in metabolic diseases, which manifests itself in humans by a variety of clinical disorders associated with liver dysfunction. This affection was first described in 1952 by Zelman, and was called fatty liver disease in severely obese subjects [3]. In humans, NAFLD is the main cause of cirrhosis and increased risk of liver-related deaths. However, the pathophysiological mechanisms of progression to steatohepatitis, fibrosis, cirrhosis, and ultimately hepatic cancer are complex and still unclear, due to the lack of long-term observational studies [4]. Moreover, steatohepatitis is often associated with fibro-inflammatory lesions [5]. Indeed, fibrosis is characterized by an excessive production of extracellular matrix components in the interstitial space of an organ, which, if not controlled, can cause a dysfunction [6]. On the other hand, autophagy is a survival way of the cell involving lysosomal degradation of cytoplasmic organelles and cytosolic components. This pathway can be stimulated by various forms of cellular stress such as nutrient, damaged organelles, or intracellular pathogens [7]. It is also characterized by the formation of isolation membranes, which sequester a region of the cell to form autophagic vacuole or autophagosomes, which while fused with a substrate form lysosomes, where the contents are digested [8]. However, the most important question, which is not yet resolved, concerns the relationship between steatohepatitis and steatosis, the potential role of insulin resistance, inflammatory status, and autophagy [9]. Several animal models are available for the NASH study, but none reproduces the set of lesions induced by the disease and their chronology, particularly fibrosis. Recent studies showed that Psammomys obesus can be an animal model of steatohepatitis, as it accurately mimics the biochemical and metabolic characteristics of the disease in humans [10].
P. obesus Cretzschmar (1828) [11] lives in desert areas, of the North West Algerian Sahara. In its biotope, it feeds exclusively on halophytes plants of the Chenopodiaceae family, naturally rich in mineral salts (sodium chloride especially) and poor in calories. These animals live in drastic climatic conditions, with restricted food, which is why they have developed a food strategy and behavioral and physiological adaptation mechanisms, allowing them to live normally in such a biotope, and never develop any metabolic disease [12]. P. obesus is particularly interesting because whenever it is submitted to a standard laboratory diet and compelled to live in a confined space, it develops rapidly obesity and metabolic disorders similar to that observed in humans [13]. Indeed, in the literature, the pathogenesis of steatosis in the diabetic syndrome is not fully elucidated within this animal; it is limited only to histology and molecular biology [14].
The aim of this study was to show that P. obesus, submitted to a SD for 10 months, develops a simple steatosis, which evolves, from the sixth month onward, to steatohepatitis within a fibro-inflammatory state, and to an autophagic malfunction, comparable to those observed in humans. This study would permit us to assess the evolution of the autophagy regulation and hepatic cells implicated other than hepatocytes, during the transition from steatosis to more serious liver diseases.
2 Material and methods
2.1 Animals
In this study, we used males of Psammomys with body weight varying between 90 and 96 g, trapped in the semi-desert region of Beni-Abbes-Abadla (900 km southwest of Algiers). During 15 days of acclimatization to laboratory conditions (25 °C, 70% hygrometry, and 12-h light-dark cycle), the animals were fed halophytes plants (Salsola fœtida) (50 g/day/animal, equivalent to 30–32 kcal). The plant represents a low-energy diet; its detailed composition is given in Table 1.
Composition of the diets (% of diet): natural diet (ND) and standard laboratory diet (SD).
| Diet composition | ND | SD |
| Proteins | 3.5 | 0.3 |
| Casein | – | 20 |
| Lipids | 0.4 | 5 |
| Carbohydrates | 2.5 | 58.7 |
| Sucrose | – | 5 |
| Cellulose | 6 | 5 |
| Minerals | 6.8 | 4 |
| Vitamins | – | 2 |
| Water | 80.8 | – |
Later on, the animals were separated into two groups: first group – control animals (n = 54), maintained on the same natural diet (ND); second group – animals used for experimentation (n = 70), were fed with a standard laboratory diet (SD) (15–20 g/day/animal, equivalent to 52–70 kcal) rich in casein, lipids, and carbohydrates. The composition is displayed in Table 1. This diet is considered to be a high-caloric one for Psammomys [15]. All animals of the “experimental” group had free access to food and saline water (0.9% of NaCl).
The study lasted 10 months. The Psammomys individuals were weekly weighed. The blood samples were taken bimonthly and preserved in dry heparin tubes. Seven animals from each group were sacrificed at 2-month intervals.
All the animals were treated according to Directive 86/609/EEC, which regulates the use of animals for experimental and other scientific purposes, which was adopted in the EU in 1986 (Directive of EU, 2010) [16].
2.2 Biochemical analysis
In order to avoid the influence of nycthemere, blood punctures were practiced consistently fasted for between 8 am and 10 am, on animals that had fasted for 18 h.
The serum was separated by centrifugation at 3000 g for 10 min, and the glucose level was measured by the oxidase-peroxidase (GOD-POD) enzymatic method [17]. The plasma triglycerides were estimated by enzymatic method using Monozyme diagnostic kit [18], and the total cholesterol was measured using the Siedel method [19] at the end, whereas the insulin content was determined by radioimmunoassay (Wide & Porath's method [20]).
2.3 Histological, immunohistochemal, and cytological methods
Liver and visceral adipose tissue (VAT), especially abdominal fat, were excised from the body immediately and immersed in an adequate fixative, 10% formalin, for histological and immunohistochemical studies [21]. The liver weight (LW) and visceral adipose tissue weight (VATW) were determined after the animals were sacrificed. The ratio of LW/BW (Body Weight) and VAT W/BW were calculated.
2.3.1 Histological methods
After dehydration and embedding in paraffin, 5 μm-thick sections of VAT pieces were stained with haemalum-eosin (H&E). The nuclei of the adipocytes were stained with haemalum; the cytoplasm and the connective limits between the cells were stained with eosin. This staining allowed us to visualize the cell morphology. In each group, the control and experimental, diameters of the adipocytes were measured using a microscope equipped with an ocular micrometer.
2.3.2 Immunohistochemical study
After dewaxing and hydration, the sections were surrounded with hydrophobic resin (DAKO-pen), and treated with 3% hydrogen peroxide to inhibit the endogenous peroxidase activity; they were then rinsed in a PBS buffer (Sigma Aldrich, pH = 7.4, 0.01 M). The primary antibody (1/100 diluted) was applied for 30 min at ambient temperature (AT) [Rabbit Anti-TNF-alpha antibody (ab6671)] (Biomeda), and then rinsed three times for 5 min in PBS. Complex streptavidin-peroxidase was applied for 30 min at AT. The substrate solution – chromogen (hydrogen peroxide and AEC) – is applied for 10–15 min at AT. The secondary antibody was coupled with fluorochrome, Alexa Fluor 488 (1/2000 diluted). The sections were contrasted with an aqueous solution and were mounted in an aqueous medium containing hematoxylin (Crystal Mount™), and then observed by fluorescence microscopy [22].
2.3.3 Electron microscopy method
The fixation of the liver was carried out in two times, a fixing step followed by a post-fixing stage. Fixing consisted in immersing the liver in a mixture of 4% glutaraldehyde–2% paraformaldehyde diluted in 0.1 M Sorensen buffer at pH 7.1 for 2 h at 4 °C. The pieces were then washed in a 0.2 M Sorensen buffer, then post-fixed in a 1% solution of osmium tetroxide during 1 h at 4 °C in order to preserve and stabilize the lipid inclusions and to improve the contrast of the membrane. The impregnation was realized in the inclusion of epoxy resin 812 [23]. Ultrathin sections were cut and contrasted with uranyl acetate followed by lead citrate, and observed with Jeol 1400 and Jeol 1200 EX transmission electron microscopes.
2.4 Statistical analysis
The values were expressed as mean ± S.E.M. Differences in means between two groups of P. obesus were determined with Student's t test. P values < 0.05 were considered as statistically significant.
3 Results
3.1 Studies of the weight and of the metabolic parameters
Psammomys fed with SD during 10 months developed a metabolic syndrome. Indeed, body weight varied greatly, with a significant (P < 0.001) increase during the first six months. However, after 8 months of SD, their body weight decreased until the end of the experiment. The relative weight of the liver and visceral adipose tissue presented weight fluctuations. During the first six months, liver and visceral adipose tissues were gaining weight significantly (P < 0.001). From the sixth month to the tenth month, the relative weight of visceral adipose tissue decreased significantly, contrary to the relative liver weight, which remained significant (P < 0.02) (Table 2).
Average values of the body weight (BW), of the relative weight of the liver (LW/BW) and of the relative weight of visceral adipose tissue (VAT/BW) in Psammomys obesus: control animals and animals involved in our experimentation.
| Body wt (g) | (LW/BW) (g) | (VATW/BW) (g) | ||||
| Period/month | Control (C n = 7) |
Experimental (En = 7) |
Control (C n = 7) |
Experimental (E n = 7) |
Control (C n = 7) |
Experimental (E n = 7) |
| 0 month (n = 14) | 93.63 ± 2.37 | 90.29 ± 2.45 | 3.46 ± 0.29 | 3.58 ± 0.02 | 0.29 ± 0.018 | 0.32 ± 0.02 |
| 2 month (n = 14) | 94.4 ± 2.19 | 121.41 ± 6.56** | 3.09 ± 0.13 | 3.79 ± 0.03 | 0.30 ± 0.01 | 1.06 ± 0.003*** |
| 4 month (n = 14) | 95.82 ± 2.33 | 134.12 ± 5.92*** | 3.39 ± 0.09 | 6.27 ± 0.04**** | 0.29 ± 0.02 | 1.74 ± 0.04**** |
| 6 month (n = 14) | 94.78 ± 3.34 | 146.34 ± 5.24**** | 3.91 ± 0.13 | 6.84 ± 0.08***** | 0.31 ± 0.02 | 2.44 ± 0.08**** |
| 8 month (n = 14) | 93.74 ± 3.5 | 77.47 ± 1.86 | 3.4 ± 0.17 | 4.21** ± 0.06 | 0.30 ± 0.01 | 0.29 ± 0.01 |
| 10 month (n = 14) | 93.87 ± 3.46 | 64.1 ± 1.35 | 3.72 ± 0.13 | 4.84** ± 0.02 | 0.30 ± 0.01 | 0.21 ± 0.01 |
** P < 0.02.
*** P < 0.01.
**** P < 0.001 versus control Psammomys obesus group (halophytes plants).
Throughout the experiment, metabolic parameters such as glycemia (P < 0.001), cholesterolemia (P < 0.001) and triglycerides (P < 0.001), in particular, changed significantly. However, the level of insulinemia increased significantly (P < 0.001), then decreased brutally between the eighth and the tenth month (Table 3).
Average values of blood glucose (g/1), of plasmatic insulin (μUI/mL), of plasmatic triglycerides (g/1) and plasmatic total cholesterol (g/1) in control Psammomys obesus and in animals submitted to SD.
| Period/month Control | Glucose (g/L) | Insulin (μUI/mL) | Triglycerides (g/L) | Cholesterol (g/L) | ||||
| Experimental | Control | Experimental | Control | Experimental | Control | Experimental | Control | |
| 0 month | 0.63 ± 0.04 | 0.61 ± 0.10 | 26.2 ± 8.68 | 27.33 ± 9.63 | 0.65 ± 0.13 | 0.70 ± 0.21 | 0.60 ± 0.05 | 0.61 ± 0.04 |
| 2 month | 0.65 ± 0.04 | 0.99 ± 0.12* | 26.6 ± 8.16 | 247.5 ± 32.93*** | 0.64 ± 0.08 | 1.41 ± 0.17*** | 0.63 ± 0.07 | 0.87 ± 0.17* |
| 4 month | 0.70 ± 0.03 | 1.24 ± 0.11*** | 27.4 ± 7.56 | 281.66 ± 40.77*** | 0.69 ± 0.09 | 2.04 ± 0.32*** | 0.66 ± 0.06 | 1.37 ± 0.19** |
| 6 month | 0.64 ± 0.02 | 1.67 ± 0.22*** | 26.5 ± 9.63 | 378.5 ± 40.36**** | 0.71 ± 0.0 7 | 2.73 ± 0.33*** | 0.63 ± 0.05 | 1.66 ± 0.16*** |
| 8 month | 0.63 ± 0.05 | 2.19 ± 0.23**** | 26.6 ± 8.26 | 19.44 ± 0.94 | 0.67 ± 0.05 | 2.83 ± 0.29**** | 0.64 ± 0.08 | 1.79 ± 0.14**** |
| 10 month | 0.68 ± 0.08 | 2.28 ± 0.26**** | 28.2 ± 9.39 | 12.66 ± 0.66 | 0.70 ± 0.0 6 | 3.12 ± 0.22**** | 0.65 ± 0.03 | 2.25 ± 0.15**** |
* P < 0.05.
** P < 0.02.
*** P < 0.01.
**** P < 0.001 versus control Psammomys obesus group.
3.2 Histopathological study of the visceral adipose tissue (VAT)
From the fourth month until the end of experiment, VAT appeared with adipocytes hypertrophy: 187.7 ± 3.89 μm of diameter and proliferation of connective tissue with infiltration of immune cells, particularly macrophages (Fig. 1b). Compared with the VAT of control animals (Fig. 1a), we observed adipocytes with 67.3 ± 3.56 μm of diameter, with peripheral nuclei and absence of macrophages. The diameter of the adipocytes increased significantly (P < 0.001) in the experimental group.
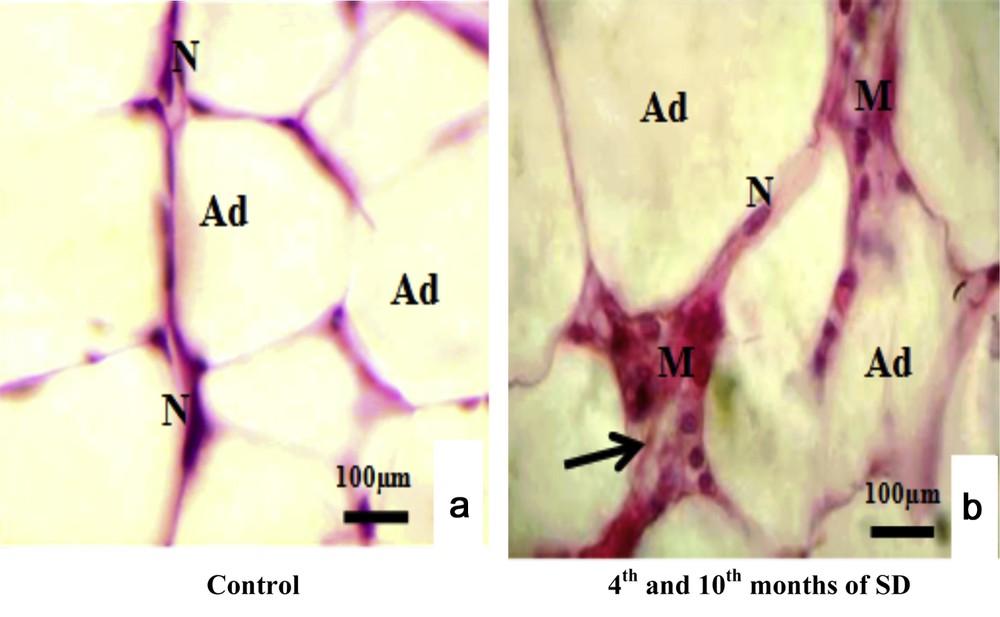
Histopathological study of visceral adipose tissue stained with haemalum-eosin (H&E) in both experimental and control groups. (a) Control adipocytes (Ad) containing a nucleus (N). (b) Adipocytes from animals involved in our experimentation (Ad), connective tissue situated between adipocytes (Ad) (arrows) and macrophages (M).
3.3 Detection of TNF-alpha in the liver cells
From the fourth to the tenth month of SD (Fig. 2b), TNF-alpha detection with fluorescent immunostaining labeling in the experimental group was significantly expressed in the central vein and in the hepatic adhesions. It was diffuse in hepatic cytoplasms, but not visible in nuclei. In sinusoids, TNF-alpha expression was detected and well localized inside cells situated in sinusoid lumens. The TNF-alpha expression of the control group was virtually undetectable (Fig. 2a).
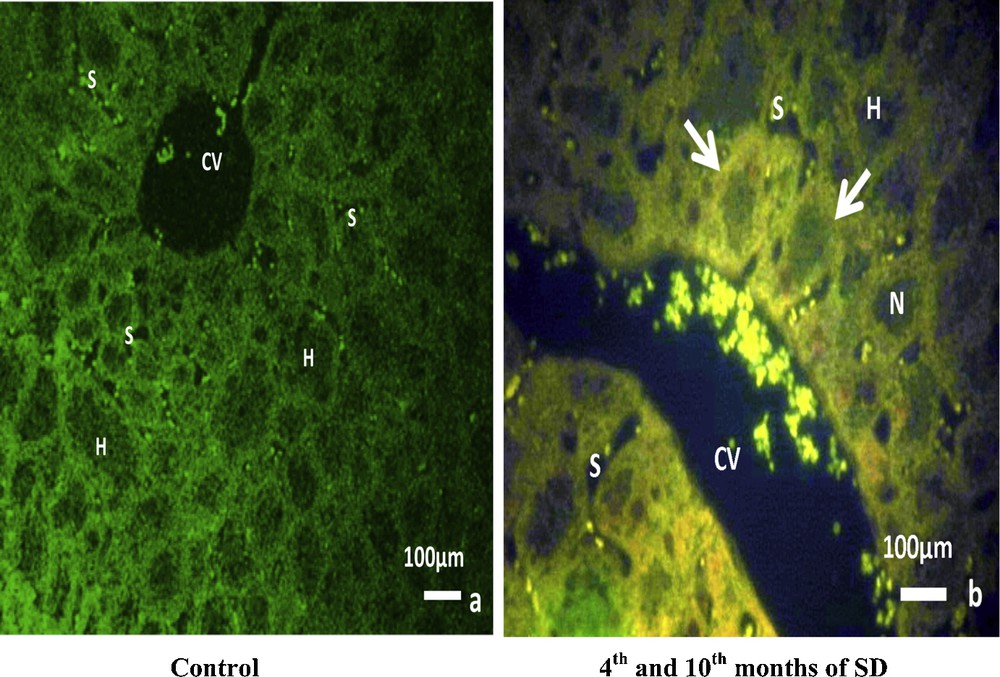
TNF-alpha detection with fluorescent immunostaining labeling: (b) in the experimental group, TNF-alpha is clearly expressed in the central vein (CV), in the lumen of sinusoids (S), in the hepatic adhesions (arrows) and in the cytoplasm of hepatocytes (H), but is not visible in nuclei (N). Compared to the control group (a), TNF-alpha was virtually undetectable.
3.4 Analysis of liver cells by transmission electron microscopy
3.4.1 Hepatic steatosis and regulation of lipid droplets by autophagy
The examination of control hepatocytes revealed the normal appearance of organelles, including rounded nuclei with normal distribution of euchromatin. In addition, the hepatocytes contained mitochondria elongated and round forms that were found intermingled with cisternae of rough endoplasmic reticulum (ER). Abundant glycogens were also observed. At the sinusoidal pole, hepatocytes were surmounted by microvilli (Fig. 3Aa). The ultrastructural examination of experimental hepatocytes of the second month of SD, compared to control livers, showed a foamy appearance. The hepatocytes’ cytoplasm was saturated with lipid droplets, not limited by a membrane, characteristic of nonalcoholic fatty liver disease (NAFLD). The cytological technique caused the dissolving of lipids, which appeared such as empty areas in the hepatocytes. The cisternae of perinuclear rough endoplasmic reticulum proliferated and were separated by several areas of cytoplasm. Several abnormally shaped mitochondria were observed in the perinuclear and pericanalicular regions. Some mitochondria appeared to fuse with autophagic vacuoles. On the other hand, we noticed the presence of electron-dense vacuoles with a heterogeneous content, which together form autophagic vacuoles (Fig. 3A, b). In the fourth month of SD, lipid droplets were penetrated by a membrane (isolation membrane) and surrounded with an autophagosomal membrane (Fig. 3A, c). We also noticed lipids droplets with a heterogeneous content, indicating lipophagic vesicles (Fig. 3A, d). In conclusion, our results suggest that steatosis was associated with dynamic regulation of lipophagy (Fig. 3A, c, d).
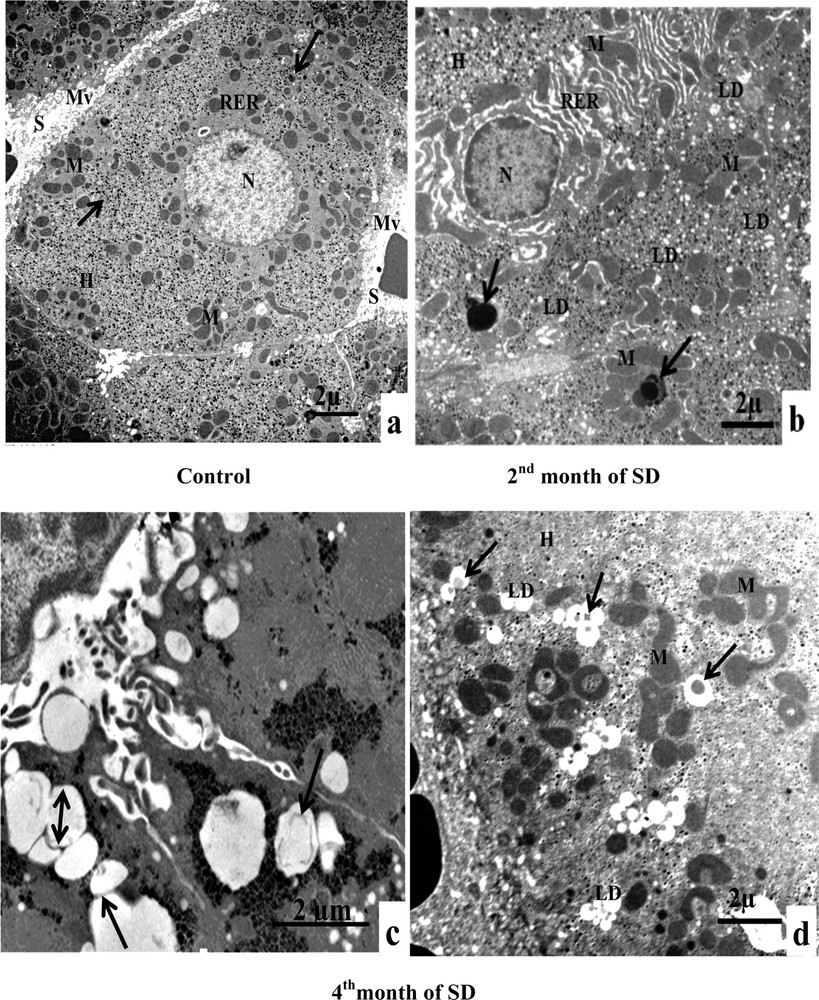
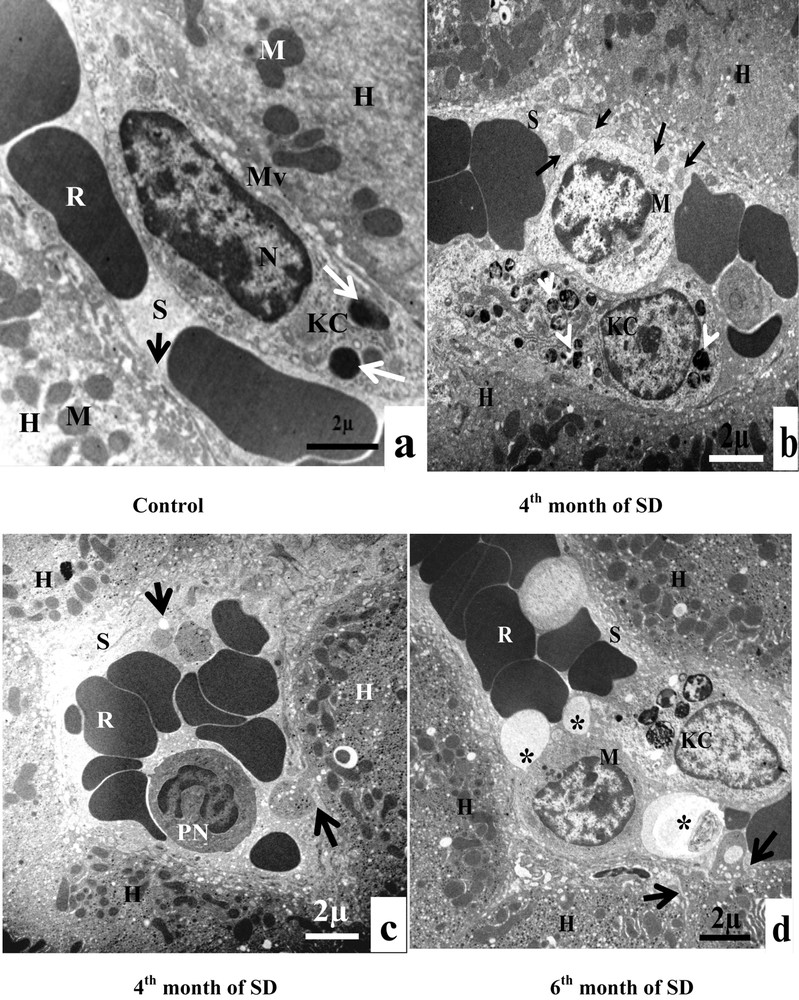
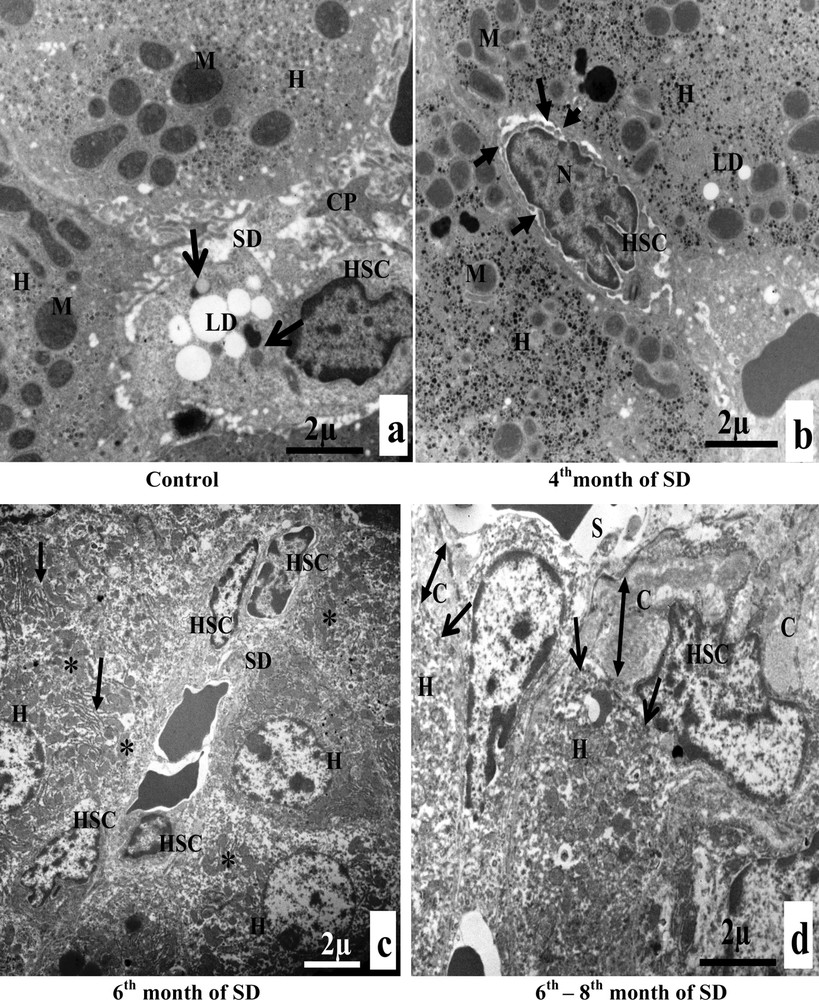
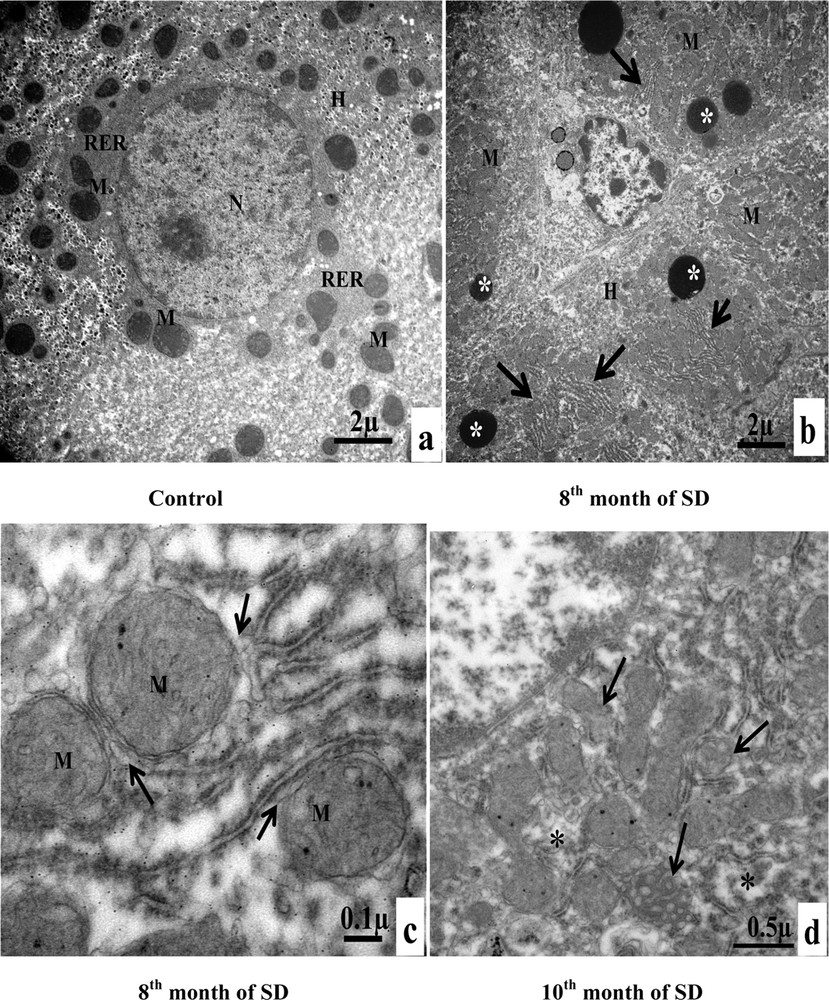
A. Electron microscopy examination of experimental hepatocytes at the stage of steatosis and lipophagy. (a) Hepatocyte control cell (H), nucleus (N), mitochondria (M), rough endoplasmic reticulum (RER), microvilli (Mv), sinusoid (S), glycogens (arrows). (b) Hepatocyte hepatocytes from an animal involved in our experimentation (H), mitochondria (M), rough endoplasmic reticulum (RER), lipid droplets (LD), electron-dense vacuoles with a heterogeneous content: autophagic vacuoles (arrows). (c) Lipid droplet having penetrated into the membrane (isolation membrane) (long arrows), surrounded by an autophagosomal membrane (double arrow). (d) Hepatocyte from an animal involved in our experimentation (H), mitochondria (M), and lipids droplets (LD) with a heterogeneous content: lipophagic vesicles (curved arrows). B. Transmission electron micrographs of the sinusoidal pole of hepatocytes and the sinusoidal lumen of the group under experimentation vs. the control group. (a) Control hepatocytes (H), mitochondria (M), microvilli (Mv), discontinuous sinusoidal endothelium (arrow), Kupffer cell (KC) with electron-dense vacuoles (white arrows) and red blood cell (R). (b): hepatocytes from animals involved in our experimentation (H), sinusoid (S), Kupffer cell (KC) with lysosomes (head white arrows), macrophage (M) and cytoplasmic fragments fused with the membrane of the macrophage (arrows). (c): Hepatocytes from animals involved in our experimentation (H), red blood cell (R), fragmentation of the hepatocytes cytoplasm, containing lipid droplets (arrows) in a sinusoid (S) and a polynuclear neutrophil (PN). (d) Hepatocytes from animals involved in our experimentation (H), red blood cell (R), vesicles with a heterogeneous content (asterisk) are merging with macrophage (M), Kupffer cell (CK), loss of microvilli and disarrangement of the hepatic cells (arrows). C. Transmission electron micrographs showing the proliferation and the activation of hepatic stellate cells (HSC) of different groups involved in our experimentation vs. the control group. (a) Control hepatocytes (H), mitochondria (M), cytoplasmic processes (CP), space of Disse (SD), lipid droplets (LD), lysosomes (arrows). (b) Hepatocytes from animals involved in our experimentation (H), mitochondria (M), lipid droplet (LD), nucleus transformation (N) of hepatic stellate cell (HSC), The sinusoidal endothelium is fenestrated (arrows). (c) Space of Disse (SD), hepatic stellate cells (HSC), hepatocytes (H), mitochondria (asterisk), rough endoplasmic reticulum (arrows). (d) Collagen fibers (C) that invaded completely the space of Disse, formation of a continuous basal lamina under endothelial ones and disappearance of the discontinuous shape of the sinusoids (S) (double arrows). One can notice the rupture of the hepatocytic plasmic membrane by loss of microvilli (small double arrows). D. Transmission electron micrographs showing hepatic cells. Important increase of autophagic vacuoles (mitophagy) in cytoplasm of hepatocytes SD–treated Psammomys obesus. (a) Control hepatocyte (H), nucleus (N), mitochondria (M), rough endoplasmic reticulum (RER). (b: Hepatocytes from animals involved in our experimentation (H), electron-dense vacuoles (asterisk), mitochondria (M), fragmentation of rough endoplasmic reticulum (arrows). (c) Detailed observation of (b), isolation membranes: autophagic phagophores (arrows) in the proximity of mitochondria (M). (d) Damaged mitochondria (arrows) and lysosomes (mitophagy) (stars).
3.4.2 Hepatic alterations associated with infiltration of immune cells in sinusoid
The sinusoidal pole of control hepatocytes was surmounted by numerous microvilli, which project into the space of Disse. The sinusoidal endothelium presented a fenestrated aspect and was discontinuous. It was devoid of basal lamina. The sinusoidal lumen contained Kupffer cells and red blood cells. There were only a few electron-dense vacuoles in the cytoplasm of Kupffer cells. We also noted the absence of lipid droplets in hepatocytes (Fig. 3B, a). At the end of the fourth month of SD, Kupffer cells became completely filled with numerous vacuoles with heterogeneous content (lysosomes). Immune cells, macrophages, infiltrated the sinusoid lumen. Hepatocellular cytoplasmic fragments fused with the membrane of the macrophage (Fig. 3B, b). In the sinusoidal lumen, we observed infiltrations of polynuclear neutrophils and cytoplasmic fragments. Indeed, at the sinusoidal pole of hepatocytes, we noticed a fragmentation of the cytoplasm of hepatocytes, containing lipid droplets (Fig. 3B, c). In the sixth month of SD, in the sinusoidal lumen, numerous large vesicles with heterogeneous content merged with macrophages and Kupffer cells. At the sinusoidal pole of hepatocytes, we noted loss of microvilli and disorganization of hepatic cells (Fig. 3B, d). In conclusion, our result suggested that steatosis was associated with inflammation.
3.4.3 Proliferation and activation of Hepatic Stellate Cell (HSC)
Hepatic Stellate Cells of the control group appeared morphologically normal, with cytoplasmic processes, situated in the space of Disse. Their cytoplasm contained lipid droplets and lysosomes (Fig. 3C, a). At the end of the fourth month of SD, HSC lost its lipid droplets. The nucleus took the elongated fusiform form, characteristic of a fibroblast cells. The sinusoidal endothelium was both discontinuous and fenestrated (Fig. 3C, b). From the sixth month of SD onward, we observed an increase in the number of hepatic stellate cells in the space of Disse. The cytoplasm of hepatocytes was invaded with mitochondria and rough ER (Fig. 3C, c). Between the sixth month and the eighth month of SD, we noted an excess of the collagen fibers surrounding the HSC, which were occupying occupied all the space of Disse. We also noticed the disappearance of the fenestrated aspect of the sinusoids by the formation of a continuous basal lamina under the endothelial one. At this stage, we observed the anomaly of hepatocytes, at the sinusoidal pole, and we noted the rupture of the hepatocytic plasmic membrane by the loss of microvilli (Fig. 3C, d).
3.4.4 Alterations of hepatocyte organelles
At the end of the eighth month of SD, the hepatocytes of the group of individuals used for experimentation contained numerous electron-dense vacuoles. Compared to the hepatocytes of the individuals of the control group, we noted an increase in the number of mitochondria and the fragmentation of the rough ER (Fig. 3D, a, b). In Fig. 3D, c, the cytoplasm of the hepatocyte was invaded by autophagic phagophores that were fragments of the membranes of the rough ER (isolation membranes). These membranes surrounded the mitochondria, thus forming autophagic vacuoles. In the tenth month of SD, in the hepatocyte cytoplasm, damaged mitochondria were the predominant contents of autophagic vacuoles. The stars indicated lysosomes that correspond to the enzymatic degradation of mitochondria (mitophagy) (Fig. 3D, d).
4 Discussion
In this study, we demonstrated that P. obesus, when fed with a standard laboratory diet, developed a chronic metabolic complication of type-2 diabetes associated with a profound damage of liver cells. This study allowed us to analyze in a chronological order, for the first time, liver cytopathological alterations associated with the passage NAFLD/NASH in P. obesus. The different stages observed of the pathogenesis of NAFLD are very complex and depend on several factors, such as weight, insulinemia, glycaemia, dyslipidemia, and inflammatory cytokine.
From the second month onward, the calorie diet caused an increase in body weight associated with increased visceral fat mass. Weight gain particularly linked to fat increase was associated with hyperinsulinemia and hypertriglyceridemia. Many studies carried out on P. obesus, submitted to SD, proved the existence of metabolic disorders characterized by insulin resistance and type-2 diabetes mellitus [24,25]. It was noted that P. obesus was predisposed to diabetes by the existence of genetic traits. This suggestion was based on the fact that these animals became diabetic when their natural plant-based diet was substituted by standard laboratory food, assuming that the plants found in nature were sufficient to prevent diabetes [26]. Cytological observations were perfectly correlated with the results of biochemical analysis, with an accumulation of lipid droplets in hepatocytes. Our results were similar to studies using the Israeli Psammomys and Nile rat [27,28]. Steatosis studies conducted on patients showed that the release rate of free fatty acids from adipose tissue and its absorption by the liver increased in obese people with NAFLD. In addition, de novo lipogenesis intrahepatic of fatty acids was greater in subjects with NAFLD [29].
Shimomura et al. [30] showed that, in rats, hyperinsulinemia alone stimulates the accumulation of fat in liver, activating de novo the synthesis of fatty acids (lipogenesis) via the transcription factor, sterol response element binding protein-1c (SREBP-1c), which activates most of the genes involved in lipogenesis.
From the fourth month of SD onward, the microscopic examination of the visceral adipose tissue permitted us to observe an inflammation with infiltration of macrophages and an inflammation in the liver that was detected by labeling of the TNF-alpha by means of immunohistochemistry studies. Studies performed on the adipose tissue of genetically obese/diabetic, ob/ob, db/db, agouti, and tubby mouse models demonstrated that visceral fat is able to activate the secretion of many adipokines, such as tumor necrosis factor (TNF-alpha) and the protein chemotactic macrophages (MCP) that develop insulin resistance, type-2 diabetes, and the progression of steatosis (NAFLD) [31].
Liver biopsies were performed for the first time in 1980 by Ludwig et al. [32] on patients with alcoholic liver disease; showing that steatosis could progress to steatohepatitis.
The fact that inflammation could contribute to this process was supported, on the one hand, by the presence of important immune cells infiltrating the sinusoids, and, on the other hand, by the occurrence of inflammatory lesions that accompanied the intense phagocytic activity mediated by the Kupffer cells.
The same results were observed in our diabetic model P. obesus. TNF-alpha is involved in the migration of circulating neutrophils in the liver of alcoholic patients [33]. TNF-alpha synthesized by monocytes, neutrophils and mainly Kupffer cells induces the production of proteins of the acute phase of the inflammation [34]. TNF-alpha has hemodynamic effects, such as increased vascular permeability and severe liver damage [35].
From the fourth month of SD onward, our electron microscopy analysis showed that the number of lipid droplets increased in cytoplasm hepatocytes. These lipids were delimitated by a membrane forming an autophagosome. Martin and Parton [36] demonstrated that lipid droplets are not only cytosolic structures that store triglycerides and cholesterol, but rather complex intracellular organelles that perform a variety of biological functions. The hypothesis that autophagy is responsible of hepatocyte lipid droplets degradation was confirmed in mice [37]. Experiments on Wistar rats with hepatic steatosis induced by ethanol showed that the mitochondria and lipid droplets are the only organelles contained in autophagic vacuoles [38]. The existence of lysosomal lipases suggested a possible link between lipolysis and autophagy [39]. Indeed, an interrelationship between the two processes was demonstrated by the finding that autophagy mobilizes lipids from lipid droplets for metabolism through a process termed lipophagy [40]. The ability of autophagy to regulate lipid droplet accumulation in hepatocytes suggests that the autophagic function in the liver may regulate the development of steatotic liver diseases, such as non-alcoholic steatosis and alcoholic steatohepatitis [41]. Studies in a binge alcohol model have shown that alcohol increased autophagy to limit the accumulation of lipids in lipid droplets and the development of alcoholic steatosis. The hepatic autophagic response to alcohol was selective for lipophagy [42]. In the fourth and sixth month of SD, we noted hyperglycemia, hyperinsulinemia, and hyperlipidemia, particularly triglyceridemia associated with increased body weight, higher visceral adipose tissue deposition, and increased relative liver weight. Similar results were found in Wistar rats fed a high-fat diet [43]. These authors hypothesized that not only calories were responsible in the induction of weight gain or metabolic syndrome, but that the oxidative stress factor might also be involved.
After the 6th month of SD, body weight decreased significantly, which accompanied by a typical metabolic disorder of diabetic syndrome with simultaneously hyperglycemia, hypoinsulinimia, which caused complications of type-2 diabetes mellitus. Glucotoxicity induced apoptosis and necrosis of β cells, and reduced the pancreatic insulin content. These effects could be the result of the inability of biosynthetic machinery to face the sustained increase in secretory demand imposed by diet-induced hyperglycemia [44]. A plausible responsible in this context is pancreatic duodenal homeobox factor-1 (PDX-1), a key transcription factor which regulates insulin gene transcription in response to glucose [45], and which could not be detected in P. obesus islets [46].
In our diabetic animal, from the fourth month of SD onward, the development of steatohepatitis to fibrosis occurs through nuclei activation, and that of hepatic stellate cells through the acquisition of a myofibroblastic fibrogenic phenotype. It would appear that increased autophagy may be required for lipid removal, which is necessary to allow activation to occur or to provide critical energy stores [47]. Hepatic stellate cells appear to be involved in the synthesis of the extracellular matrix and endothelial basal lamina, causing the obturation of sinusoidal pores and therefore the capillarization of the sinusoids. According to the literature, inflammatory and immune responses have an important role in fibrogenic cells activation (liver stellate cells) by the production of pro-fibrotic cytokines (Transforming Growth Factor-beta) TGFβ [48]. It was reported that the presence of sinusoidal fibrosis in humans disturbs hepatocyte metabolic functions and activates hepatic stellate cells [49]. Studies were done on an animal model of liver fibrosis, Sprague–Dawley rats, which showed that the activation of hepatic stellate cells generates deep pathophysiological changes with as consequences a reduction in the permeability between sinusoids and hepatocytes and increased portal pressure due to a stiffening of the sinusoid contractile properties acquired by liver stellate cells [50], which corroborates the results found in our study. At the stage of insulinoprivate, from the eighth month of SD onward, hepatocyte cytoplasm showed electron-dense bodies, probably corresponding to residual bodies.
In the second month of the experimentation, a large ER dilation was observed, reflecting an intense activity of protein synthesis. ER is the organelle responsible for folding, maturation and quality control of cell proteins [51]. According to [52], excess protein synthesis perturbs the protein folding capacity in ER by an alteration of the energy availability or a change in the redox potential of its lumen, induce a physiological response called UPR (unfolded protein response). Indeed, at the end of the experiment, we noticed an alteration and a fragmentation of ER. According to [53], studies conducted in humans and mice evidenced that the ER is a vital source for the formation of the membrane of autophagosome, an increase in misfolded proteins active proteins associated with the ER membrane, protein kinase RNA-like ER kinase (PERK), and for activating transcription factor-6 (ATF6), inducing autophagy. We noticed mitophagy, degradation of mitochondria. According to [54], the presence of diabetes and dyslipidemia associated with steatohepatitis caused mitochondrial beta-oxidation inhibition. During autophagy, part of the cytoplasmic material, including organelles, is addressed to lysosomes to be degraded there. Some hepatocytes underwent necrosis. The study in [55] showed that TNF-alpha increases the expression of adhesion molecules type-b2 integrins on the surface of neutrophils and of adhesion molecules ICAM-1 on the surface of altered hepatocytes. This stimulation of the expression of adhesion molecules contributes probably in the migration and adhesion of neutrophils at the level of hepatocytes, opening the way toward necrosis.
5 Conclusion
Our study suggests clearly that P. obesus is an animal model that perfectly mimics human steatohepatitis and is adapted to scientific research. The experiments on that murine model could open the opportunity to develop a therapy able to repair the autophagic flux, and might attenuate or prevent the progression of NAFLD.
Disclosure of interest
The authors declare that they have no competing interest.
Acknowledgments
This research is supported by the General Direction of Scientific Research and Development of Technology (Ministry of Higher Education and Scientific Research, DGRSDT-MESRS), Algeria.