

1 Introduction
1.1 Inflammation and cardiovascular risk (CV risk) are increased in RA and PsA
The impact of cardiovascular (CV) diseases on the society is enormous, and any method able to identify early individuals at risk will have a significant effect on morbidity and mortality. Classical CV risk factors related to obesity, hypertension, smoking, etc., have been identified for a long time. More recently, chronic inflammation has become an important link between these risk CV factors and the actual CV events. For many years, rheumatoid and psoriatic arthritis (RA, PsA) as well as similar diseases have been linked to local damage and to function loss. The goal of arthritis care was the control of local inflammation in order to prevent loss of joint function. It is unclear why it took so long to look at patient survival. When compared to control populations, it was obvious that life expectancy was severely affected [3]. Quickly joint destruction and mortality were linked to the level and duration of inflammation [4].
The most common cause of death in RA, PsA, and similar diseases is vascular disease, contributing 60% of the mortality risk in RA patients, comparable to diabetes mellitus as an independent risk factor for CV disease. RA patients have a four-fold increase in CV mortality. Figures are even higher when considering only RA patients who are rheumatoid factor positive or with high CRP levels [4]. In addition, this risk begins very early in the RA disease process [5]. In total, the prevalence of CV disease in RA has been found to be 16.2%. However, the largest difference in CV between RA patients and controls is seen in those without traditional risk factors – patients who are young, female, and have a low body mass index [6]. With specific regards to cardiac disease, RA patients have a twofold higher risk of myocardial infarction (MI) as compared to controls [5]. The odds ratio of having a MI with RA, as opposed to that with osteoarthritis (OA), a less inflammatory joint disease, is 2.14, and the odds ratio of having a MI at some point in life, again as compared to patients with OA, is 1.28 for RA patients (30). RA patients also carry a twofold higher risk of chronic heart failure (CHF) [5]. The odds ratio of having CHF with RA, as opposed to with OA, is 1.43 [7].
1.2 Effects of the cytokines TNF and IL-17 on vessels
Chronic inflammatory diseases are associated with overproduction of cytokines. These factors have a direct effect on the local manifestations that lead to joint destruction. As a consequence, targeting of TNF and more recently of IL-17 has provided an important improvement in care. In addition to the local effects, the same cytokines have also systemic effects. Circulating cytokines can then act on endothelial cells. Our previous research has studied the effects of TNF and IL-17, used alone and combined on human endothelial cells (EC). We recently showed that IL-17, especially when combined with TNF, has procoagulant, pro-aggregation, and pro-thrombotic effects [1,2]. All these effects are inhibited by the addition of statins [1,2]. IL-17 may play a significant role in the development of endothelial dysfunction and cardiovascular disease [8]. In apoE-deficient mice that have major vessel disease, IL-17A-blocking antibody reduced atherosclerotic lesion development, plaque vulnerability, cellular infiltration, and tissue activation [9]. IL-17 deficient mice, when on high fat diet, displayed significantly diminished aortic lesion size and macrophage accumulation [10].
Expanding these results to the human situation, a high peak of IL-17 plasma level was found in patients with unstable angina, if followed by myocardial infarction [11]. Thrombosis is the result of platelet aggregation and pro-coagulation activation in EC. To study the role of IL-17 in platelet aggregation, a functional assay with platelet-rich plasma (PRP) was performed. Supernatants of EC treated with IL-17 and TNF were added to PRP and ADP, acting as an agonist of platelet aggregation. Aggregation was monitored by changes in light transmittance in a lumiaggregometer. IL-17 alone enhanced the level of platelet aggregation from 20% to 45–50% (P = 0.001). A similar effect was seen with TNF combined with IL-17. Regarding the effects on coagulation, IL-17 and TNF induced synergistically a massive expression of the tissue factor (F3, 15-fold), a key player to initiate the coagulation cascade. Furthermore, IL-17 and TNF induced plasminogen activator mRNA expression by 6-fold with an additive effect. Conversely, IL-17 in combination with TNF inhibited by 10-fold the expression of thrombomodulin, an inhibitor of coagulation, thus increasing the EC pro-thrombotic phenotype. Microarrays identified CD39, an inhibitor of platelet aggregation, among the genes inhibited by IL-17. The preserved function of CD39/ATPDase is crucial in the inhibition of platelet activation by keeping adenosine nucleotide levels low to inhibit platelet aggregation. After 12 h of incubation with IL-17, TNF and their combination, CD39mRNA expression was divided by 3.7. Thus, IL-17A was able to induce an imbalance between a pro-thrombotic and anticoagulant phenotype. These results were the basis for the development of the models of interactions between IL-17 and TNF, and the genes expressed by activated EC.
1.3 Coagulation cascade
Endothelial cells of the vessel wall produce tissue factor (Tf, Tf), tissue factor pathway inhibitor (TFPI), thrombomodulin (Tm, Tm) and CD39. Tf acts as the initiator of the blood clotting process in blood plasma by activating factors IX and X (B). The resulting enzymes activate prothrombin (P) which is produced in liver and circulates in the bloodstream, and creates thrombin (T). A low amount of thrombin is able to rapidly generate more thrombin in a self-accelerated reaction. Thrombin then acts as an enzyme in activation of fibrinogen (Fg) to fibrin (F). Through a polymerization process, fibrin monomers create a net of fibrin polymers (Fp) that solidifies blood plasma. This mechanism ensures a quite rapid closure of possible vessel wall injuries and reduces a potential blood loss. We have shown the part of the coagulation cascade considered in this work in Fig. 1. Blood coagulation needs to be triggered only in situations when it is necessary, while otherwise it needs to be prevented. Blood haemostasis hangs on a delicate balance of the involved blood factors, and as such it needs to be quite robust.
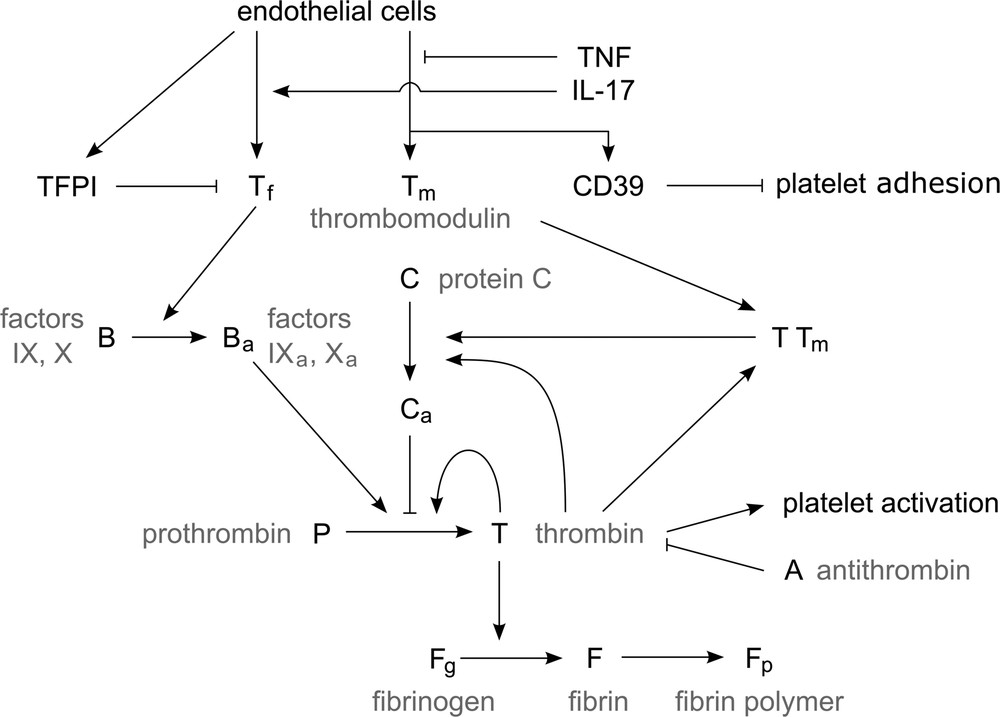
Simplified representation of blood coagulation (see the explanation in the text).
There are multiple fail-safe mechanisms that prevent spontaneous blood coagulation and limit the clot growth in the case of an injury (preventing vessel occlusion). The first one is the production of TFPI by EC, which acts as an inhibitor of Tf and prevents the initiation of the coagulation process. CD39 prevents adhesion of platelets to the vessel wall. Protein C is activated in the presence of thrombin and inhibits slowly thrombin generation. However, in the presence of thrombomodulin, which is also produced by EC, the activation of protein C is increased by a factor of one thousand, hence increasing the inhibition of thrombin production. Another mechanism is the direct inhibition of thrombin by antithrombin (AT, A).
In the case of the vessel wall inflammation due to presence of IL-17 and TNF-α in the blood stream, the EC are affected and their production of blood factors is altered. The production of procoagulation factors is increased, while the production of anticoagulation factors is severely decreased. Additionally, the production of TFPI and CD39 is reduced, allowing the platelets to more easily adhere to the vessel wall and disabling the haemostatic system in preventing spontaneous coagulation.
1.4 Modeling, using the in vitro results
In this work, we develop a model and carry out numerical simulations of clot growth taking into account the influence of IL-17 and TNF. We show that they promote blood coagulation and clot growth and they can lead to partial or complete vessel occlusion. We develop a simplified analytical model that allows us to obtain explicit conditions of thrombosis. We have previously used the same approach to determine the conditions on prothrombin and antithrombin that potentially result in exaggerated or insufficient thrombus development [12]. Various approaches are employed to study clot growth. Equations of chemical kinetics are used to describe reactions between the coagulation factors [13,14], platelet activation, and formation of platelets plug [15]. Reaction–diffusion equations for the concentrations of blood factors take into account their spatial distribution [16,17]. These distributions are influenced by hemodynamics. The blood flow can be modeled with partial differential equations or with particle methods. Navier–Stokes equations are used if blood is considered as a Newtonian fluid [18,19], and various viscoelastic models if non-Newtonian properties of blood are taken into account [18,20]. Clot growth can be modeled as a free boundary problem where the interface separates the blood flow from the clot region [21].
Another approach considers the blood flow and the clot as a continuous medium where clot is described as a high viscosity or a non-Newtonian fluid [18,22]. Clot can also be described as a porous medium with an additional term in the Navier–Stokes equations [23] describing fluid velocity deceleration inside the clot. In order to model platelets, both particle and continuous methods were used. Among the particle methods, the Immersed Boundary Method was used in [24], Cellular Potts Model [25], Dissipative Particle Dynamics in [20,26–29]. Advection–diffusion–reaction were also used to model platelet concentration (in their active and non-active forms) [15]. In hybrid models, particle methods are used to describe the blood flow and the blood cells and PDEs to describe concentrations of blood factors [27,28]. It is also possible to model the blood flow with the Navier–Stokes equations and the coagulation process with Cellular Automata [25].
In this work, we begin with the analysis of blood coagulation in quiescent platelet free plasma in order to determine the influence of IL-17 and TNF-α and identify the values of parameters (Section 2.1). We continue with numerical simulations of blood coagulation in flow using two different approaches. In the first one, the blood flow is described with the Navier–Stokes equations, while the concentrations of blood factors and of platelets with reaction–diffusion equations (Section 2.2). In the second approach, the blood flow and the platelets are modeled with a particle method, while the distribution of blood factors, as before, with reaction–diffusion equations (Section 3). The first method is more appropriate to study venous thrombosis with relatively low blood flow velocity. The second method is better for arteries and larger flow velocities where platelet aggregation is more important. We describe here platelets interaction (forces, attachment, detachment) in more detail. Numerical simulations are completed by an approximate analytical approach that allows us to identify different regimes of clot growth and conditions of vessel occlusion (Section 4).
2 Modeling blood coagulation and thrombosis
In the mathematical model of blood coagulation, we consider a rectangular 2D domain representing a section of a blood vessel. The source of blood factors can be either at the inflow boundary, if they are produced elsewhere and circulate in the blood stream, or at the vessel wall, if they are produced there under normal and pathologic conditions (vessel wall injury, vessel wall inflammation).
2.1 Clot growth in quiescent plasma
The evolution of thrombin concentration in time (without space distribution) is one of the main characteristics of blood coagulation in plasma. In Fig. 2a, we compare the thrombin generation profile of a healthy patient with those with perturbed tissue factor (Tf) and thrombomodulin (Tm) concentrations due to IL-17 and TNF-α [30]. The results show that in the absence of spatial dynamics, hypercoagulability is more increased by IL-17 than by TNF-α. The highest thrombosis risk was observed when the effect of the two proteins is combined. Through fitting the thrombin generation curves, we estimated that RA increases the concentration of Tf by a factor of two, while it decreases the concentration of Tm by 20%.
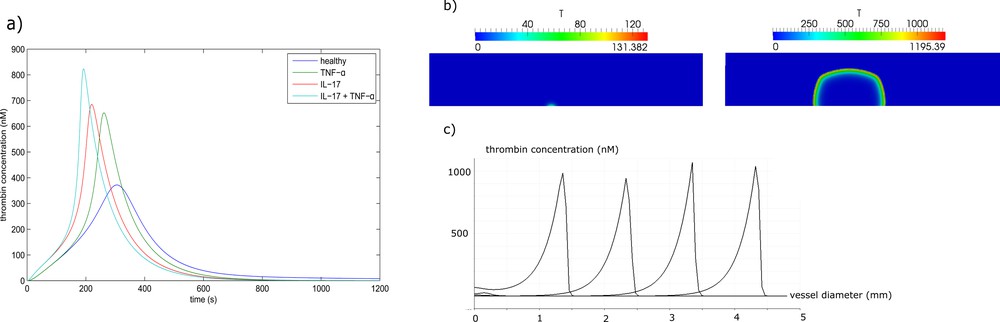
(a) Thrombin generation curves in the normal case and in the excess of IL-17, TNF-α and their combination. (b) Thrombin distribution during clot formation in a quiescent plasma. In the presence of IL-17, only a small clot forms near the wall, while if IL-17 and TNF-α are both present, the clot grows up to the opposite wall of the vessel, resulting in complete occlusion. (c) Thrombin distribution along the middle line of the clot (perpendicular to the vessel wall) in consecutive moments of time.
Next, we consider clot growth in quiescent plasma in a rectangular domain representing a part of blood vessel. There is an inflamed part of the vessel wall where Tf is expressed. It is the 0.5-mm-long interval at the center of the lower boundary (Fig. 2b). We compare two cases where the upregulation of Tf due to IL-17 is considered. In the first simulation, we neglect the inhibitory action of TNF-α on thrombomodulin. In spite of the excessive level of Tf due to IL-17, the thrombin wave does not propagate because of the inhibitory action of the activated protein C (APC). It is produced at intact parts of the vessel wall from both sides of the lesion due to the complex of Tm with thrombin. As a result, a small and limited clot forms over the inflamed region (Fig. 2b).
We consider now the case where the action of TNF-α is taken into account. It downregulates the expression of thrombomodulin at the intact neighboring parts of the wall. As a result, the concentration of Tm is reduced, decreasing also the rate of activation of protein C. The generated APC is not sufficient to stop the formation of the clot (Fig. 2b). The distribution of thrombin concentration along the middle line of the clot (perpendicular to the vessel wall) is shown in (Fig. 2c) at successive moments of time. This distribution has a form of localized spike moving from the boundary toward the inside of the vessel. It is a traveling wave solution to the corresponding reaction–diffusion system of equations of blood coagulation. Conversion of fibrinogen into fibrin and clot formation occurs behind the moving zone of thrombin formation.
2.2 The influence of the blood flow
We describe thrombus formation under a pressure-driven blood flow with a low shear rate of 13 s−1. The vessel diameter is set as 1.5 mm. We consider a fixed inflamed region of the blood vessel wall with the length 400 μm. If the inflamed tissue length is relatively small, then the individual actions of IL-17 or TNF-α are not sufficient to trigger the propagation of the clot. Hence, a normal haemostatic response is observed. As a result, a small clot is formed and the flow is not perturbed (not shown).
A joint action of IL-17 and TNF-α initiates clot growth. It can result in the complete occlusion of the vessel. In this case, the velocity profile at the inlet decreases as the clot expands. It vanishes when the thrombus completely occludes the vessel. Fig. 3 shows thrombin distribution (a) and platelets in the clot (b) at three consecutive moments of time. Thrombin distribution resembles that for the case of clot growth in a quiescent plasma, but here the flow breaks the symmetry of thrombin distribution by moving it downstream. The interaction of thrombin and platelets play an important role in clot growth. Thrombin activates platelets and promotes platelet attachment from the flow to the platelets in the clot. Platelet attachment and detachment will be discussed in more detail in the next section. On the other hand, the surface of activated platelets converts prothrombin into thrombin (similar to the vessel wall) reinforcing thrombin production. Thus, there is a positive feedback between thrombin generation and platelet aggregation. Hence, TNF-α reinforces platelet adhesion, especially when combined with IL-17.
Clot growth under the joint action of IL-17 and TNF-α. Thrombin distribution (a) and platelet aggregation (b) are shown at consecutive moments of time. The clot fills the whole vessel cross section leading to a complete vessel occlusion.
The dynamics of clot growth in normal and inflamed cases is shown in Fig. 4. In the normal case (without IL-17, TNF-α), the clot does not grow. Its grows rate is maximal under the joint action of the inflammation factors.
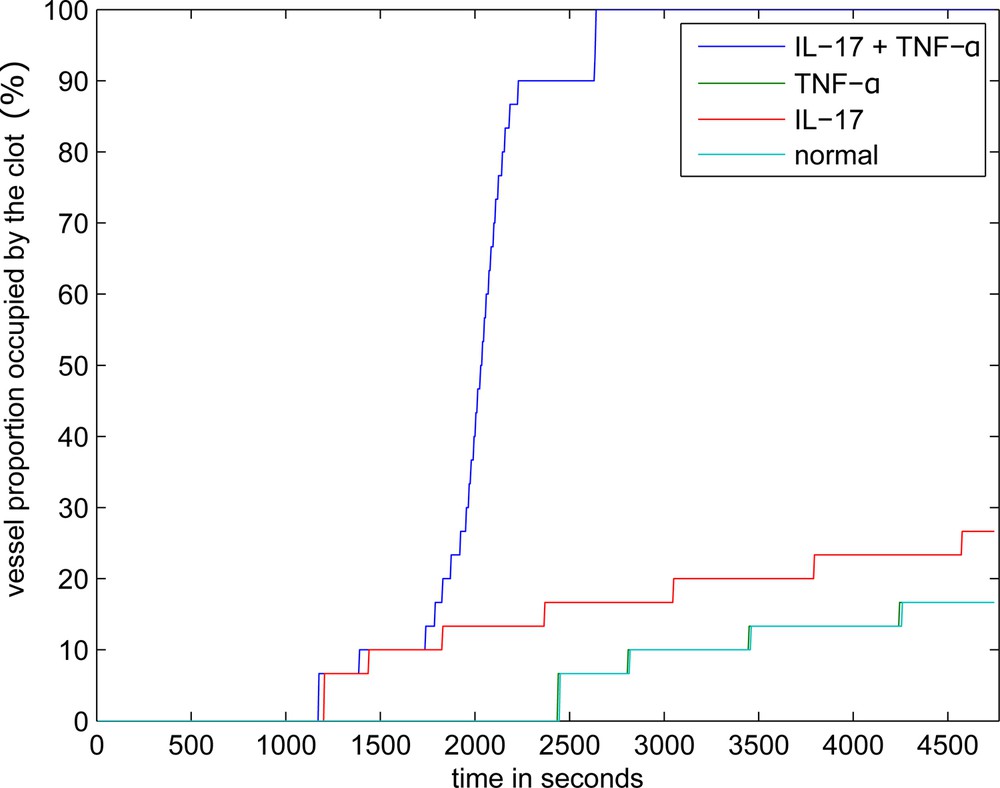
Dynamics of clot growth in the case of separate or joint action of IL-17 and TNF-α. TNF-α has no effect on thrombus development in quiescent plasma and when the inflamed tissue is sufficiently wide, the corresponding curve coincides with the normal case.
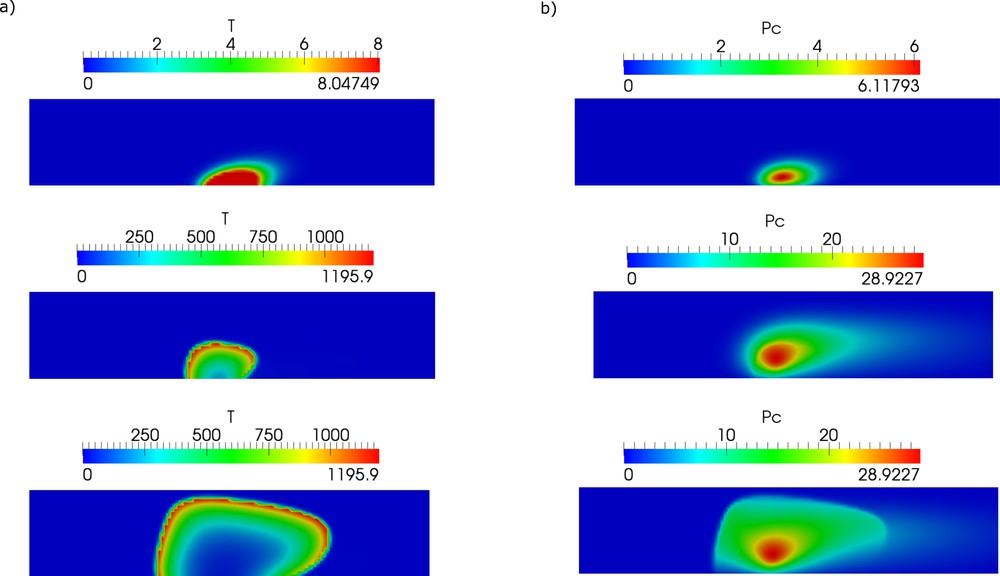
One of the important parameters that determine thrombus formation and growth is the size of the lesion and its evolution in time. There are some experimental data [31] confirmed by modeling [32,33] that show how the risk of vessel occlusion depends on the lesion size. However, it is not known how it grows in time in the case of chronic inflammation. Therefore, we vary this parameter in the model, and we observe its influence on thrombus growth (Fig. 5).
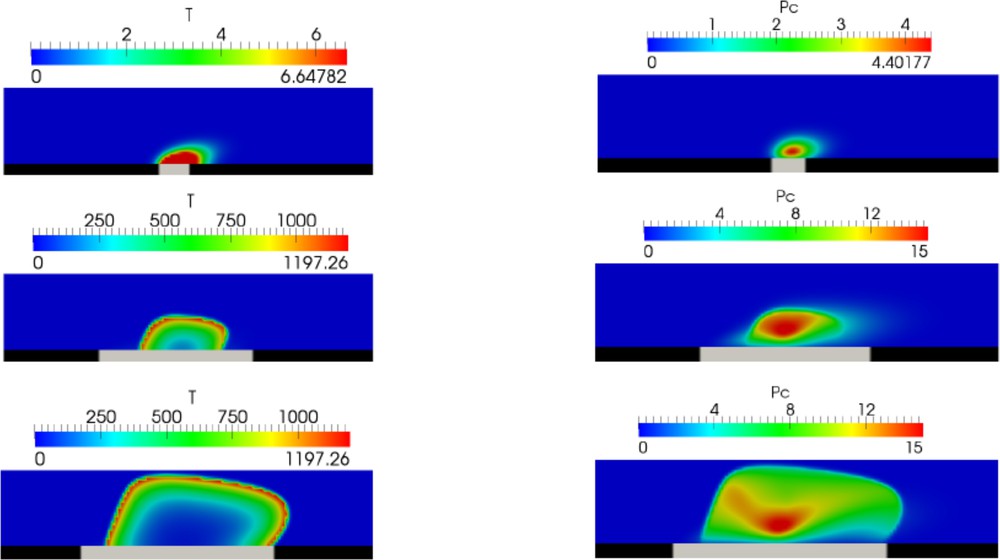
Snapshot of thrombin distribution (left column) and platelet aggregation (right column) for different sizes of lesions (grey interval at the vessel wall).
3 Platelet aggregation model
Clot growth consists of two main processes and of their interaction: biochemical reactions in blood plasma resulting in the production of fibrin polymer and platelet aggregation. Platelet aggregation is a complex multi-stage process that consists of different mechanisms. These mechanisms include platelet attachment to the clot and its possible detachment, platelet activation, different adhesion forces acting between platelets due to different receptors involved, platelet interaction with fibrin and some other blood factors. In order to study platelet aggregation in more detail, we use a DPD–PDE model developed in [29–35]. In this method, Dissipative Particle Dynamics (DPD) is used to describe the motion of the blood flow and of the platelets, while partial differential equations (PDE) are used for the concentration of blood factors in plasma.
This approach is more appropriate to study clot growth in arteries where the flow velocity is relatively high, and platelet aggregation becomes a dominant factor. We have shown in previous works [27,29] that initial platelet aggregate protects blood factors from the flow, allowing the initiation of fibrin production. On the other hand, fibrin clot reinforces platelet aggregate against the action of the flow.
Since platelets are considered as individual objects, their number and, consequently, the vessel diameter becomes a limiting factor for numerical simulations. In all presented simulations the diameter of the vessel was 50 μm, while the mean flow speed in the undisturbed flow was 12.5 mm/s. The diameter of platelets was set to 2 μm. The density and the viscosity of the simulated medium correspond to the density of viscosity of blood plasma [27,29,34]. A more complete list of values of model parameters is given in Table 1.
Values of all the parameters used in the continuous model.
| Simulation | Value | Unit | Description |
| h | 0.02 | mm | Space step |
| dt | 0.005 | s | Time step |
| Diffusion coefficients | Value | Unit | Description |
| D | 5 × 10⁻⁵ | mm2/s | Blood factors diffusion coefficient [9] |
| D p | 2.5 × 10⁻⁵ | mm2/s | Platelets diffusion coefficient [9] |
| Kinetic rates | Value | Unit | Reaction |
| k 1 | 5 × 10⁻⁷ | nM−1 s−1 | P activation by ϕc [9] |
| k 2 | 7.5 × 10⁻⁶ | nM−1 s−1 | P activation by Ba [10] |
| k 3 | 1.84 × 10⁻⁹ | nM−3 s−1 | P activation by T (fitted) |
| k 4 | 4.817 × 10⁻⁶ | nM−1 s−1 | T inactivation by A [11] |
| k 5 | 2.223 × 10⁻⁹ | nM−1 s−1 | Ba inactivation by A [11] |
| k 6 | 59 | s−1 | Fg activation by T [12] |
| K 6 | 3160 | nM | Substrate fibrin concentration [12] |
| k 7 | 0.1 | s−1 | F → Fp fibrin polymerization |
| k 8 | 0.17 | nM−1 | Factor V inactivation by Ca [13] |
| k 9 | 0.3 | nM−1 s−1 | Platelets activation by thrombin [14] |
| k 10 | 0.37 | nM−1 s−1 | Platelets activation by platelets [14] |
| 1.57 × 10⁻⁹ | nM−3 s−1 | P activation by T in the simplified model (fitted) | |
| k T | 1 × 10⁵ | nM−1 | T binding to TM |
| Kinetic constants | Value | Unit | Description |
| α 1 | 0.0015 | nM−1 s−1 | |
| β 1 | 0.225 | nM−1 | |
| α 2 | 9.4 | nM−1 s−1 | |
| β 2 | 100 | nM−1 | α2 = kc |
| ϕ max | 12 | nM | Maximal density of platelets |
| Initial concentrations | Value | Unit | Description |
| P 0 | 1400 | nM | Prothrombin concentration [10] |
| A 0 | 3400 | nM | Antithrombin concentration [10] |
| B 0 | 200 | nM | Sum of factors IX and X concentrations [10] |
| [VII] | 10 | nM | Factor VII concentration [10] |
| C 0 | 60 | nM | PC concentration [10] |
| Fg 0 | 7000 | nM | Fibrinogen concentration [10] |
| 10 | nM | Platelets density [10] | |
| 0.001 | nM | Activated platelets bound to the inflamed tissues [10] | |
| Flow properties | Value | Physical | Description |
| ρ | 1.06 × 10⁻⁶ | kg mm−3 | Blood density |
| ν | 3 | mm−2 s−1 | Blood viscosity |
| α | 100 × 10−6 | mm | Fiber radius |
| a | 5.6 × 10⁻⁴ | s mm−1 | Thrombin removal rate by flow in the simplified model (fitted) |
A typical clot structure is shown in Fig. 6a. There are three types of platelet connections, weak (light red lines between their centers), medium (dark red lines), and strong (black lines). Medium connections appear if platelets are weakly connected during the time period tc. Hence we model platelet activation and emergence of medium connections as a time delay. Platelets covered by fibrin are shown with dark green color, platelets not covered by fibrin with light green. Weak and medium platelet connection can be disrupted by flow. In this case, individual platelets or their aggregates can be detached and roll over the clot or leave the clot completely. Platelets covered by fibrin polymer (strong connection) cannot be detached.
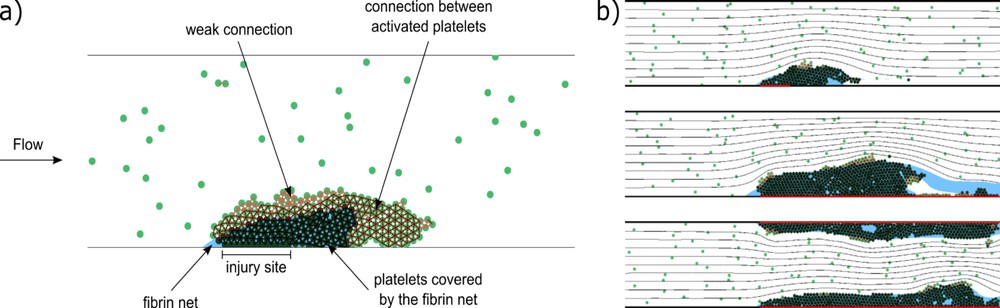
(a) A scheme of clot structure (snapshot from a simulation). The connections between platelets are shown as red intervals between their centers. Light red lines correspond to weak GPIb connections, dark red to medium connections between activated platelets, and black to strong connections between platelets covered by a fibrin net. Dark green platelets are covered by a fibrin net, which is shown in blue [34]. (b) Final stages of clot growth for different sizes of inflamed areas of vessel wall (shown in red). From top to bottom: short inflamed area at the bottom wall, long area at the bottom wall, long area at both walls. The black lines denote flow streamlines.
Fig. 6b shows results of simulations for three different cases of coagulation initiated by inflammation. The images show the final stages of clot growth for different sizes of inflamed areas. Inflamed parts of the vessel wall are shown in red. In the first case, the inflamed site is short and situated at the bottom wall. In the second and third cases, the inflamed site is longer, and is situated at the bottom wall and both walls respectively. In the second case, the clot was occupying the whole length of the inflamed site; however, a part of it has been detached by the flow.
In all three cases shown in Fig. 6b, the coagulation process and the platelet adhesion at the inflamed site result from the presence of IL-17 in blood at the critical concentration. Fig. 7 shows an example of evolution of a complete vessel occlusion under condition of reduced flow speed. In the simulation, both vessel walls are inflamed, resulting in platelet aggregation on both sides of the vessel, as blood clotting occurs at both vessel walls (the formation of the fibrin net).
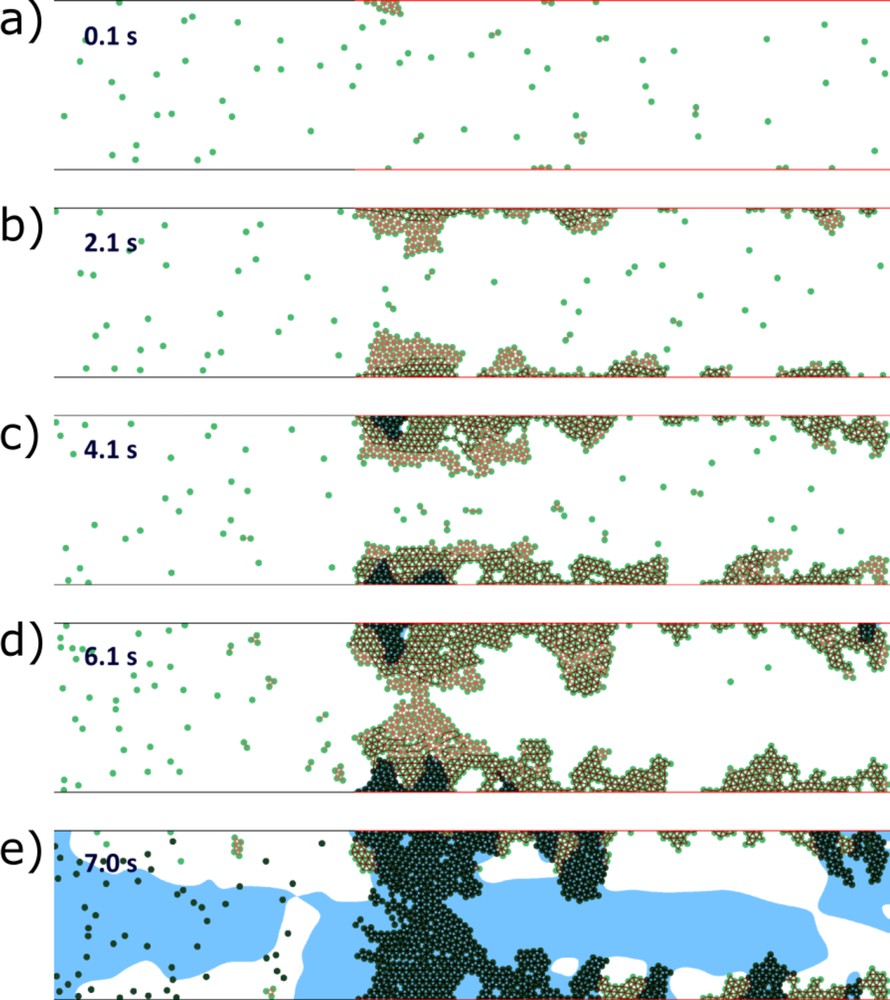
Vessel occlusion in the case of inflamed walls on both sides and of reduced flow speed. The inactivated platelets begin to aggregate at the inflamed parts of the vessel walls. After a short time delay, they activate and reinforce their connections (a and b). Flow velocity decreases inside the platelet aggregate, stimulating the accumulation of thrombin near the wall and production of fibrin polymer (c). The latter makes platelet connection unbreakable by the flow and leads to further growth of the platelet clot. The flow speed decreases, allowing thrombin production inside the vessel. Finally, the fibrin polymer fills the vessel, resulting in its complete occlusion (d and e). Green dots are platelets; the blue color shows the region with high concentration of fibrin polymer.
4 Conditions of occlusion
In this section, we reduce the complete model presented in the appendix to a simplified model that admits an analytical solution and explicit conditions of vessel occlusion:
- - the reaction–diffusion system of equations describing the distribution of blood factors is reduced to a single equation for thrombin concentration;
- - the blood flow velocity is approximated by the Poiseuille (parabolic) profile;
- - the distributions of factors IX and X initiating thrombin production near the vessel wall due to tissue factor are taken in the stationary form to which they converge after a long time;
- - the platelets are considered to be exclusively activated by soluble thrombin.
| (4.1) |
| (4.2) |
Eq. (4.1) is considered in the interval 0 < y < H, which corresponds to the cross section of the vessel, with the no-flux boundary conditions:
| (4.3) |
The simplified model gives a good approximation of the speed of clot growth in a quiescent plasma and of the conditions of vessel occlusion in flow [33,36]. In this work, we use this approach to study the influence of inflammation on clot growth. To further simplify the study, the activation of prothrombin by platelets will not be considered in what follows. Fig. 8 (left) shows a comparison of the thrombin distributions in the complete model (appendix) and in the simplified model (4.1) and (4.2). The distribution of thrombin propagates in space due to a self-accelerating cascade of coagulation reactions. In the case of the complete model (solid curves), the concentration of thrombin is measured at the center of the clot in the direction perpendicular to the vessel wall. Thrombin distribution has a specific form, with a maximum at the reaction front and with a gradual decay behind it, due to its elimination by antithrombin. The 1D model shows the same dynamics with the same speed of propagation, but the thrombin profile is monotone in space since the single equation model cannot describe the concentration decay. Except for this difference, it gives a good quantitative approximation of the complete model. Let us note that in the case under consideration, the value of parameter in the simplified model is fitted, since it effectively takes into account the influence of activated protein C on clot growth.
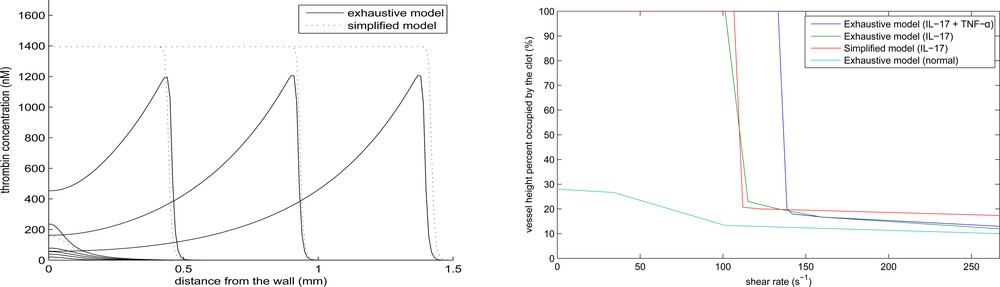
Thrombin distribution at successive moments of time in the complete model at the middle line of the clot perpendicular to the vessel wall (solid line) and in the one-dimensional approximate model (dashed line) (left). Final clot size as a function of the maximal flow velocity in the complete model (right).
In order to analyze clot growth described by Eq. (4.1), we begin with a particular case where the function Φ(T, y) is replaced by the function
| (4.4) |
| (4.5) |
Condition (4.5) shows the influence of the boundary and of the flow on clot initiation and propagation. The function Ba(y) describes the distribution of factors IX and X and their contribution to thrombin production. It increases the function Φ(T, y) near the wall and promotes the initiation of clot growth. However, it decays exponentially and its influence becomes negligible sufficiently far from the vessel wall. On the contrary, the flow velocity is low near the wall and attains its maximal value at the axis of the vessel. It decreases the function Φ(T, y), removing thrombin from the reaction zone. Therefore, the blood flow acts to stop clot growth. If I(H/2) ≤ 0, then the flow velocity is high enough to stop clot growth. Otherwise, clot overpasses the axis of the flow with the maximal flow velocity, and it continues to grow until it reaches the opposite vessel wall. This case corresponds to complete vessel occlusion.
The explicit form of the condition I(0) > 0 allows us to determine the critical concentration of tissue factor at the wall for which clot growth begins:
| (4.6) |
Next, we express from (4.5) the flow speed as a function of the space point y that stops clot growth:
| (4.7) |
We observe a sharp transition from the complete occlusion to a finite clot size with the increase of flow velocity. Such transition was also observed in in vitro experiments [31]. The combined effect of IL-17 and TNF-α acts more strongly to promote complete occlusion.
5 Discussion
This study quantifies the effects of IL-17 and TNF-α on thrombus development. In order to investigate the effects of these inflammatory cytokines on blood coagulability, we have firstly simulated thrombin generation tests for patients with RA, as described in another study [30], using a previously developed model of blood coagulation [37]. The obtained results were used to determine the levels of tissue factor, thrombomodulin, and CD39 expression in RA patients compared to healthy individuals. These levels were incorporated into two different models of blood clotting to describe the spatiotemporal dynamics of clot growth during inflammatory diseases. As expected, numerical simulations using both models show that blood hypercoagulability, caused by inflammatory cytokines, can lead to thrombosis and vessel occlusion. Especially when the actions of IL-17 and TNF-α are combined.
To examine the association between inflammatory diseases and deep venous thrombosis, we have studied the dynamics of clot growth under venous flow conditions. In such conditions, platelets recruitment and detachment do not play a major role in the pathogenesis of thrombosis. Hence, we have used a continuous modeling approach to describe the blood flow as well as the distributions of clotting factors and the density of platelets. One of the key features of this model is that it can be reduced to a single equation model that has approximately the same solution. In addition, the reduced model sustains analytical investigation and provides the exact patho-physiological conditions of clot growth initiation and vessel occlusion. Among the conclusions derived from both numerical simulations and analytical results, we observe that the individual action of TNF-α is not sufficient to ensure the occlusion of the vessel. On the other hand, the individual action of IL-17 may trigger venous occlusion when the size of the inflamed tissue is sufficiently large. Overall, the model predicts a higher chance of vascular occlusion when the actions of IL-17 and TNF-α are combined, which is in a good agreement with available clinical data [1,2].
Since platelets aggregation play a key role in the pathogenesis of arterial thrombosis, we have used a different model to describe the effects of IL-17 and TNF-α on clot growth in arteries. The DPD–PDE model, which uses a particle method to describe the interaction between flow and platelets, is a realistic representation of the dynamics of thrombus development under high shear flow. In such hemodynamical conditions, thrombin is washed out by flow, but platelets still manage to aggregate and form unstable clots known as white thrombi. The development of these aggregates is reinforced by IL-17 and TNF-α due to the overexpression of CD39, which ultimately results in the obstruction of the blood flow by the platelet plug. Only then, the fibrin polymer mesh can expand and solidify the thrombus. A comparison of the two models indicates that the upregulation of CD39 expression due to IL-17 and TNF-α is more crucial in the formation of arterial thrombi than venous ones.
Although the models presented in this study provide key insights into the development of thrombosis during RA and other inflammatory diseases, they are still based on several assumptions. Some of these assumptions concern the coagulation cascade, a concept that was first introduced as ‘Y’-shaped waterfall where the intrinsic and the extrinsic pathways come together into a common pathway, leading to the production of thrombin and the subsequent generation of the fibrin mesh [38]. We reduced it in order to capture the essential dynamics of blood clotting when initiated by the extrinsic pathway. In this regard, the amplification phase was assumed to depend solely on thrombin, while in reality, it involves other factors such as V, VIII, XI, and XII. Furthermore, in both models, we consider the vessel walls to be rigid and the blood flow to be driven by a constant nonpulsatile pressure difference. These simplifications were necessary since the main objective of this study is to quantify the effects of inflammatory cytokines and not to study the interactions between thrombus formation, the blood flow, and the vessel walls. We also consider a constant blood flow rate instead of pulsatile one. Blood flow pulsations have high frequency compared to the characteristic time of clot growth. So we expect that an averaged flow velocity can give a good approximation. However, this is not yet verified in the DPD–PDE model. Flow pulsations can influence platelet aggregation and activation. We will introduce blood pulsations in the forthcoming works. Moreover, we restrict the present study to 2D modeling of thrombus formation. The development of 3D models of thrombus formation requires the implementation of different numerical methods than the ones used for the discretization of the current models. It also requires the numerical validation through comparison with the 2D model results. These questions will be addressed in a subsequent work. Finally, in the present study, we identify inflammatory diseases effects on blood clotting by the exclusive actions of IL-17 and TNF-α, while in reality, these diseases alter the levels of other clotting factors such as factor VII and I, among others [39]. The quantification of such mechanisms does not fall into the scope of the present study.
While each of the two models presented in this work has its strengths and disadvantages, both of them are necessary to quantify the procoagulant roles of IL-17 and TNF-α in different contexts. The development of these models was inspired by existing experimental studies. However, in order to fully understand and quantify the association between inflammation and thrombosis, more studies combining clinical experiments and numerical simulations are necessary. In particular, the development of a systems biology framework is essential for building more validated mathematical models that can be used to accurately predict the risk of thrombosis in individual patients.
Arterial thrombosis basically occurs due to the rupture of a atherosclerotic plaque, while venous thromboembolism is mostly related to stasis, hypercoagulation, and endothelial damage [40]. This difference is probably related to different hemodynamic conditions in veins, arteries, including blood flow velocity and blood pressure [41]. In both cases, RA and PsA can trigger endothelial inflammation, resulting in plaque formation in arteries and thromboembolism in veins. Further development of the disease depends on the size of the lesions. Mathematical modeling of atherosclerosis shows that inflamed region grows in time as a reaction-diffusion wave [42–45]. It is followed by vessel remodeling and possible plaque rupture due to its interaction with the blood flow.
Plaque formation in the case of arterial inflammation is much slower than thrombus formation. However, a high flow velocity can prevent thrombus formation. A slower blood flow in veins allows thrombus initiation, and the latter probably prevents plaque formation.
The approximate analytical model does not contain explicitly the lesion size. It is present implicitly in the parameters of the model characterizing the rate of thrombin production. Since this simplified model gives a good approximation of the complete model, then we can expect that it can be used to predict thrombosis development in individual patients. This approach can also be used to model thrombosis treatment [46].
Classical CV risk factors related to obesity, hypertension, smoking, etc., have been identified for a long time. Such conclusion has been obtained from the study of long-term cohorts, the most famous cohort being that used for the Framingham study. However, these studies have their own limitations including their descriptive nature and the limitations to provide explanations for the observed changes. One way to provide such answers is to use cohorts from conditions where the CV risk is increased. This will reduce the follow-up duration. At the same time this will allow the collection of biosamples for better biological studies.
Acknowledgements
The last author was partially supported by the Ministry of Education and Science of the Russian Federation (agreement number 02.a03.21.0008).
Appendix A Mathematical model
A.1 PDE model
A.1.1 Reaction-diffusion equations for blood factors
We extend a previously developed model of clot growth dynamics [1,2] to include the aggregation of platelets. The model consists of reaction-advection-diffusion equations describing the spatiotemporal distributions of blood coagulation factors during thrombus development:
Prothrombin
| (A.1) |
| (A.2) |
| (A.3) |
| (A.4) |
| (A.5) |
| (A.6) |
| (A.7) |
| (A.8) |
| (A.9) |
| (A.10) |
Here is flow velocity, D is the diffusion coefficient, which is taken the same for all proteins, and k(ϕc)Dp is the effective diffusion coefficient for platelets, where a decreasing function. Fibrin polymer forms a solid clot, it does not diffuse and it is not transported by flow.
A.1.2 Boundary conditions
In order to describe the generation of thrombin in the initiation phase at the damaged endothelial wall, we consider the complex Tf* formed by the tissue factor and factor VII. Factors IX and X interact with this complex due to a surface reaction. They come from the bulk solution being inactive, form a complex Tf*B with TF* and return to the solution in the active form. The reaction rate for the surface concentration of this complex can be written as follows:
| (A.11) |
The boundary conditions for the variables B and Ba at the damaged surface are as follows:
| (A.12) |
In order to simplify the boundary conditions, let us introduce the variable z = B + Ba. From Eq. (A.12) and the boundary conditions for B and Ba we get:
| (A.13) |
| (A.14) |
Protein C is activated by the complex of thrombin-thrombomodulin. The fluxes of protein C at the surface in its active and inactive forms are given as follows:
| (A.15) |
| (A.16) |
A.1.3 Blood flow model
To incorporate the action of blood flow on clot growth, we use the Navier–Stokes equations to describe the dynamics of blood flow in the vessel.
| (A.17) |
| (A.18) |
The effects of red blood cells (RBCs) on thrombus formation are taken implicitly through the choice of viscosity similarly to the other continuous models of thrombus growth. RBCs and fibrin are the main components of venous thrombus. For this reason, we refer to those thrombi as red clots due to the red color of RBCs. RBCs exhibit two features that have an impact on the rheology of the blood. First, RBCs aggregate under low shear flow and form stacks due to their discoid shape. This increases the overall viscosity of the blood flow [4]. The other mechanical property of RBCs is their deformability under high shear flows. This property has an adverse effect on the viscosity of the blood flow with respect to RBCs aggregation. The influence of RBCs can be properly captured using cell-based models of blood flow. In such models, blood is described as a heterogeneous fluid consisting of both plasma and blood cells. These models become complex and computationally expensive. To our knowledge, a model that considers the effects of RBCs on thrombus growth in flow does not exist yet due to the complexity of such modeling.
We prescribe the no-slip boundary conditions for the velocity at the upper and lower walls, and periodic boundary conditions in the axial direction. The blood flow is driven by the pressure difference. Therefore, we use periodic boundary conditions for velocity coupled with a constant pressure difference condition:
| (A.19) |
A.1.4 Model reduction
Let us consider the simplified model:
| (A.20) |
| (A.21) |
| (A.22) |
| (A.23) |
| (A.24) |
| (A.25) |
Under the assumption of detailed equilibrium (large reaction constants) we express the variables from Eqs. (A.20)–(A.23):
| (A.26) |
| (A.27) |
A.1.5 Model parameters
A.2 PDE-DPD model
A.2.1 DPD submodel
Dissipative particle dynamics is a mesoscale method in the sense that each DPD particle describes some small volume of a simulated medium rather than an individual molecule [16,18,19]. There are conservative, dissipative, and random forces acting between every two particles:
| (A.28) |
| (A.29) |
It is important to note that all forces between particles are pairwise. Therefore, if we take a closed volume, then all forces between the particles inside it are cancelled. Only the forces from the particles outside act on the volume. These properties characterize hydrodynamics and allow the derivation of macroscopic equations of motion. Under the appropriate choice of parameters, DPD gives results similar to the Navier–Stokes equations, but is much less computationally expensive. Hence, its applications become justified for simulating complex heterogeneous media [15,16].
A.2.2 Platelet aggregation submodel
In order to describe platelets and their aggregation in flow, we consider that some of the particles in the DPD description of the medium are platelets, while other particles simulate lumps of blood plasma. Platelets still remain DPD particles in the sense that DPD forces remain acting on platelets; however, we apply additional rules of interaction between platelets themselves.
First we consider that platelets cannot cross each other, unlike plasma particles, which can pass one through another because of the finite potential force acting between them. In order to prevent platelets from passing through each other, we will introduce an additional linear potential force between them:
| (A.30) |
Next, we describe platelet aggregation – when two platelets come in physical contact, i.e. the distance between their centers is less then the platelet's diameter (rij < dP), they establish a weak adhesive connection. Platelet aggregation can be strengthened through the process of platelet activation, during which platelets go through physical changes, developing a pseudopod stellar shape. Moreover, activated platelets initiate the activation of surrounding aggregated platelets. The platelet activation therefore increases stability of the platelet aggregate on the injury site. However, the last step of the clot stabilisation is the result of the coagulation pathways. Fibrin monomers, which are synthesized at the injury site, polymerize, creating a so-called fibrin net, which together with aggregated platelets forms the blood clot, making the aggregate more stable. The stable blood clot then gives time for the underlying tissue to heal.
In order to describe different types of adhesion between platelets, we introduce an adhesion force that acts between connected platelets:
| (A.31) |
| (A.32) |
Dissipative Particle Dynamics (DPD) is not a deterministic method due to the random forces between particles. Hence, it is possible to obtain different outcomes when running two numerical simulations with the same sets of parameters. However, the qualitative results of the model remain the same and significant changes of the simulation outcome only occur when parameters are changed. We have presented a detailed sensitivity analysis for the different parameters used in the model in previous works [21,22].
The DPD–PDE model is based on a sophisticated coupling of the DPD method and the resolution of PDEs. This coupling consists in running the two components in parallel and then proceeds to the exchange of data between them. PDEs are solved numerically on a fine using the finite difference method. An accurate quadratic bilinear interpolation is used to compute the concentration of fibrin on the coordinates of each particle. The same interpolation is used to calculate the flow velocity in the PDE mesh.
A.2.3 PDE submodel
Equations for the concentrations of blood factors are similar to the equations presented in Section A.1.1. It is assumed here that the concentration of antithrombin is in excess, and its variation is neglected. The influence of IL-17 and TNF-α on the coagulation cascade is taken into account through the boundary conditions (Section A.1.2). Parameter values used in the DPD and PDE submodels are provided in Table 2.
Values of all fixed parameters in the basic simulation with the DPD–PDE model.
| Domain | Value | Physical | Description |
| L | 250 | 250 μm | Length of the simulated blood vessel |
| D | 50 | 50 μm | Diameter of the simulated blood vessel |
| G x | 7200 | 72 m/s2 | External force in x direction used to induce flow |
| 187.5 | 18.75 mm/s | Average flow velocity | |
| 1500 s−1 | Wall shear rate | ||
| DPD | Value | Physical | Description |
| a ij | 600,000 | Conservative force coefficient | |
| γ | 3550 | Dissipative force coefficient | |
| σ | 20,000 | Random force coefficient | |
| r c | 5 | Force cut-off radius | |
| k B T | 1 | The Boltzmann constant times temperature | |
| n | 0.36 | Particle number density | |
| m | 0.463 | Particle mass | |
| dt DPD | 0.001 | DPD time step | |
| Other | Value | Physical | Description |
| 3 × 10⁶ | 0.3 nN | Weak inter-platelet bond coefficient | |
| 8 × 10⁶ | 0.8 nN | Activated inter-platelet bond coefficient | |
| 1 × 10⁸ | 10 nN | Fibrin net reinforced bond coefficient | |
| t c | 10 | 0.1 s | Platelet activation period |
| τ | 10 | 0.1 s | DPD–PDE data exchange period |
| p | 0.017 | 3.672 × 10¹² L−1 | Platelet frequency |
A.3 A comparative study of arterial thrombus simulation using the continuous and the DPD–PDE models
The mechanisms involved in the development of arterial thrombosis differ from those driving the growth of venous thrombosis. In arterial thrombosis, the high shear flow washes away thrombin and prevents the generation of the fibrin mesh. In this context, platelets are still able to attach to the subendothelium and form a plug. To test the ability of the continuous model in reproducing the dynamics of platelet plug formation, we consider that the porosity of the plug depends solely on the density of platelets in the plug [3]:
| (A.33) |
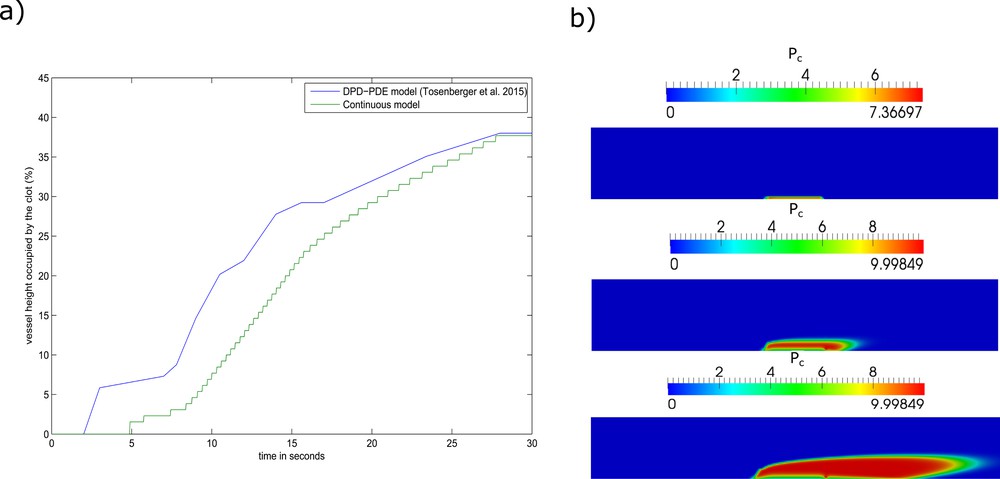
Numerical simulations of arterial thrombus formation using the continuous model. (a) The vessel height occupied by the platelet plug over time. (b) Screenshots of the simulation corresponding to the t = 5 s (top), t = 10 s (middle), t = 20 s (bottom).
References of the Appendix
- [1] A. Bouchnita, A. Tosenberger, V. Volpert, On the regimes of blood coagulation, Appl. Math. Lett. 51 (2016) 74–79.
- [2] A. Bouchnita, T. Galochkina, P. Kurbatova, P. Nony, V. Volpert, Conditions of microvessel occlusion for blood coagulation in flow, Int. J. Numer. Methods Biomed. Eng. (2016).
- [3] A.R. Wufsus, N.E. Macera, K.B. Neeves, The hydraulic permeability of blood clots as a function of fibrin and platelet density, Biophys. J. 104 (8) (2013) 1812–1823.
- [4] O.K. Baskurt, H.J. Meiselman, Blood rheology and hemodynamics, Semin. Thromb. Hemost. 29 (5) (2003) 435–450.
- [5] V.I. Zarnitsina, A.V. Pokhilko, F.I. Ataullakhanov, A mathematical model for the spatio-temporal dynamics of intrinsic pathway of blood coagulation. II. Results, Thromb. Res. 84 (5) (1996) 333–344.
- [6] Y.V. Krasotkina, E.I. Sinauridze, F.I. Ataullakhanov, Spatiotemporal dynamics of fibrin formation and spreading of active thrombin entering non-recalcified plasma by diffusion, Biochim. Biophys. Acta (BBA): Gen. Subj. 1474 (3) (2000) 337–345.
- [7] T. Galochkina, A. Bouchnita, P. Kurbatova, V. Volpert, Reaction-diffusion waves of blood coagulation, Math. Biosci. 288 (2017) 130–139.
- [8] A. Bouchnita, T. Galochkina, V. Volpert, Influence of antithrombin on the regimes of blood coagulation: insights from the mathematical model, Acta Biotheor. 64 (4) (2016) 327–342.
- [9] K. Leiderman, A.L. Fogelson, Grow with the flow: a spatial-temporal model of platelet deposition and blood coagulation under flow, Math. Med. Biol. 28 (1) (2011) 47–84.
- [10] M.F. Hockin, K.C. Jones, S.J. Everse, K.G. Mann, A model for the stoichiometric regulation of blood coagulation, J. Biol. Chem. 277 (21) (2002) 18322–18333.
- [11] E.M. Wiebe, A.R. Stafford, J.C. Fredenburgh, J.I. Weitz, Mechanism of catalysis of inhibition of factor IXa by antithrombin in the presence of heparin or pentasaccharide, J. Biol. Chem. 278 (37) (2003) 35767–35774.
- [12] M. Tsiang, L.R. Paborsky, W.X. Li, A.K. Jain, C.T. Mao, K.E. Dunn, D.W. Lee, S.Y. Matsumura, M.D. Matteucci, S.E. Coutré, L.L. Leung, C.S. Gibbs, Protein engineering thrombin for optimal specificity and potency of anticoagulant activity in vivo, Biochemistry 35 (51) (1996) 16449–16457.
- [13] S. Solymoss, M.M. Tucker, P.B. Tracy, Kinetics of inactivation of membrane-bound factor Va by activated protein C. Protein S modulates factor Xa protection, J. Biol. Chem. 263 (29) (1988) 14884–14890.
- [14] A.L. Kuharsky, A.L. Fogelson, Surface-mediated control of blood coagulation: the role of binding site densities and platelet deposition, Biophys. J. 80 (3) (2001) 1050–1074.
- [15] D.A. Fedosov, I.V. Pivkin, G.E. Karniadakis, Velocity limit in DPD simulations of wall-bounded flows, J. Comput. Phys. 227 (4) (2008) 2540–2559.
- [16] R.D. Groot, P.B. Warren, Dissipative particle dynamics: bridging the gap between atomistic and mesoscopic simulation, J. Chem. Phys. 107.11 (1997) 4423–4435.
- [17] M.M. Kamocka, J. Mu, X. Liu, N. Chen, A. Zollman, B. Sturonas-Brown, K. Dunn, Z. Xu, D.Z. Chen, M.S. Alber, E.D. Rosen, Two-photon intravital imaging of thrombus development, J. Biomed. Opt. 15 (1) (2010) 016020-016020.
- [18] M. Karttunen, I. Vattulainen, A. Lukkarinen, A Novel Methods in Soft Matter Simulations, Springer, Berlin, 2004.
- [19] S.Y. Trofimov, Thermodynamic Consistency in Dissipative Particle Dynamics, Eindhoven University Press, 2003.
- [20] S. Falati, P. Gross, G. Merrill-Skoloff, B.C. Furie, B. Furie, Real-time in vivo imaging of platelets, tissue factor and fibrin during arterial thrombus formation in the mouse, Nat. Med. 8 (10) (2002) 1175–1180.
- [21] A. Tosenberger, F. Ataullakhanov, N. Bessonov, M. Panteleev, A. Tokarev, V. Volpert, Modelling of thrombus growth in flow with a DPD–PDE method, J. Theor. Biol. 337 (2013) 30–41.
- [22] A. Tosenberger, F. Ataullakhanov, N. Bessonov, M. Panteleev, A. Tokarev, V. Volpert, Modelling of platelet-fibrin clot formation in flow with a DPD–PDE method, J. Math. Biol. 72 (3) (2016) 649–681.