

1 Introduction
Assuming that the 2-[18F]fluoro-2-deoxy-d-glucose (18F-FDG) is trapped in cancer cells in an irreversible manner, PET-scan allows quantification of the metabolic rate of glucose in tumours, by several methods that aimed at quantifying the 18F-FDG uptake rate [1–5]. Is the irreversibility of the 18F-FDG uptake an oversimplification? Usually, most biological reactions do not occur in a completely irreversible manner, which has been clearly established in neuroreceptor quantification models [6]. Moreover, in the particular case of 18F-FDG PET imaging, the tracer metabolism by hepatic tumours challenges this notion of irreversibility [7]. A first quantification method of the 18F-FDG release rate constant has been proposed by Phelps et al. [8], as an extension of Sokoloff's model [1]. Then, Patlak has proposed a graphical method for reversible tracers [2], as an extension of his previous method for irreversible ones. These latter methods both require a dynamic acquisition, which is achieved during the first hour after the tracer injection, and an invasive blood tracer sampling.
The aim of this theoretical work is to propose a graphical method allowing for the assessment of the 18F-FDG release in tissues, on certain conditions, but without needing any blood tracer sampling. It is an extension of a recently published method that aimed at quantifying the rate constant for an irreversible tracer uptake [5]. It requires the acquisition of a dynamic PET scan at the later decreasing phase of the tissue tracer activity. Both a two-compartment and a three-compartment model are developed, and simulated data are provided.
2 Two-compartment model
Let us consider the 18F-FDG uptake from blood to an intracellular compartment (Fig. 1a). The 18F-FDG uptake rate constant is K, and the 18F-FDG release rate constant is
| (1) |
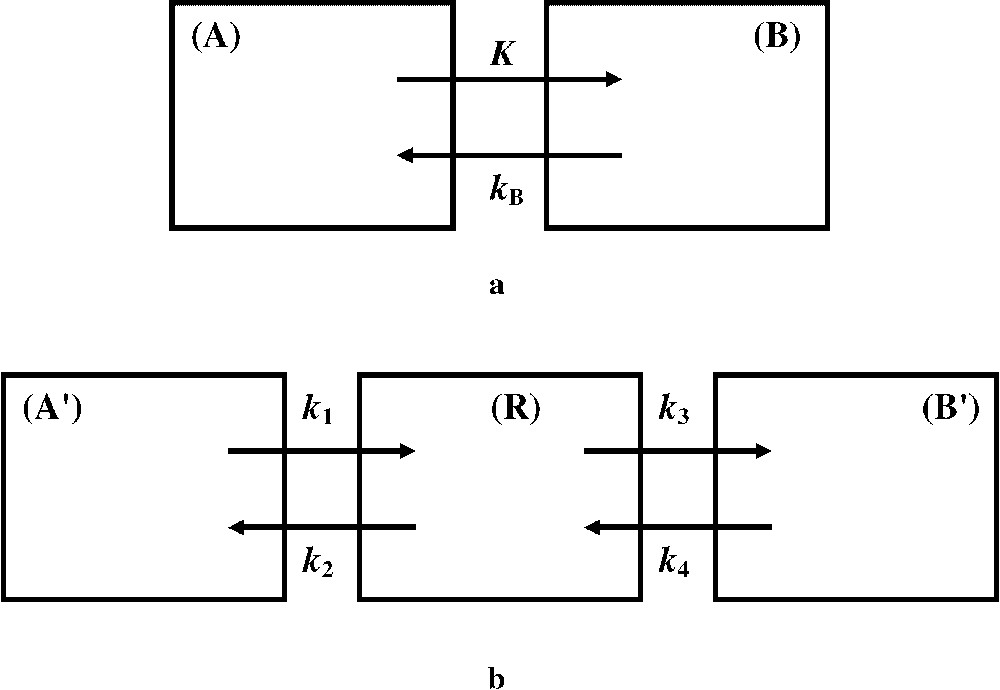
(a) The two-compartment model roughly considers compartments (A) and (B), which involve blood free 18F-FDG and 18F-FDG trapped in intracellular cytoplasm, respectively. The 18F-FDG uptake and release rate constants, K and
(a) The two-compartment model roughly considers compartments (A) and (B), which involve blood free 18F-FDG and 18F-FDG trapped in intracellular cytoplasm, respectively. The 18F-FDG uptake and release rate constants, K and
In patients with a normal renal and hepatic function, the time duration required to reach the steady state is estimated to last about 5 min [3], and the amount of the tracer that accumulates in the tissue during this time duration is assumed to be negligible in comparison with that which accumulates during the whole examination. Moreover, for simplicity, let us assume that the 18F-FDG blood time-activity curve (TAC) exponentially decays with a mean constant α, after the peak (see simulated data for a multiexponential decay). In a nearly similar manner to that used in a previous work on 18F-FDG (irreversible) uptake [5], when
| (2) |
Eq. (2) is very similar to that of a radioactive chain equation, but with a whole decay constant equal to
| (3) |
Eq. (3) shows that a single exponential fitting to the later phase of the 18F-FDG TAC can provide the release rate constant
| (4) |
| (5) |
3 Three-compartment model
In a three-compartment model (Fig. 1b), the 18F-FDG transport rate constants between the compartments are different from those of a two-compartment model (Fig. 1a). However, relationships can be established [2]:
| (6) |
| (7) |
Following Patlak [2], let us suppose that
| (8) |
| (9) |
| (10) |
| (11) |
| (12) |
| (13) |
| (14) |
This result justifies that in Eq. (10) the second term of the right-hand side can be considered much lower than the first one. Furthermore, introducing Eq. (14) into Eq. (10) and rearranging yields the following expression for the trapped tracer activity:
| (15) |
| (16) |
Furthermore, Eq. (17) hereafter shows that the transport rate constants available from Eqs. (15) and (16),
| (17) |
4 Simulated data
The proposed two-compartment model assumes, for simplicity, that the 18F-FDG blood TAC decays with a mean constant α. However, it has been shown that the 18F-FDG plasma clearance was multi-exponential, i.e. that the input function (IF) was three-exponential [9]. When such an IF is taken into account, Eq. (2) becomes:
| (18) |
Fig. 2 shows simulated data from Eq. (18) and references [9,10], for different values of
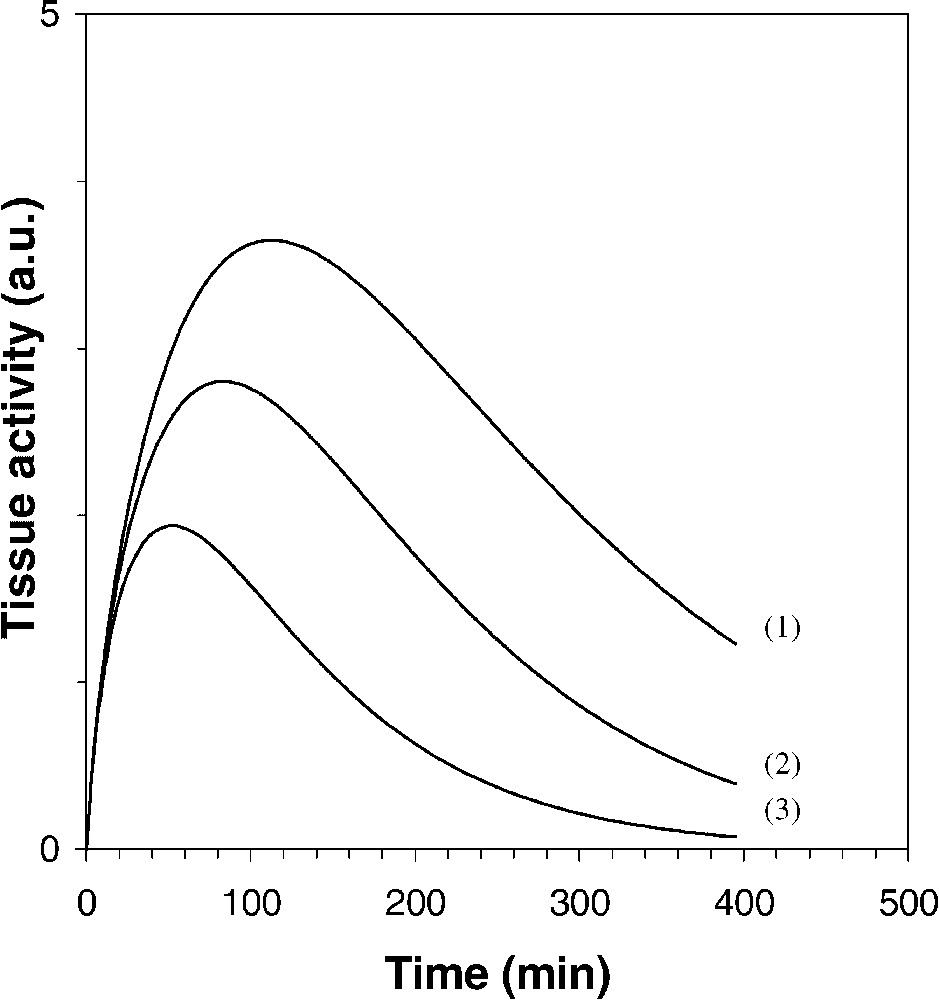
Simulation of the tissue 18F-FDG TAC in a two-compartment model (Eq. (18)), for different values of
Simulation of the tissue 18F-FDG TAC in a two-compartment model (Eq. (18)), for different values of
The greater the constant
| (19) |
From data involved in curve 3 of Fig. 2 (
5 Discussion
Without needing any blood tracer sampling, when hydration and/or phlorizin injection are applied after the routine static PET acquisition, a two-compartment model analysis allows us to quantify the 18F-FDG release rate constant
From Eq. (18) and literature data [9–11], Fig. 2 shows quite different 18F-FDG tissue TACs, related to different values of
In conclusion, the principle of a graphical analysis that aimed at quantifying the rate constant for 18F-FDG release in tissues is presented, which is an extension of a recently published method for assessing the tracer uptake rate [5]. This whole method emphasizes the interest of the later decreasing phase of the 18F-FDG activity in tissues.
Acknowledgement
The authors wish to thank Schering-CISbiointernational for helpful discussion, and H. Dupouy and I. Hessling for technical assistance. They also thank an anonymous reviewer for his comments on the manuscript.
Vous devez vous connecter pour continuer.
S'authentifier