

1 Introduction
Chondrichthyan systematics and taxonomy has gone through a recent upsurge in new species discovery [2,3], although a factor that may soon hamper the endeavour of describing Chondrichthyan biodiversity could be the trend towards local extinction of species in this phylum [4]. This is especially crucial in poorly surveyed, species-rich regions of the world like the Indo-Malay-Papua archipelago [2,5,6], where fishing is mostly unregulated and vulnerable Chondrichthyan populations are unmonitored [6–8]. Stingrays (Myliobatoidei, including Dasyatidae [9]) are particularly at risk of population depletion: they grow and mature slowly, have low fecundity, and most of the species in the Dasyatidae family dwell in the shallow coastal habitats which are particularly exposed to overfishing and habitat degradation [7,10–13].
A recent taxonomic revision of ocellated whiprays in the ‘Himantura uarnak’ species complex (Dasyatidae) has helped clarify the nomenclature in this group [14]. In this revision, the authors showed that a widespread leopard-spotted species formerly, erroneously identified as “Himantura undulata” [15,16] was in fact a distinct, undescribed species, Himantura leoparda Manjaji-Matsumoto and Last, 2008 [14]. The authors also synonymized Himantura fava (Annandale, 1909) [17] with H. undulata (Bleeker, 1852) [18] and maintained H. uarnak (Forsskål, 1775) [19] as another valid species in this group. The three species have been said to “differ subtly” in squamation and body shape, and by the ontogeny of colour patterns [14]. Subsequently, nuclear genetic markers have helped demonstrate that ocellated whiprays within the H. uarnak species complex comprised at least four biological species sensu [20]: H. uarnak, H. undulata, and two cryptic species within H. leoparda [1]. Four mitochondrial clades were also observed (Fig. 2 of [1]), that fully correlated with the four clusters.
The objectives of the present paper were:
- • to investigate whether the two cryptic species currently under H. leoparda could or could not be distinguished by their spotting patterns;
- • to determine which of the two species should retain the name H. leoparda;
- • to provide a diagnostic description of the other species.
In the process, we determined the nucleotide synapomorphies in the partial cytochrome-oxidase I (COI) gene sequence, the universal barcode in fishes [21], that distinguish species within the H. uarnak species complex.
2 Materials and methods
2.1 Nucleotide sequences
Arlyza et al. [1] have provided two phylogenetic trees of the H. uarnak species complex, one based on the nucleotide sequence of a 620-base pair (bp) fragment of the COI gene, and the other one based on the nucleotide sequence of a 239-bp fragment of the cytochrome b (cytb) gene. Most of the COI gene sequences of [1] were of individuals also scored at nuclear loci; the cytb gene sequence dataset also included a number of reference specimens from the literature that could not be directly assigned to a nuclear cluster.
At the time Arlyza et al.’s paper [1] was in press, additional COI gene sequences of an undetermined species of the H. uarnak species complex (eventually identified as H. uarnak by the authors) were produced within the frame of a barcoding study of stingrays from the continental shelf off northwestern Australia [22]. Table 1 lists the specimens characterized by their COI gene sequences that were used for the present work, including those of [22].
Himantura uarnak species complex. Material examined for nucleotide variation at the COI locus. Nucleotide sequences and ancillary information were retrieved from [1,22] and from the BOLD [23] and GenBank (http://www.ncbi.nlm.nih.gov/) databases. Tissue samples of Individuals ir001–ir037, ir039–ir067, and ir069–ir113 are currently preserved at LIPI-P2O laboratories in Jakarta. Cluster as defined in [1].
| Species (cluster), Individual No. | Sampling location | Sampling date | Voucher | GenBank No. |
| H. leoparda (Cluster 4) | ||||
| BOLD TZMSC232-05 (misidentified as ‘H. uarnak’) | Cape Vidal, Kwazulu-Natal, SW Indian O. | November 2004 | ADC 30.10-1 (tissue voucher) | JF493652 |
| BOLD TZMSC474-05 (misidentified as ‘H. uarnak’) | Cape Vidal, Kwazulu-Natal, SW Indian O. | May 2005 | Smith 30.10-2 (tissue voucher) | JF493651 |
| ir003, ir004, ir008-023, ir025, ir027, ir028, ir030-036, ir039–042, ir046, ir048, ir050, ir051, ir053, ir054, ir057–067, ir069–072, ir074, ir075, ir077, ir078 | Batang, Java Sea d | June 2006–January 2008 | – | JX263361 – JX263417 |
| ir087 | Sunda Strait | October 2010 | – | JX263418 |
| H. tutul sp. nov. (Cluster 1) | ||||
| zan6 | Pemba Island, W Indian Ocean | May 2010 | MNHN-ICTI5184 | JX263335 |
| ir001, ir002, ir005, ir006, ir024, ir026, ir029, ir037, ir043-045, ir047, ir049, ir052, ir055, ir056, ir073, ir076, ir079-085 | Batang, Java Sea d | June 2006–January 2008 | – | JX263306 – JX263330 |
| ir086, ir088 | Sunda Strait | October 2010 | – | JX263331, JX263332 |
| ir112 | Bali Sea | February 2010 | – | JX263333 |
| ir113 | Southern coast of Java off Jogyakarta | October 2010 | – | JX263334 |
| H. uarnak (Cluster 3) | ||||
| wjc 637 | Taichung, Taiwan, China Sea | January 2011 | NMMBP 015601 | JX263360 |
| ir 089-099 | Makassar Strait | November 2009 | – | JX263337 – JX263347 |
| ir100-106 | Bone Basin off Selayar Island, Banda Sea | November 2009 | MZB 20875 (LIPI 4419) | JX263348 – JX263354 |
| ir107-109 | Kendari, Banda Sea | October 2010 | – | JX263355 – JX263357 |
| ir110, ir111 | Labuan Bajo, Flores Sea | October 2010 | – | JX263358 – JX263359 |
| 16 individuals [22] | Ningaloo Reef, NW Australia | – | – | JQ765509, JQ765519–JQ765530 JQ815394, JQ815395, JQ929047 |
| H. undulata (Cluster 2) | ||||
| BOLD AAF0692 (labelled ‘H. fava’) | Sandakan, Sulu Sea | April 1996 | BW-A221 (tissue voucher) | DQ108167 |
| ir007 | Batang, Java Sea d | June 2006–January 2008 | – | JX263336 |
| H. gerrardi (outgroup) | ||||
| wjc623, wjc624 | Taichung, Taiwan, China Sea | June–July 2009 | – | JX263423, JX263424 |
| BOLD TZMSC473-05.COI-5P | Cape Vidal, Kwazulu-Natal, SW Indian O. | March 2005 | Smith 30.9-2 (tissue voucher) | JF493649 |
| BOLD TZMSC230-05.COI-5P | Cape Vidal, Kwazulu-Natal, SW Indian O. | January 2005 | ADC 30.9-1 (tissue voucher) | JF493650 |
| INAPKKD-SIFT-3 (misidentified as ‘H. uarnak’) | Kakinada, Bay of Bengal | – | – | EU541309 |
| BOLD:FOA217-04 | Sandakan, Sulu Sea | April 1996 | BW-A217 (tissue voucher) | DQ108177 |
| BOLD FOAD621-05 | Muara, Indonesia | February 2005 | BW-2181 (tissue voucher) | EU398841 |
| BOLD FOAD619-05 | Muara, Indonesia | February 2005 | BW-2179 (tissue voucher) | EU398843 |
| H. toshi (outgroup) | ||||
| BOLD FOAE256-06 | Moreton Bay, Queensland | July-2005 | BW-A2468 (tissue voucher) | EU398865 |
| BOLD FOAD657-05 | Hervey Bay, Queensland | June 2002 | BW-2217 (tissue voucher) | EU398868 |
| BOLD FOAD656-05 | Hervey Bay, Queensland | June 2002 | BW-2216 (tissue voucher) | EU398869 |
Here, Individual zan6 (Table 1) was sequenced on a longer fragment of the cytb gene, as it is to be the holotype of the new species. The polymerase chain reaction used primers L14735 (5′- A A A A A C C A C C G T T G T T A T T C A A C T A -3′) and CB7 (5′- C T C C A G T C T T C G G C T T A C A A G -3′, slightly modified from CB6ThrH-15930) [24,25]. Fifteen μL reaction volume containing 0.2 mM dNTPs, 1.5 μL 10 × PCR buffer (Bioman, Taipei), 0.5 μM each of forward and reverse primer, 0.2 U Taq DNA polymerase (Bioman), and 1.0 μL template DNA was subjected to cyclic temperature variation in a Biometra TGradient thermocycler (Biometra, Göttingen). The PCR parameters were initial denaturation at 94 °C for 4 min followed by 35 cycles of denaturation (94 °C for 45 s), annealing (48 °C for 1 min), and extension (72 °C for 1 min), and a final extension step at 72 °C for 10 min. PCR-amplified DNAs were visualized under ultraviolet light on 1% agarose gel stained with ethidium bromide. After purification by isopropanol precipitation, 1 μL 1/8-diluted PCR product was subjected to sequencing, in both forward and reverse directions, using the BigDye Terminator v3.1 cycle-sequencing kit (Applied Biosystems, Foster City CA). Cycling conditions were according to the manufacturer's protocol. Sequencing reaction products were cleaned by removing dye-terminator (CleanSEQ kit, Beckman Coulter, Beverly MA) and loaded onto an ABI Prism 3100 DNA sequencer (Beckman Coulter).
2.2 Phylogenetic analysis
We performed a new phylogenetic analysis based on the partial COI gene sequences of [1] and homologous sequences accessible from GenBank (http://www.ncbi.nlm.nih.gov/) including those of Cerutti-Pereyra et al. [22] (Table 1). Partial COI gene sequences of Himantura gerrardi and Himantura toshi (Table 1) were chosen as the outgroup [1]. The best substitution model according to the Bayesian information criterion (using the Mega5software: [26]) was the Tamura-3 parameter substitution model [27] with gamma-distributed evolutionary rates (T92+G) and this model was used to produce a maximum-likelihood phylogeny of the partial COI gene sequences.
2.3 Determination of nucleotide synapomorphies
All complete nucleotide sequences of the 620-bp COI gene fragment, and only these, were aligned using the BioEdit sequence editing software [28]. The sequences were sorted by mitotype and nucleotide synapomorphies were then assessed visually.
2.4 Description of spotting patterns
We possess the pictures of the dorsal side of a number of individuals larger than 1000 mm disk width (DW) (Supplementary material, Fig. S1) identified to species (‘Cluster 1’ or ‘Cluster 4’ of [1]) from their genotypes at 5 intron loci. We analyzed the pictures of 27 individuals of quality good enough to distinguish the detail of spotting patterns on at least one side of the disk. In addition, we analyzed the picture of specimen CSIRO H2903.01, the holotype of H. leoparda (Fig. 1A of [14]). The analysis consisted of measuring the size of spots (ocellae) along a linear transect running from the mid-scapula to the lateral extremity of the disk (Fig. 1). Each of the specimens examined had to be sufficiently well preserved to have its spotting patterns intact along the transect. Ocellated spots with continuous contour (Fig. 2A) were distinguished from spots with interrupted contour (Fig. 2B, C). Three arbitrarily chosen size-classes were considered for the diameter of an ocella: ‘small’ (≤ 15 mm); ‘medium’ (> 15 mm and ≤ 25 mm); and ‘large’ (> 25 mm). Each individual was thus characterized by six factors, which were the numbers of ocellated spots along a half-disk transect of each of the three size-classes with, respectively, continuous and interrupted contours. Some individuals whose pictures were of quality good enough to allow both right and left transects were represented twice in the matrix. Thus, we were able to produce a matrix of 37 entries, where each entry corresponded to the half-disk transect of an individual.
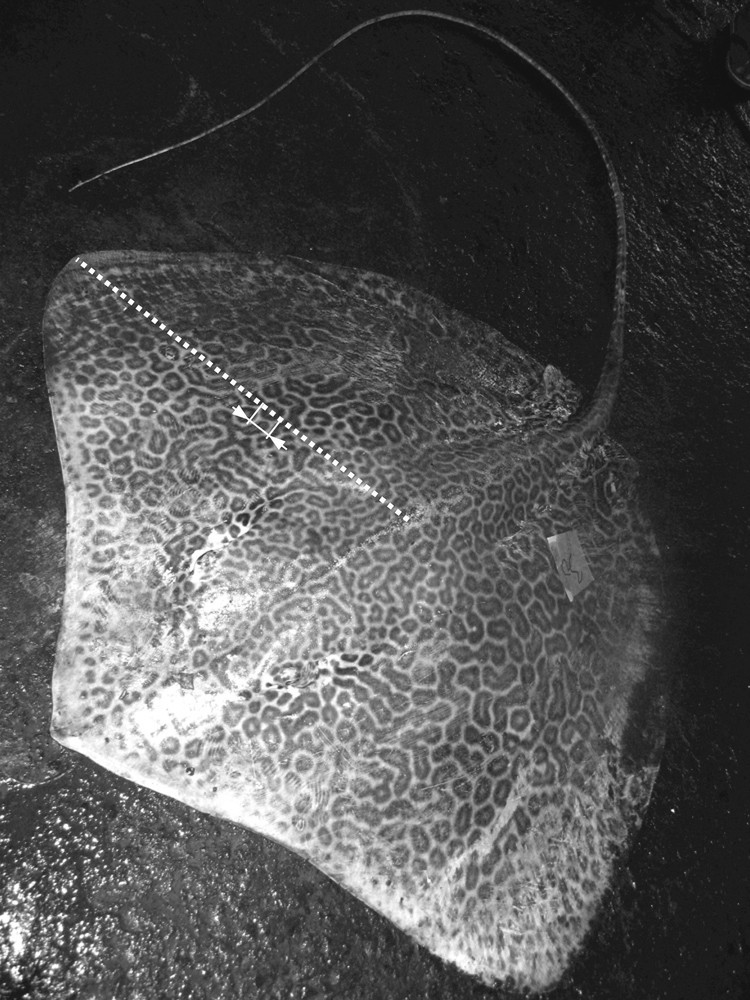
Himantura leoparda and H. tutul sp. nov. Measurement of the diameter of ocellae along a transect spanning disk half-width, running from mid-scapular point to extremity of disk. The individual represented on this picture is H. leoparda ir030 (female, 1120 mm DW, landed in Batang, August 2007; I.S.A.).
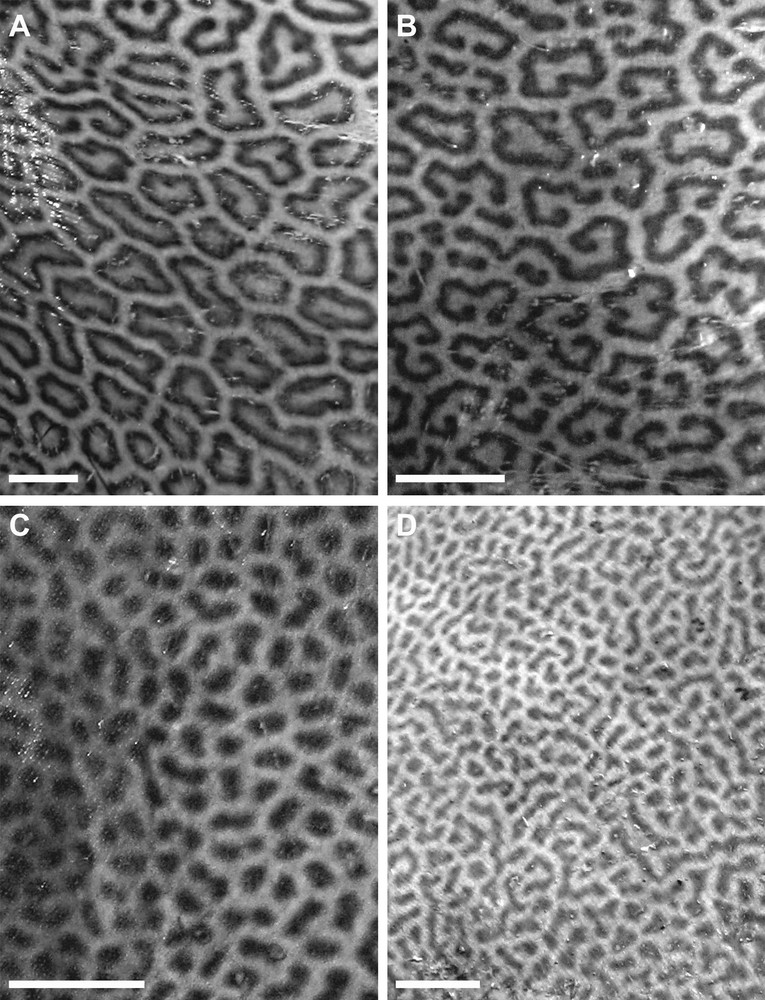
Himantura leoparda and H. tutul sp. nov. Characteristic spotting patterns on dorsal surface of adults, with varying degrees of interruption in the contour of ocellae. Scale bar: 5 cm. A. Most ocellae on this picture are closed polygons (from H. leoparda, individual No. ir062, female, 1360 mm DW, Batang, November 2007; I.S.A.). B. The contour of a percentage of the ocellae is interrupted (from H. leoparda, individual no. ir061, female, 1460 mm DW, Batang, November 2007; I.S.A.). C. All ocellae have interrupted contour; the ocella shape is recognizable in some instances (from H. tutul sp. nov., individual no. ir055, male, 1130 mm DW, Batang, November 2007; I.S.A.). D. Ocella shape generally cannot be inferred (from H. tutul sp. nov., individual no. ir052, female, 1360 mm DW, Batang, November 2007; I.S.A.).
This matrix was then subjected to correspondence analysis (CA) [29] to visualize statistical differences, if any, in the spotting patterns of the two cryptic species. CA was run using the FactoMineR package [30] under R [31].
3 Results
The phylogenetic analysis of COI gene sequences (Fig. 3) included 16 new sequences from the literature [22] in addition to the dataset we analyzed previously [1]. All H. uarnak sequences from Ningaloo Reef [22] formed a distinct subclade within Clade III (H. uarnak) (Fig. 3), the other subclade consisting of H. uarnak haplotypes sampled in the Indo-Malay archipelago. The net nucleotide divergence (Mega5: [26]) between the two subclades was 0.020 whereas the nucleotide diversity within subclades (Mega5: [26]) was 0.002 to 0.003. Comparatively, the net nucleotide divergence between zan6, the only Clade-I individual sampled in the western Indian Ocean and the rest of Clade I, which consisted of haplotypes sampled from the Indo-Malay archipelago, was 0.010 and the nucleotide diversity within the latter group was 0.002. Similarly, the net nucleotide divergence between the two individuals of Clade IV from the Kwazulu-Natal in the western Indian Ocean (Table 1) and the rest of Clade IV, which consisted of haplotypes sampled from the Indo-Malay archipelago, was 0.015 and the nucleotide diversity within a subclade was 0 to 0.003.
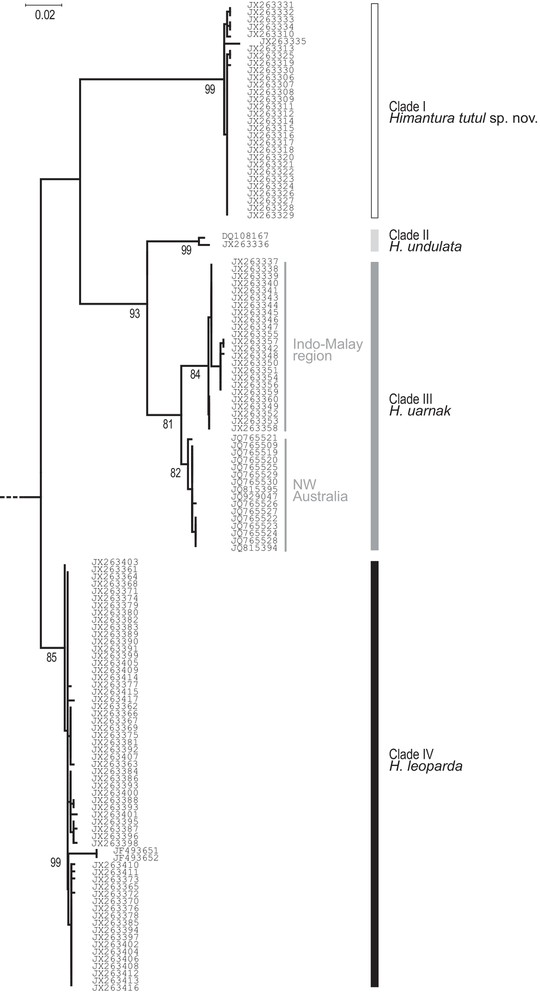
Himantura uarnak species complex. Maximum-likelihood phylogeny of partial COI haplotypes including homologous sequences from H. leoparda, H. uarnak and H. undulata retrieved from GenBank (http://www.ncbi.nlm.nih.gov/; Table 1) (sequences aligned over 620 bp; T92+G model, selected according to Bayesian information criterion; pairwise deletion; 1000 bootstrap resamplings; Mega5 [26]). The tree was rooted by the homologous sequences in H. gerrardi and H. toshi (Table 1). Only bootstrap scores > 80% are indicated.
Supplementary material, Table S1 details the nucleotide variability observed in the whole sequence dataset, which comprised 30 sequences of Clade I of [1], two of Clade II, 25 of Clade III, and 60 of Clade IV. Nucleotide synapomorphies were observed for each clade (Supplementary material, Table S1), hence could be used as diagnostic characters of each of the corresponding species, i.e., respectively, Clusters 1–4 [1].
The results of the morphological analysis based on spotting patterns (Table 2) are presented on Fig. 4. All Cluster-1 individuals were positioned outside a convex envelope that would group all Cluster-4 individuals, indicating some segregation of Cluster 1 vs. Cluster 4 on the sole basis of spotting patterns. However, hierarchical cluster analysis provided overlapping clusters (represented by dotted lines on Fig. 4). The two datapoints representing Individual CSIRO H2903.01, the holotype of H. leoparda, were clearly positioned within the envelope delimitating Cluster-4 specimens to the exclusion of Cluster-1 specimens. The two data points representing Individual zan6 (the holotype of Himantura tutul sp. nov., see below) were positioned within the bulk of the Cluster-1 specimens. The main factors differentiating the two clusters were the number of large ocellated spots, characteristic of Cluster 4 exclusively, and the number of medium-sized ocellated spots, which were almost absent in Cluster-1 individuals (the only exception being the only presumed hybrid present in the sample). Small interrupted spots were most frequent in Cluster-1 individuals (Table 2).
Himantura leoparda and H. tutul sp. nov. Matrix of individuals > 1000 mm disk width, characterized by the numbers of ocellated spots with, respectively, continuous and interrupted contours in each of three size-classes (small: ≤ 15 mm; medium; > 15 mm and ≤ 25 mm; large: > 25 mm). Cluster and Mitotype according to [1]. L: left half-disk transect; R: right half-disk transect; DW: disk width. 1 × 3, presumed F1 hybrid between Clusters 1 and 3 [1].
| Species, individual No. | DW (mm) | Cluster | Mitotype | Continuous contour | Interrupted contour | ||||
| Small | Medium | Large | Small | Medium | Large | ||||
| H. tutul sp. nov. | |||||||||
| ir037 (L) | 1180 | 1 × 3 | I | 1 | 3 | – | 2 | 9 | – |
| ir044 (L) | 1240 | 1 | I | – | – | – | 2 | 5 | – |
| ir045 (R) | 1280 | 1 | I | – | – | – | 7 | 4 | – |
| ir047 (L) | 1170 | 1 | I | – | – | – | – | 6 | – |
| ir047 (R) | 1170 | 1 | I | – | – | – | – | 6 | – |
| ir049 (R) | 1240 | 1 | I | – | – | – | 2 | – | – |
| ir052 (L) | 1360 | 1 | I | – | – | – | – | 3 | – |
| ir076 (R) | 1160 | 1 | I | 4 | – | – | 8 | 1 | – |
| ir084 (L) | 1200 | 1 | I | 3 | – | – | 1 | – | – |
| zan6 (L) | 1150 | 1 | I | – | – | – | 5 | 8 | – |
| zan6 (R) | 1150 | 1 | I | – | – | – | – | 8 | – |
| H. leoparda | |||||||||
| ir030 (L) | 1120 | 4 | IV | 6 | 6 | – | 4 | 3 | – |
| ir030 (R) | 1120 | 4 | IV | 10 | 2 | 1 | – | 2 | 2 |
| ir031 (L) | 1165 | 4 | IV | – | 4 | 2 | 1 | 7 | 3 |
| ir031 (R) | 1165 | 4 | IV | – | 8 | – | – | 7 | 1 |
| ir032 (L) | 1070 | 4 | IV | 2 | – | – | 1 | 12 | 3 |
| ir034 (R) | 1525 | 4 | IV | – | 1 | – | – | 9 | 8 |
| ir036 (L) | 1070 | 4 | IV | – | 5 | 2 | 1 | 4 | 4 |
| ir036 (R) | 1070 | 4 | IV | – | 3 | 1 | – | 5 | 5 |
| ir048 (R) | 1045 | 4 | IV | – | 1 | – | – | 8 | 1 |
| ir050 (L) | 1260 | 4 | IV | – | 9 | 2 | – | 4 | 1 |
| ir050 (R) | 1260 | 4 | IV | – | 6 | 6 | – | 1 | – |
| ir051 (L) | 1140 | 4 | IV | – | 9 | – | 1 | 5 | 2 |
| ir059 (R) | 1440 | 4 | IV | – | – | – | – | 6 | 7 |
| ir061 (R) | 1460 | 4 | IV | – | – | 5 | – | 2 | 9 |
| ir062 (R) | 1360 | 4 | IV | – | 2 | 7 | – | – | 3 |
| ir062 (L) | 1360 | 4 | IV | – | 3 | 9 | – | 2 | 3 |
| ir063 (L) | 1530 | 4 | IV | – | 1 | – | – | 6 | 5 |
| ir064 (L) | 1430 | 4 | IV | – | – | – | – | 4 | 4 |
| ir065 (L) | 1090 | 4 | IV | – | 3 | 1 | – | 1 | 4 |
| ir065 (R) | 1090 | 4 | IV | – | 1 | 3 | – | 7 | 3 |
| ir069 (R) | 1030 | 4 | IV | 6 | – | – | 6 | 2 | – |
| ir070 (R) | 1110 | 4 | IV | 1 | 3 | – | 4 | 6 | – |
| ir071 (L) | 1420 | 4 | IV | 1 | 4 | 4 | – | 5 | 3 |
| ir077 (R) | 1320 | 4 | IV | – | – | 4 | 1 | 3 | 7 |
| H2903.01 (L) | 1105 | – | – | – | 3 | 2 | – | 5 | 5 |
| H2903.01 (R) | 1105 | – | – | – | 5 | 1 | 2 | 7 | – |
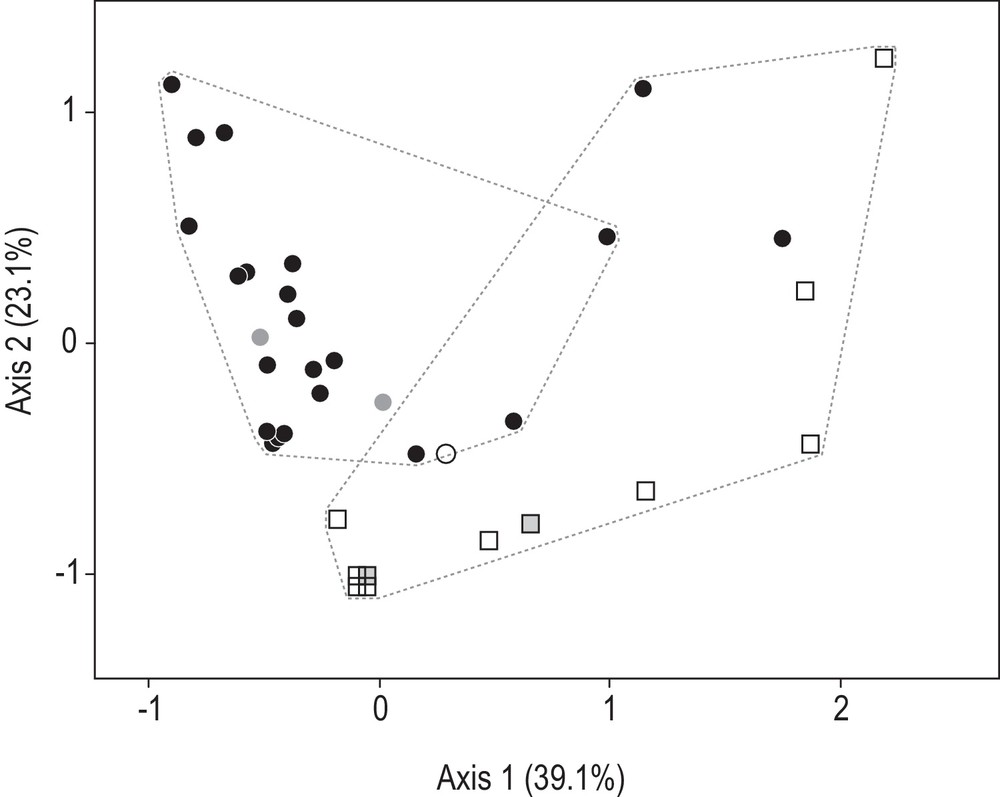
H. leoparda and H. tutul sp. nov. Correspondence analysis (CA: [29]) of the matrix of individuals characterized by the size-frequencies of ocellated spots along half-disk transect of the dorsal side (Table 2). CA was run using the FactoMineR package [30] under R [31]; percentages for each axis are their inertias [29]. Closed circles (•): Cluster-4 individuals, now assigned to H. leoparda; open squares (□): Cluster-1 individuals, now assigned to H. tutul sp. nov.; open circle (○): Individual ir037, a presumed F1 hybrid between H. tutul sp. nov. and H. uarnak [1]; shaded: points representing the holotypes of H. leoparda (circles) and H. tutul sp. nov. (squares). Dotted lines delineate groups of individuals grouped by hierarchical clustering analysis [30].
4 Discussion
The sequencing of genomic DNA provides a powerful tool to characterize genetic variation within and among species [32,33]. DNA sequences are increasingly commonly used to distinguish species boundaries and to identify individuals to species [21,32,34–36]. DNA sequences are also useful to diagnose new species, and given this, “we find no compelling evidence to exclude DNA-only descriptions” [35].
We were confronted with the problem of determining which of the two cryptic species then under H. leoparda was the true H. leoparda. No mitochondrial sequence of H. leoparda's holotype (CSIRO H2903.01) seems to exist [37]. However, a picture of the dorsal side of H. leoparda's holotype was available from the literature [14,37] thus allowing its characterization on the basis of spotting pattern. In the present work, a strong statistical relationship was demonstrated between multiple-locus nuclear genotype [1] and spotting pattern within the ocellated stingrays currently grouped under H. leoparda. This allowed us to assign the holotype of H. leoparda to Cluster 4 of [1]. Therefore, it is the other species (Cluster 1) that remained undescribed.
Each of Clades I, III and IV had representatives from both the Indian Ocean and the Indo-Malay archipelago. In all three cases, two subclades were detected, within which the nucleotide diversity was ∼ 5 to ∼ 10 times less than the net nucleotide distance between subclades. Pending more detailed sampling, we provisionally ascribe these differences to geographic variation. These differences may have arisen from past geographic isolation between the Indian Ocean and Pacific Ocean populations of each species, or may result from isolation by distance. To test these two hypotheses will require new, extensive geographic sampling. Isolation by distance has been identified as a possible mechanism of geographic differentiation in another stingray species of the family Dasyatidae, Neotrygon kuhlii [38].
The confusion in the taxonomy of ocellated whiprays of the H. uarnak species complex originates in part from the mediocrity of traditional morphological characters for separating biological species in this group [37]. The recent taxonomic revision of [14], based on morphology, helped clarify the nomenclature of species in this group but fell short of distinguishing two of the four species subsequently scored using nuclear markers [1]. In sharp contrast with morphological characters, the nucleotide sequence of a portion of the COI gene provides a clear distinction of the different species that were uncovered by nuclear markers [1]. It is therefore advisable to now base our description of H. tutul sp. nov. on the nucleotide sequence of the COI gene. It is sensible to employ this marker instead of the five nuclear markers used by [1] because the COI gene also provides the universal barcode in fishes [21], which has been proven to be very effective for identification to species in Elasmobranchs [39]. An alternative mitochondrial marker in Elasmobranchs could be the NADH2 gene, now sequenced in 574 species representative of the genetic diversity of the whole phylum [36]. However, it is not yet possible to relate the five main NADH2 haplogroups observed in the H. uarnak species complex (Fig. 52 of [36]) to Clusters 1–4 of [1].
5 Diagnostic description of Himantura tutul sp. nov.
5.1 Previous references
Himantura sp. A, pro parte: [37]; Himantura leoparda, pro parte: [14]; Himantura leoparda Cluster 1: [1].
5.2 Type material and vouchers
We chose as holotype a female individual, ∼ 1150 mm DW, sampled by J.-D.D. at the Mkoani fish landing site on Pemba Island, Tanzania, 26 May 2010 (Fig. 5). A sample of tissue of this individual (zan 6) has been deposited by P. Borsa and J.-D.D. at the Museum national d’histoire naturelle (MNHN), Paris under registration No. MNHN-ICTI5184. This material consists of two sections of the tail, 25.1 and 28.5 mm long and 4.4 mm and 4.6 mm diameter, respectively. Since DNA can be re-extracted from this tissue sample and its COI sequence can be verified independently, and any other portion of the genome can be sequenced to complete the description of the species or to allow comparisons with other materials in the future, we consider that there was no necessity to deposit the whole dead specimen as holotype. Article 72.5.1 of the International Code of Zoological Nomenclature (ICZN) stipulates as eligible as name-bearing type “any part of an animal” [40]. It would have been a difficult task to preserve this specimen, given its size and the remoteness of the fishing location. We were also unprepared to face the administrative red tape, the cost, and the logistical problems that would arise in attempting to transfer a large, formalin-preserved specimen from its sampling site in remote Pemba Island to a museum overseas. Besides, several species in the genus Himantura including H. leoparda, H. uarnak and H. undulata are already classified as “vulnerable” in the IUCN Red List [40–43] and it is likely that H. tutul sp. nov. similarly will be placed on the list. Therefore, we deem it somewhat unethical to sacrifice an adult individual to be preserved as dead specimen in a collection. Buying an already dead specimen from a fish-landing site would similarly send a contradictory message in this respect.
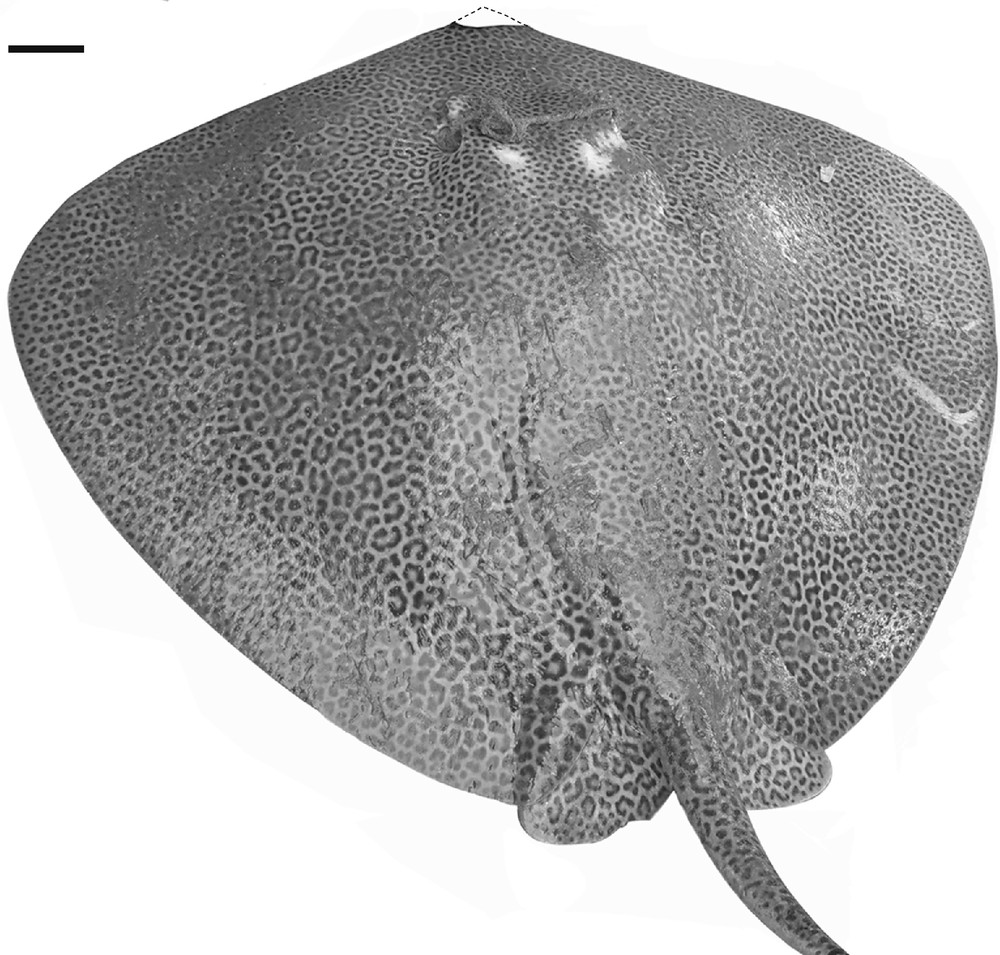
Himantura tutul sp. nov. Photograph of Individual zan6 (MNHN-ICTI5184; from Mkoani, Pemba Island, Tanzania (05°21′S 39°37′E), 26 May 2010; J.-D.D.) chosen as holotype. Scale bar: 10 cm.
We chose as paratypes of H. tutul sp. nov. two specimens previously determined as H. leoparda by Manjaji-Matsumoto and Last [14]: CSIRO H5284.05 (female 805 mm DW, from Kota Kinabalu fish market, Kota Kinabalu, eastern South China Sea, 1999; dissected jaws, denticle band and pelvic girdle retained), and UMS MMSK-c4 (from Sandakan, Sulu Sea, 1999). CSIRO H5284.05 is at the Australian National Fish Collection, Hobart, and UMS MMSK-c4 is in the fish collection of Universiti Malaysia Sabah in Kota Kinabalu. The rationale for choosing these specimens as paratypes of H. tutul sp. nov. is the following: both specimens have been registered in museum collections and both possess the mitotype I characteristic of H. tutul sp. nov. [1] based on the partial nucleotide sequences (239 bp of the cytb gene) provided by Manjaji [37]. One of these specimens (UMS MMSK-c4) has the “fine-leopard” pattern mentioned in [37] which is the general pattern exhibited by individuals of H. tutul sp. nov. (present work). Although CSIRO H5284.05 has already been designated as a paratype of H. leoparda [14], Article 72.6 of the ICZN stipulates that “the fact that a specimen is already the name-bearing type … of one nominal species-group taxon does not prevent its being the name-bearing type … of another” [40].
The other material examined included all other specimens analyzed at both the COI locus, the cytb locus, and five size-polymorphic intron loci [1] (Table 1), at the COI locus only [22] (Table 1), and at the cytb locus only [1,37].
5.3 Description
A morphological description of H. tutul sp. nov. has already been provided (under H. leoparda) by Manjaji-Matsumoto and Last [14]. These authors did not refer to spotting patterns in their definition nor in their diagnosis of H. leoparda. The present results showed that the ‘atypical fine-leopard form’ [37] of H. leoparda sensu [14] was characteristic of H. tutul sp. nov. while it was mostly absent in H. leoparda under its new definition (Fig. 4; Supplementary material, Fig. S1; Table 2). Therefore, spotting patterns are useful as a character to distinguish between the two species (Fig. 4). However, the mitochondrial sequence has proven to be totally diagnostic ([1]; present study) and because of this fact, we consider it to be much more an adequate character than any of the morphological characters employed thus far [14,37], including spotting patterns (present work), to base our description on.
The present description of H. tutul sp. nov. is based on the nucleotide sequence of a 655-base pair (bp) fragment of the COI gene (hereafter abbreviated as ‘partial COI gene’) homologous to the portion of the mitochondrial genome of N. kuhlii comprised between nucleotide sites 2278 and 2932 (GenBank JN184065; [9]). The partial COI gene of the holotype of H. tutul sp. nov. has the following sequence: 5′- C C T T T A T C T G A T C T T C G G T G C A T G A G C A G G G A T A G T G G G T A C T G G C C T T A G C C T G C T T A T T C G G A C A G A G C T A A G T C A A C C A G G C G C A C T A C T G G G T G A T G A T C A G A T C T A T A A T G T A A T T G T C A C T G C C C A T G C C T T C G T A A T A A T C T T T T T T A T G G T A A T G C C C A T T A T A A T T G G T G G T T T T G G T A A T T G A C T C G T T C C C C T A A T A A T T G G C G C C C C T G A T A T A G C T T T T C C T C G A A T A A A C A A C A T A A G T T T C T G G C T T C T C C C T C C A T C C T T C T T G C T A C T T T T G G C C T C T G C T G G A G T A G A A G C T G G A G C T G G A A C C G G T T G A A C A G T C T A C C C C C C A T T A G C T G G C A A T C T A G C A C A C G C A G G G G C T T C A G T A G A C T T A G C A A T C T T T T C G C T A C A T C T A G C C G G T G T A T C T T C T A T C T T G G C C T C C A T T A A T T T T A T T A C C A C A A T C A T T A A C A T A A A A C C A C C A G C A A T T T C A C A G T A T C A A A C A C C C C T C T T T G T C T G A T C G A T T C T C A T C A C T G C T G T A C T C C T C T T G T T A T C C C T T C C T G T T C T G G C A G C A G G C A T T A C A A T A C T T T T A A C A G A C C G T A A C C T C A A T A C A A C C T T C T T T G A C C C T G C A G G A G G A G G T G A C C C A A T T C T C T A T C A A C A T C T C T T C -3′. This sequence has accession No. JX263335 in GenBank.
In addition, the nucleotide sequence of a 829-bp fragment of the cytb gene of the holotype of H. tutul sp. nov. is the following: 5′- A T A C C G C A G A C A T C T C C T C A G C A T T C T C C T C A G T T G C A C A T A T C T G C C G A G A T G T A A A C T A T G G C T G A C T A A T C C G C A A C A T C C A C G C T A A C G G C G C C T C C A T G T T C T T T A T C T G C A T T T A C C T T C A C A T T G C T C G A G G T T T T T A C T A T G G T T C C T A T C T T T A T A A A G A G A C C T G A A A C A T C G G A G T A A T C A T C T T A A T G C T A C T A A T A G C T A C T G C C T T T G T A G G T T A C G T C C T C C C A T G A G G A C A A A T A T C A T T C T G A G G A G C A A C C G T T A T T A C C A A C C T A T T A T C A G C C T T T C C C T A T A T T G G A G A T A T G C T A G T T C A G T G A A T C T G G G G T G G T T T T T C A G T G G A T A A C G C A A C A C T A A C T C G A T T C T T C A C A T T T C A C T T C C T C T T T C C C T T T A T T A T T G C A G C T C T G A C C A T A G T T C A C C T T C T T T T C C T T C A T G A A A C A G G T T C A A A C A A C C C T A T C G G C C T A G A C T C C A A C A C A G A C A A A A T T C C C T T C C A T C C T T A C T A C T C T T A C A A A G A T C T C C T A G G T T T C T T T A T T C T C T T A C T A C T A T T A A C T C T T T T A G C C C T A T T T A T G C C A A A C C T C T T A G G G G A T A C C G A A A A C T T T A T C C C A G C C A A C C C A C T C G T T A C A C C A C C C C A T A T C A A A C C A G A G T G G T A C T T C C T C T T C G C T T A C G C T A T C C T A C G C T C T A T C C C T A A T A A A T T A G G G G G C G T C C T T G C A C T T G C C T T C T C A A T T C T T A T T C T C C T T C T A G T C C C A A T A C T A C A C A C C T C A A A A C A A C G A A G C C T T A C C T T C C G C C C A A T C A C A C A A C T C C T T T T C T G A C T T C T A G T A A C A A A -3′. This sequence has accession No. JX274333 in GenBank. Partial (239-bp) cytb gene sequences of other specimens of H. tutul sp. nov. have been published previously under Himantura sp. A [37] or under H. leoparda Cluster 1 [1]. These include paratypes CSIRO H5284.05 and UMS MMSK-c4, voucher specimen UMS MMPL11, and three other specimens labelled A1, A4 and A5 [37], and all other H. tutul sp. nov. individuals of Table 1.
5.4 Etymology
We chose as epithet of the new species the Malay word tutul, which means “spotted” and which designates the spots of the leopard, Panthera pardus (“macan tutul” in Malay language). Thus, the new species was named after the leopard-like markings on the dorsal surface of large specimens (> 1000 mm DW). We propose as the English vernacular name: Fine-spotted Leopard Whipray, to distinguish it from the Leopard Whipray, Himantura leoparda, which has larger spots (Fig. 1; Table 2). We propose as the French vernacular name raie léopard à petites taches and as the Malay vernacular name pari tutul kecil.
5.5 Comparisons with closely related species
Himantura tutul sp. nov. is closely related to H. leoparda, H. uarnak, and H. undulata: all four species cluster as a single clade in the phylogeny of the genus Himantura [1]. H. tutul sp. nov. and H. leoparda cannot be distinguished by their partial COI amino-acid sequences as translated from the 620-bp fragment analyzed in [1]. H. uarnak differs from the former two by a single, quasi-diagnostic amino-acid change (V to I) at the amino-acid position determined by the nucleotide triplet starting at position 171 of the 620-bp COI gene fragment sequence (Supplementary material, Table S1).
H. tutul sp. nov. can be separated from all three other species of the H. uarnak species complex by the nucleotide synapormorphies highlighted in Supplementary material, Table S1. All three other species also possess a number of nucleotide synapomorphies that allow their separation from one another (Supplementary material, Table S1).
5.6 Geographic distributions
Based on the material genetically identified to species thus far [1], the distribution of H. tutul sp. nov. comprises the coast of Tanzania in the western Indian Ocean (Pemba Island being the type locality of the new species), the Laccadive Sea, and part of the Indo-Malay archipelago including the Sunda Strait area, the southern coast of Java Island, the Bali Sea, the eastern South China Sea (Sabah), and the Sulu Sea (Sabah). The precise geographic origin of the H. tutul sp. nov. individuals sampled from the Batang fish landing place is unknown. However, the approximate area fished from Batang has ca. 1000 km radius, includes the whole Java Sea and reaches Natuna Island in the southernmost part of the South China Sea and Makassar Strait to the East [44]. A recent survey of the biodiversity of Myliobatoidei on Ningaloo Reef, northwestern Australia [22] failed to sample H. tutul sp. nov. there, suggesting the species may be absent from this region.
Now that H. leoparda has been redefined as a species distinct from H. tutul sp. nov. (present work), it is necessary to draw its distribution more precisely than previously done [14]. Based on the holotype and on the material genetically identified to species thus far [1], the distribution of H. leoparda under its present new definition comprises the coast of Kwazulu-Natal in the western Indian Ocean, and part of the Indo-Malay-Papua archipelago including the Sunda Strait area, the eastern South China Sea (Sabah), and the Gulf of Carpentaria which is also the type locality of the species [14]. The precise geographic origin of the H. leoparda individuals sampled from the Batang fish landing place is unknown (but see here above). H. leoparda is possibly absent from Ningaloo Reef [22].
Disclosure of interest
The authors declare that they have no conflicts of interest concerning this article.
Acknowledgements
We thank N. Hubert for sharing ideas on molecular taxonomy, and A. Yusmalinda and Rumini for advice on the use of the Malay word “tutul” as species name. We are grateful to A. Dettai and P. Pruvost (MNHN) and R. Hadiaty (MZB) for providing collection numbers to our material. Designed the study: P. Borsa. Contributed reagents or materials or analysis tools: P. Borsa, J.-D.D., K.N.S., I.S.A., P. Berrebi. Performed the experiments: KNS. Analyzed and interpreted the data: P. Borsa, J.-D.D., P. Berrebi. Wrote the paper: P. Borsa. A 6-month fellowship was allocated to ISA under the BEST program of Agence inter-organismes de recherche pour le développement (AIRD), France, to work with P. Borsa and P. Berrebi at ISE-M. Funded by AIRD, IRD UR227, ISE-M, LIPI-P2O, and National Taiwan University-Institute of Fisheries Science; the funders had no role in study design, data collection and analysis, decision to publish, or preparation of the manuscript.