

1 Introduction
The role of glasses as ultraviolet-transmitting materials for special applications has increased in recent years. Fluoride single crystals, mainly CaF2, and high-purity vitreous silica are well-known materials used for deep UV optics, especially in microlithography 〚1〛. Moreover, for the various applications, a variety of glasses with different properties is required. Fluoroaluminate and phosphate glasses with high purity are also good UV transmitting materials 〚2–4〛 with a large intrinsic band gap.
It was found that a traditionally old borosilicate glass type Duran® similar to Borofloat® melted with starting materials of special high purity has also a high transmission in the deep UV range 〚5–7〛. Its structure and properties are mainly determined by the M2O/B2O3 ratio, the so-called boric oxide anomaly 〚8〛, so it has almost entirely bridging oxygens, i.e. a very low optical basicity 〚9〛 and a large intrinsic band gap for the electronic transitions.
But the real UV transmission is limited by extrinsic charge transfer and s → p absorption bands due to trace impurities of metal ions, such as Fe3+/Fe2+, Pb2+, Sn2+, etc., which are influenced by the glass matrix 〚3, 4, 10–13〛. It was shown that both intrinsic and extrinsic absorption are important for UV-radiation-induced defects in the glasses 〚3–6, 9, 14–20〛. The aim of this paper is the investigation of the charge-transfer absorption of Fe3+ and Fe2+, the s → p absorption of Sn2+ and the d → s absorption of Sn4+ and their role in UV lamp and laser-radiation-induced defects in borosilicate glass samples of special high purity, in comparison with fluoride and phosphate samples. Trace amounts of tin are introduced through the float bath during the Borofloat process 〚7〛 or Sn2+ dopants are taken as soft reducing agent for Fe3+ to increase the UV transmission 〚6, 16〛. Iron is an unavoidable trace impurity in all multi-component glasses produced by melting technique, mainly introduced with the raw materials. Photo-oxidation of Fe2+ induced by UV radiation was found in silicate, fluoride and phosphate glasses investigated. On the contrary, Fe3+ participates in the radiation processes only in silicate but does not in fluoride and phosphate glasses 〚4, 14–17, 20〛.
In previous works, it was shown that small amounts of Sn2+ increase the UV defect generation in silicate and borosilicate glasses, but this cannot be generalised for any chosen glass 〚6, 16, 20〛. The mechanisms of formation and healing of radiation-induced defects are very complex, including energy transfer processes.
2 Experimental
For this work, three different glass types, fluoroaluminates, phosphates and borosilicates, with potentially high intrinsic UV transmission were used and melted with raw materials of special high purity (Fe’ < 1 ppm, other metals < 0.5 ppm) under oxidising and reducing conditions. The batch compositions and some properties measured on un-doped basic glass samples are given in Table 1. The basic batches were doped with iron and tin components in the ppm range melted under the same oxidising and reducing conditions. Impurity content and redox states were analysed by different methods, chemical, ICP–OES, optical absorption and luminescence analysis. The resulting glass samples had good optical homogeneity. Refractive index values, nλ, were obtained on a Pulfrich refractometer with an error ± 2 × 10⁻⁵. The dispersion coefficient, νe = ne – 1/nF’ – nC’, was calculated from the measured values nλ. Sample plates (thickness 0.2–10 mm) were produced for the optical absorption and luminescence measurements and the radiation experiments. The optical absorption spectra in the range of 190–3200 nm were recorded with an error < 1% using a commercial double beam spectrometer and other apparatus for the vacuum UV region (120–200 nm) with an error < 15%. Sample plates were irradiated at room temperature by strong broadband UV lamps (performance density 1500 W m–2 in the range 230–280 nm with the XeHg and 190–280 nm with the HOK Hg lamp). For laser-radiation-induced defects, ArF (193 nm), KrF (248 nm) and XeCl (308 nm) excimer lasers (pulse energy 70–500 mJ cm–2, performance density to 1011 W m–2, pulse length ∼30 ns, repetition rate 1–20 Hz) were used. The absorbance (Eλ = log T0/T, with T0 the transmission without sample, T the transmission with sample) was recorded with a commercial spectrometer before and after irradiation. The induced absorbance was expressed as an absorption coefficient, ΔE/d (in cm–1). All spectra were fitted by Gaussian bands, using the commercial PeakFit separation and analysis software 〚4〛. The number of bands was minimised, correlated with different irradiation and annealing experiments, and EPR measurements. EPR measurements were performed on plate samples in comparison with a set of DPPH standards with different spin numbers, using a commercial spectrometer (Bruker ESP 300 E) at room temperature. The annealing of radiation-induced defects was measured at room temperature both with and without lamp or laser radiation, and with thermal treatment below the Tg temperature of the glass samples. The density of the glass was determined using Archimedes’ principle and measuring the buoyancy of a polished glass sample in CCl4. DTA and dilatometry measurements were carried out to obtain values for the thermal properties, Tg and α.
Batch compositions and some properties measured on un-doped basic glass samples investigated.
| Glass | Composition (mol%) | Tg ± 5 (°C) | Thermal | Density ρ (g cm–3) | Refractive indexne | Dispersion coefficient νe | VUV edge λ0 (nm) |
| coefficient α | |||||||
| 100–300 °C | |||||||
| (10–7 K–1) | |||||||
| Fluoride FP | 35 AlF3 – 15 SrF2 – 30 CaF2 – 10 MgF2 – 10 Sr(PO3)2 | 440 | 160 | 3.50 | 1.4601 | 90 | 160 |
| Phosphate P | 50 P2O5 – 50 SrO | 495 | 125 | 3.20 | 1.5614 | 66 | 170 |
| Borosilicate BS | 82 SiO2 – 12 B2O3 – 1 Al2O3 – 5 Na2O/K2O | 530 | 33 | 2.22 | 1.4733 | 66 | 175 |
3 Results
3.1 UV absorption
Fig. 1a shows vacuum UV transmission spectra of an undoped borosilicate (BS) glass sample with high purity (analysed Fe content < 1 ppm) and two samples doped with 20 ppm iron melted under reducing and oxidising conditions. Fig. 1b demonstrates the fit of two charge-transfer bands for Fe3+ with Gaussian shape. The dominating band has a maximum at 222 nm (45 000 cm–1) and a very large bandwidth (full width at half maximum), 11 000 cm–1. But a second smaller band (width ∼5500 cm–1) with a maximum at 255 nm (39 200 cm–1) with lower intensity was necessary for a well fitting of all measured spectra of the iron-doped glass samples melted under oxidising conditions. Fe2+ could not be detected in this sample with an error lower than 10% . On the contrary, large amounts of Fe3+ were found (15 to 70%) in all doped BS samples melted under reducing conditions. Fig. 1c illustrates a typical fit of one charge transfer band of Fe2+ with a maximum at 215 nm (46 500 cm–1) and a small band width, ∼5500 cm–1, besides the two bands for Fe3+. In comparison with the analysed Fe content by ICP–OES, chemical analysis and the fitted optical absorption spectra, the specific absorption coefficients for Fe3+ and Fe2+ in the borosilicate glass matrix (BS) were determined and compared with those in phosphate (P) and fluoroaluminate (FP) samples from previous papers 〚3, 4, 11, 12, 20〛 (Table 2).
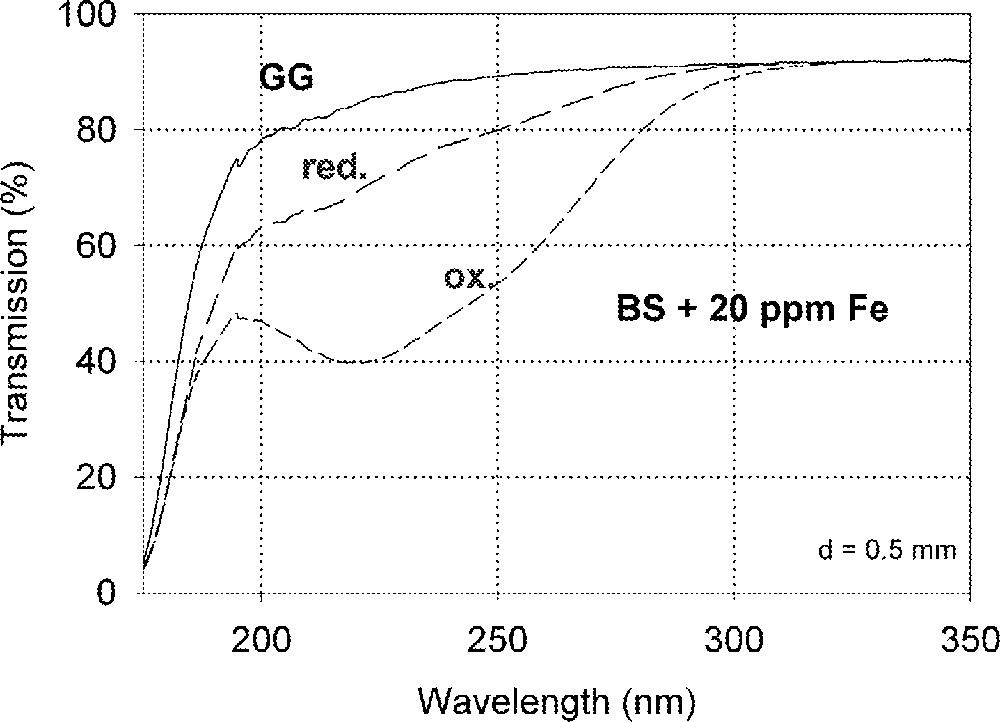
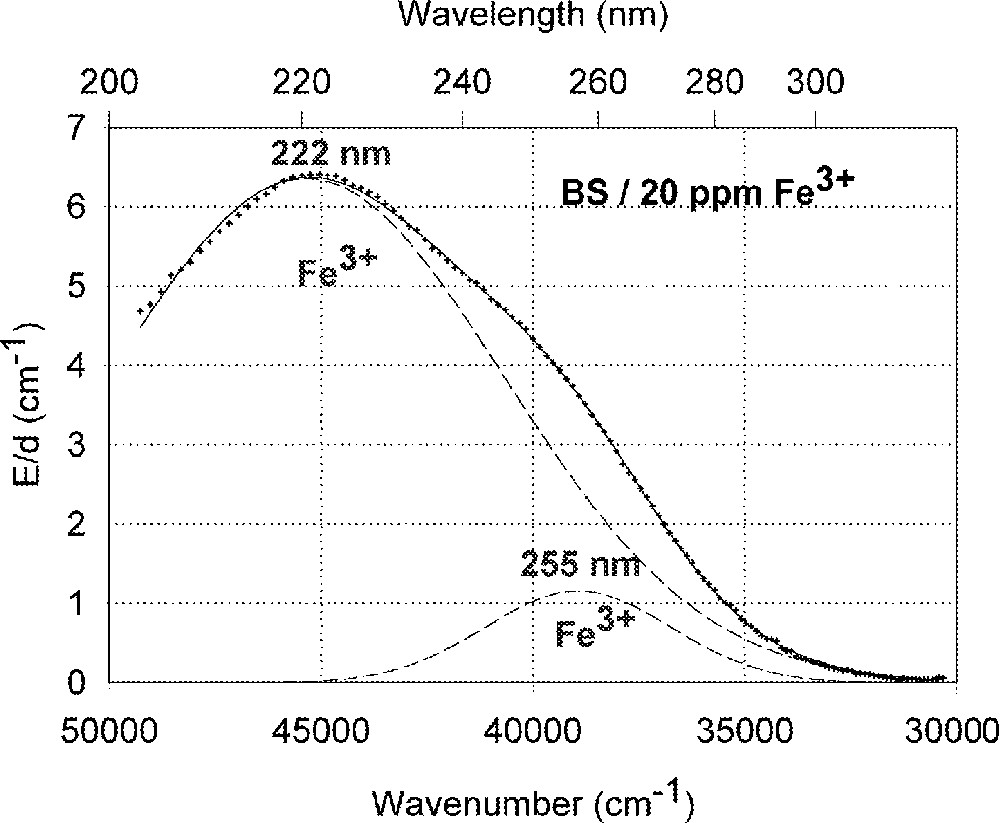
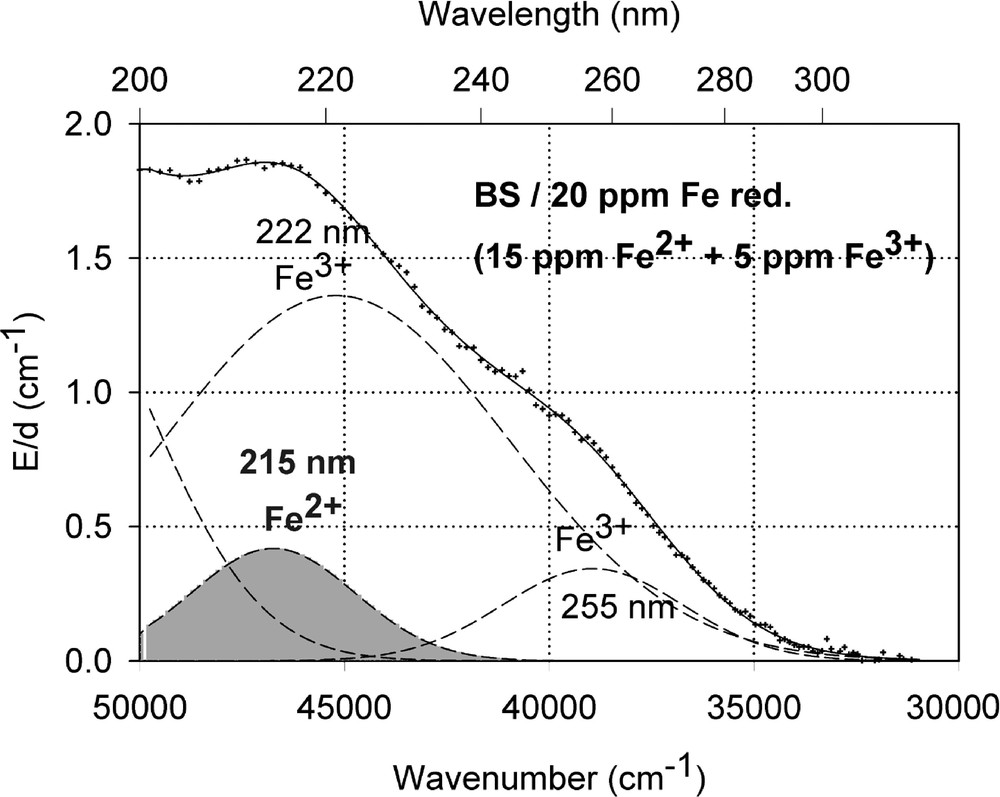
Influence of iron on the ultraviolet absorption of high-purity borosilicate glass samples, BS. (a) Vacuum ultraviolet transmission spectra of BS glass samples doped with 20 ppm Fe melted under oxidising (ox) and reducing (red) conditions in comparison with an undoped sample (GG) with an analysed Fe content < 1 ppm. (b) Peak simulation for 20 ppm Fe3+ (sample ox) with two Gaussian bands (dashed lines). The measured data (pointed line) could be well fitted (line). No Fe2+ was detectable. (c) Peak simulation for the sample with 20 ppm Fe (red). One Gaussian band for Fe2+ with a maximum at 215 nm was found besides the two bands for Fe3+.
Charge transfer bands and specific extinction coefficients ϵλ for Fe3+ and Fe2+ complexes in different host glasses.
| Glass | Fe3+ | Fe2+ | |||||||||
| λmax (nm) | Energy | ϵλ (cm–1 ppm–1) | Width (cm–1) | λmax (nm) | Energy | ϵλ (cm–1 ppm–1) | Width (cm–1) | ||||
| (cm–1) | (eV) | (cm–1) | (eV) | ||||||||
| Fluoride FP | 185 | 55 500 | 6.9 | 0.25 ± 0.05 | 6000 | 170 | 58 800 | 7.3 | 0.20 ± 0.05 | 5000 | |
| 260 | 38 500 | 4.8 | 0.18 ± 0.02 | 8000 | 220 | 45 500 | 5.6 | 0.006 ± 0.001 | 4000 | ||
| Phosphate P | 240 | 41 700 | 5.3 | 0.20 ± 0.01 | 10 000 | ∼220 | ∼45 500 | 5.6 | < 0.01 | ∼6000 | |
| Borosilicate BS | 222 | 45 050 | 5.6 | 0.30 ± 0.02 | 11 000 | 215 | 46 500 | 5.8 | 0.03 ± 0.01 | 5500 | |
| 255 | 39 200 | 4.9 | 0.06 ± 0.01 | 5500 |
Figs. 2–4 show the vacuum UV spectra of undoped and Sn doped glass samples investigated and possible fits for a d → s transition of Sn4+ with a maximum near the intrinsic VUV edge besides s → p transitions for Sn2+, which were found in all tin doped samples with high accuracy. In fluoroaluminate (FP) and phosphate (P) glass samples doped with tin, the electronic transitions of tin ions detected by optical absorption and luminescence spectroscopy are shifted to shorter wavelength, that means higher energies (Figs. 2 and 3). The amounts of Sn4+ and Sn2+ depending on the host glass were estimated by Mössbauer spectroscopy 〚21〛. The values obtained are summarised in Table 3.
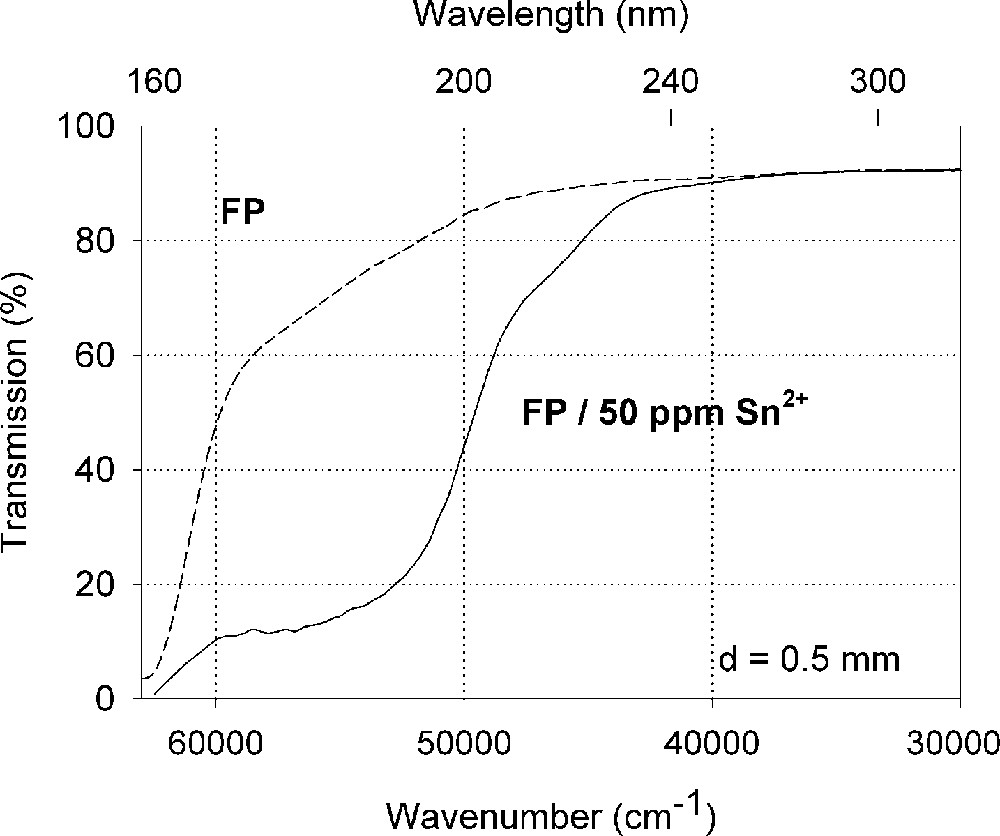
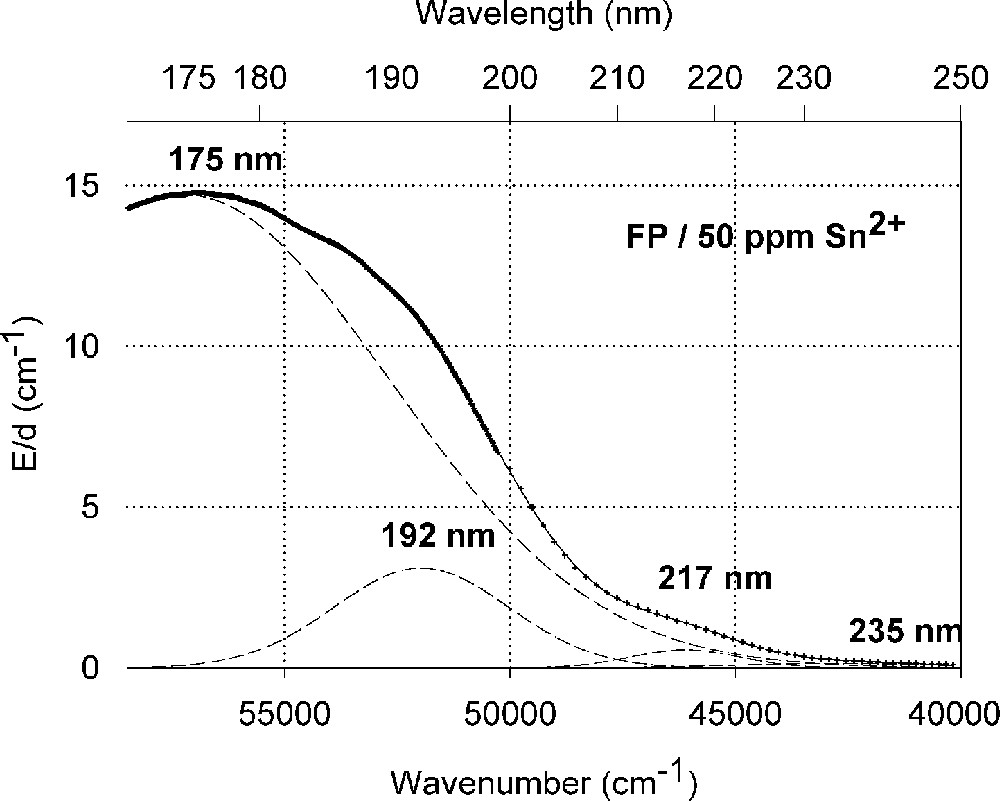
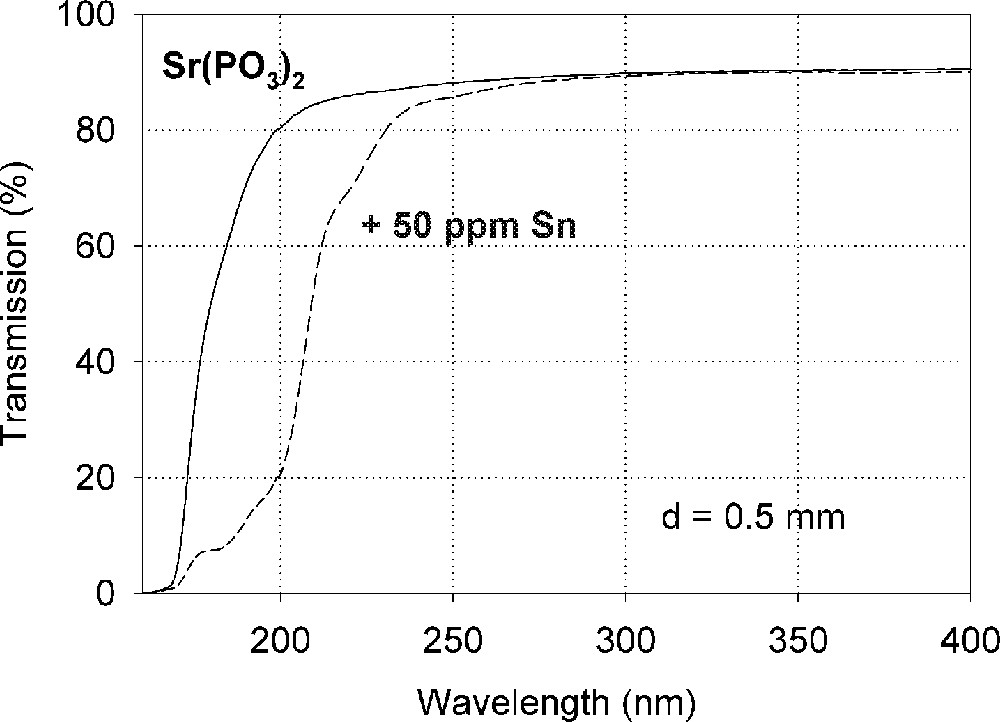
Influence of tin on the ultraviolet absorption of fluoroaluminate glass samples, FP, melted under reducing conditions. (a) Vacuum ultraviolet transmission spectra of FP glass samples with 15 ppm Fe2+ and additional doped with 50 ppm Sn as Sn2+, analysed ∼30 ppm. (b) Peak simulation for s → p electronic transitions of Sn2+ in the FP glass sample with four Gaussian bands (spectra of tin doped minus un-doped glass sample). The dominating band has its maximum in the vacuum ultraviolet region at 175 nm. The absorption > 200 nm is very weak.
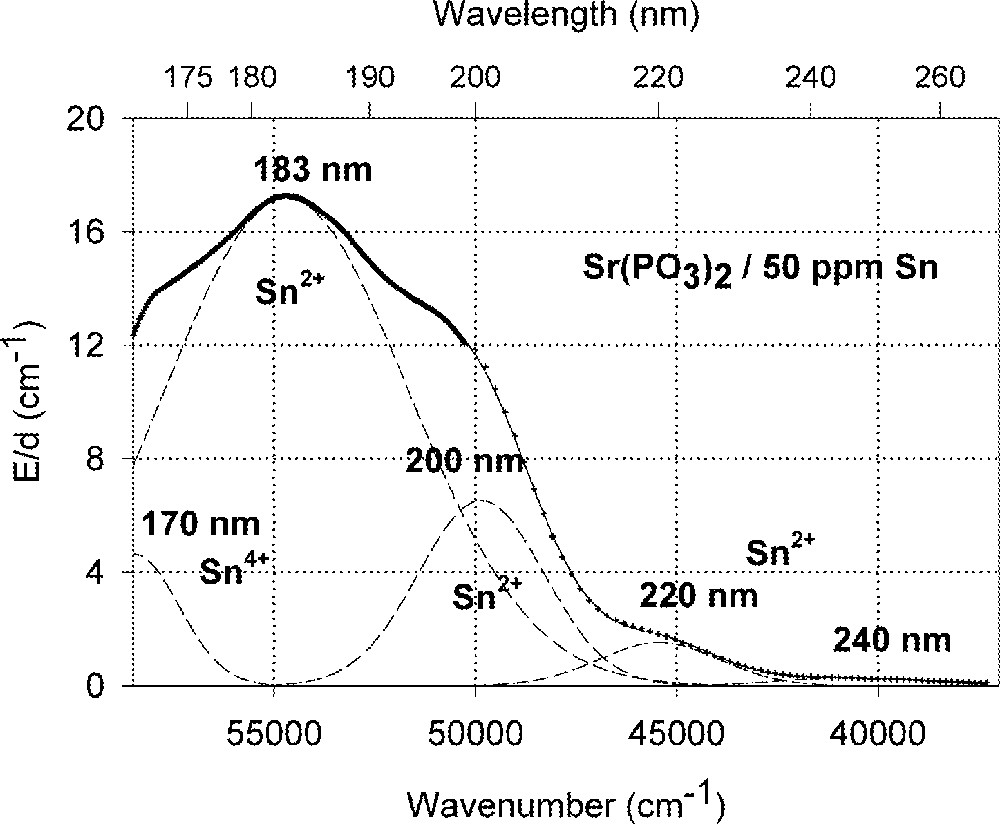
Influence of tin on the ultraviolet absorption of phosphate glass samples, P, melted under normal conditions. (a) Vacuum ultraviolet transmission spectra of P glass samples with < 5 ppm Fe’ and additional doped with 50 ppm Sn, ∼ 35 ppm as Sn2+ and ∼ 15 ppm as Sn4+. (b) Peak simulation for s → p electronic transitions of Sn2+ with four Gaussian bands and one for a possible d → s transition of Sn4+, overlapping with intrinsic VUV edge, in the P glass sample (spectra of tin doped minus un-doped glass sample). The dominating band has its maximum in the vacuum ultraviolet region at ∼180 nm. The absorption > 200 nm is also very weak, but stronger than in the FP glass sample (Fig. 2).
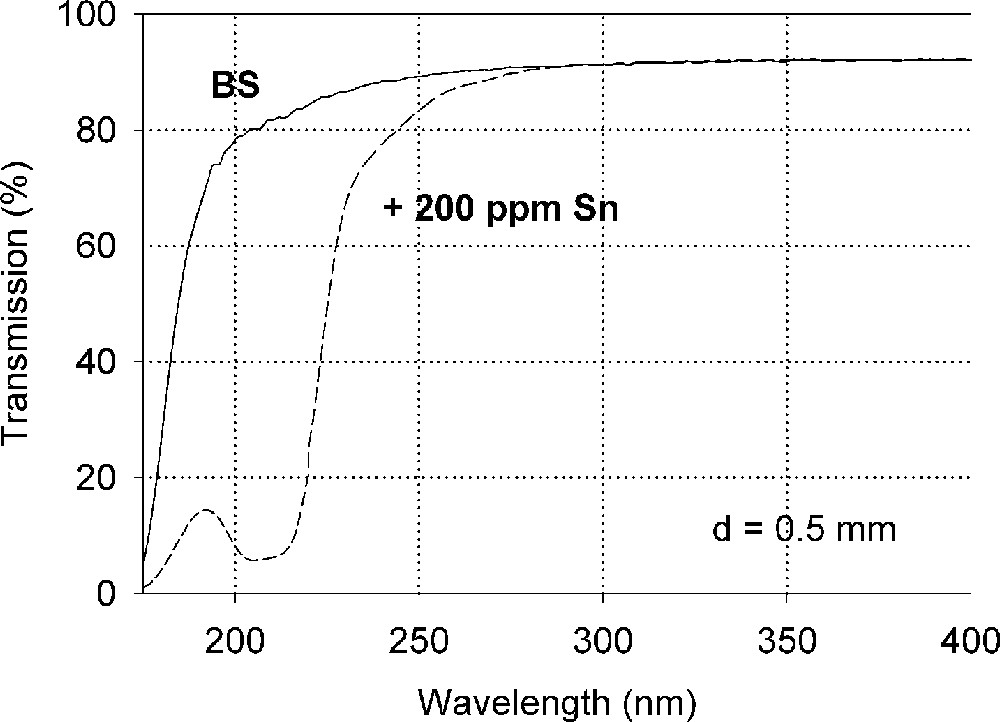
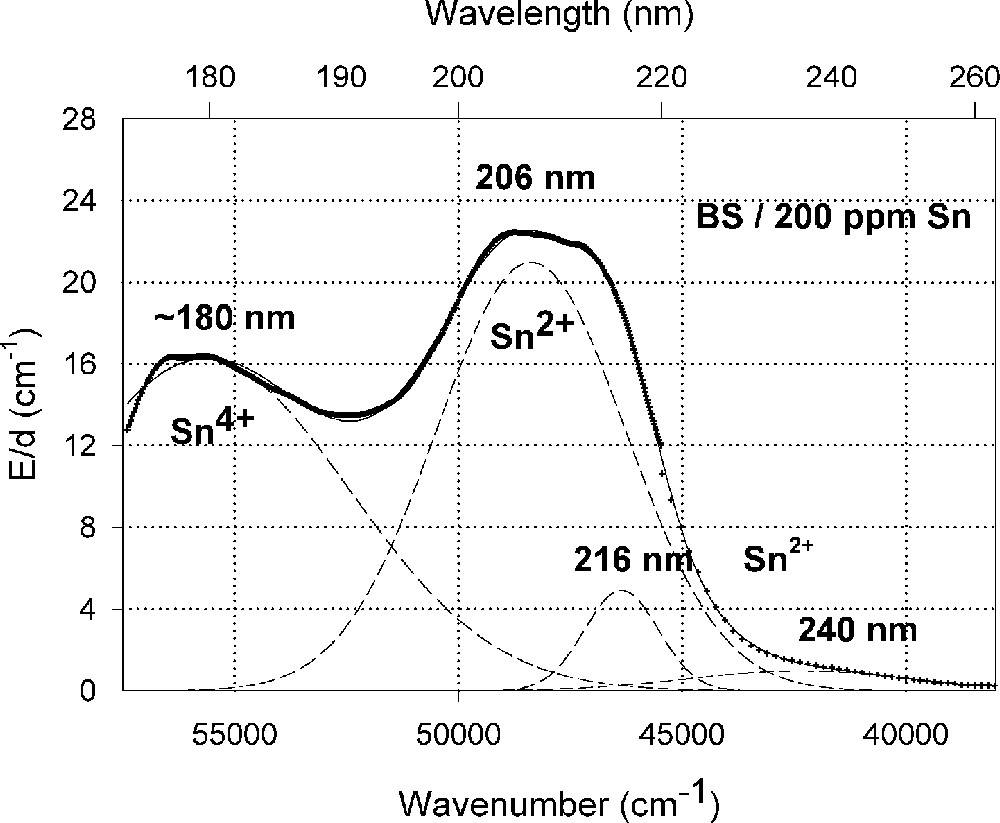
Influence of tin on the ultraviolet absorption of high-purity borosilicate glass, BS. (a) Vacuum ultraviolet transmission spectra of a borosilicate glass sample, BS, doped with 200 ppm Sn in comparison with the undoped sample (Fe < 1 ppm). (b) Peak simulation with Gaussian bands (dashed lines). Three bands for Sn2+ were well fitted in all Sn doped samples with very high accuracy. A fourth band with a maximum at 260 nm was detectable at higher tin concentration. Additionally, one band for Sn4+ was necessary, with a maximum near the intrinsic band edge. After Mössbauer measurements 〚21〛, only 10–15% tin should exist in the Sn2+(∼30 ppm) and 85-90% in the Sn4+ state (∼170 ppm).
3.2 UV-radiation-induced effects in iron-doped glass samples
Fig. 5 demonstrates the typical effect of photo-oxidation of Fe2+ by UV lamp irradiation in fluoride glass samples melted under reducing conditions, FP with ∼15 ppm Fe2+, on UV transmission (a), and the kinetic curves (b) depending on exposure time with increasing phosphate content. No change of Fe3+ species could be detected by UV irradiation of fluoride and phosphate glass samples 〚4〛, in contrast to silicate glass samples.
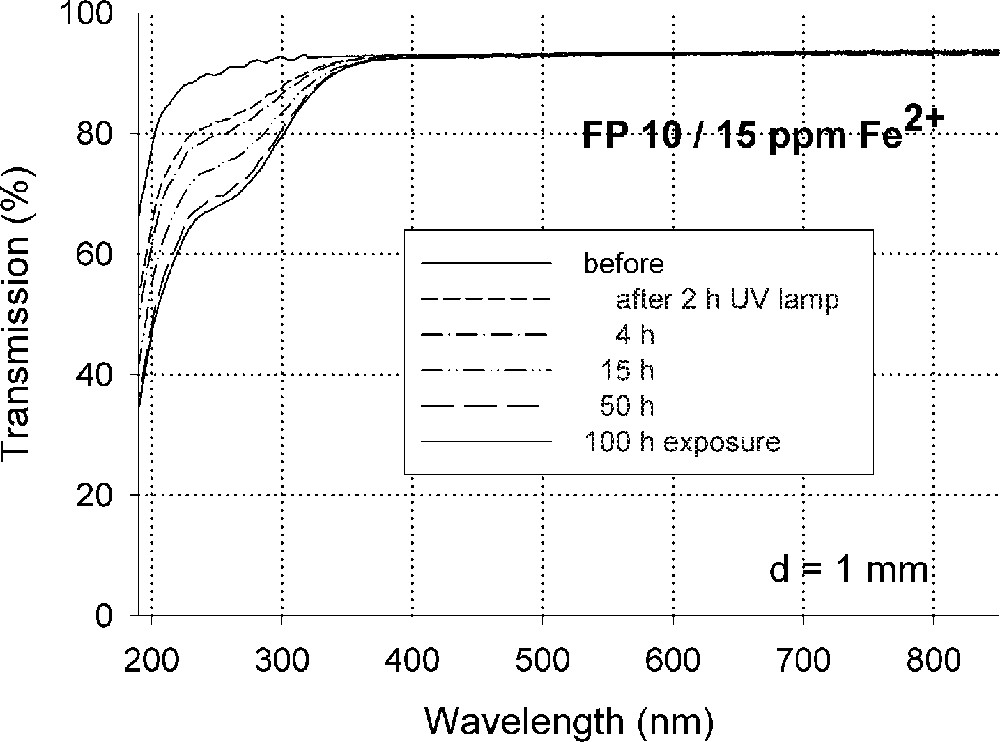
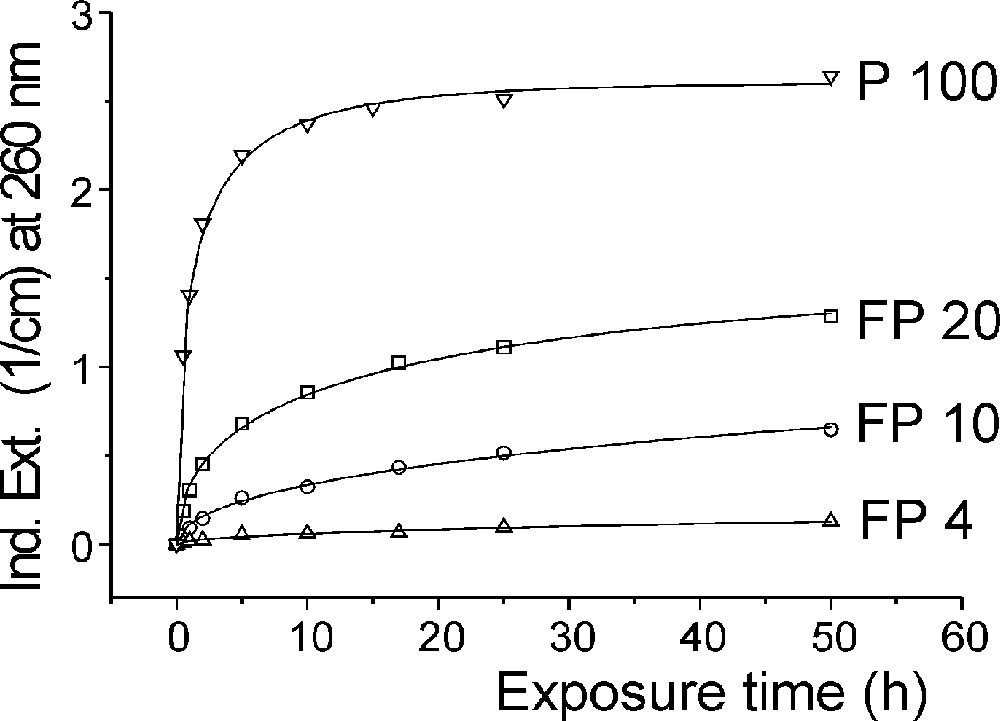
Photo-oxidation of Fe2+ to (Fe2+)+ in fluoroaluminate glass samples by UV lamp irradiation. (a) Change in transmission by UV lamp irradiation after different exposure times. (b) Kinetic curves as a function of increasing phosphate content (4–10–20 mol%) in FP glass samples in comparison with a pure phosphate glass sample (P 100). The initial Fe2+ content in all of the glasses was nearly the same (∼15 ppm). The continuous curves denote the function (1), which is fitted to the experimental data. The error of the measured points is < 0.01 cm–1.
Fig. 6 shows the maximal defect formation curves by different UV lamp irradiation in iron-doped borosilicate glass samples melted under reducing (a) or oxidising (b) conditions. The influence of 193 nm laser irradiation with increasing pulse energy density on BS glass samples with 20 ppm Fe is given in Fig. 7. The kinetic curves are very different, depending on reducing (Fig. 7a) or oxidising (Fig. 7b) melting conditions. Figs. 8a and b illustrate the fitting procedure used in comparison with EPR 〚20〛 analysis in iron doped BS glass samples. Nearly 10 ppm (Fe2+)+ hole centre and mainly boron-related electron centre defects were attributed in samples melted under oxidising conditions (Fig. 8a). Approximately 6 ppm (Fe3+)– electron centre combined with boron–oxygen related hole centre (BOHC) and also boron-related electron centre defects (B-EC) were found in samples melted under reducing conditions (Fig. 8b).
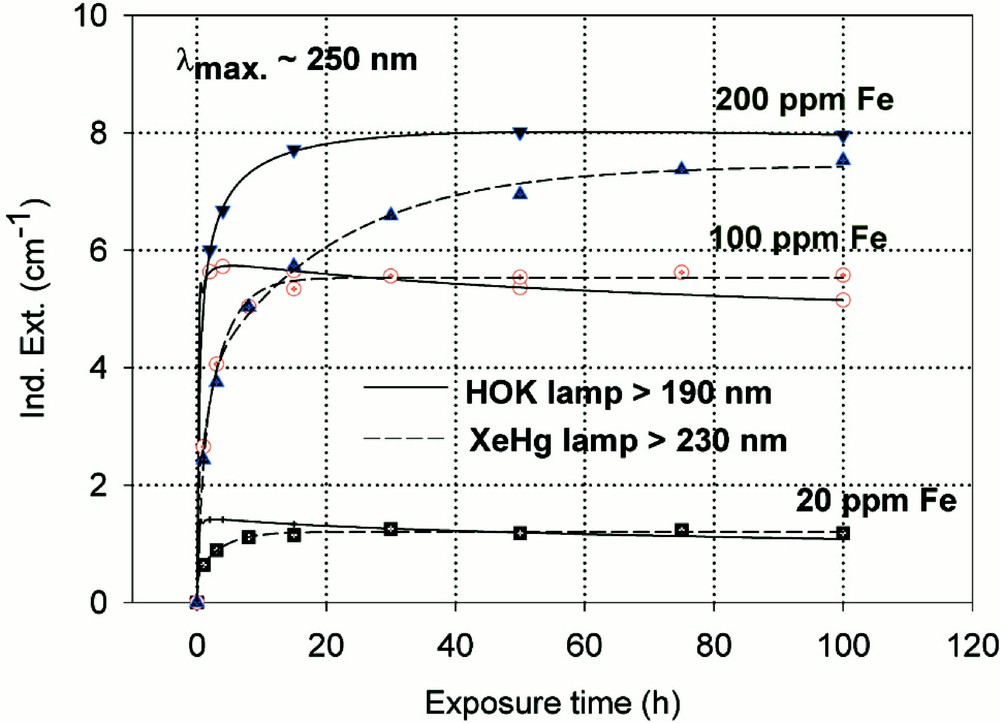
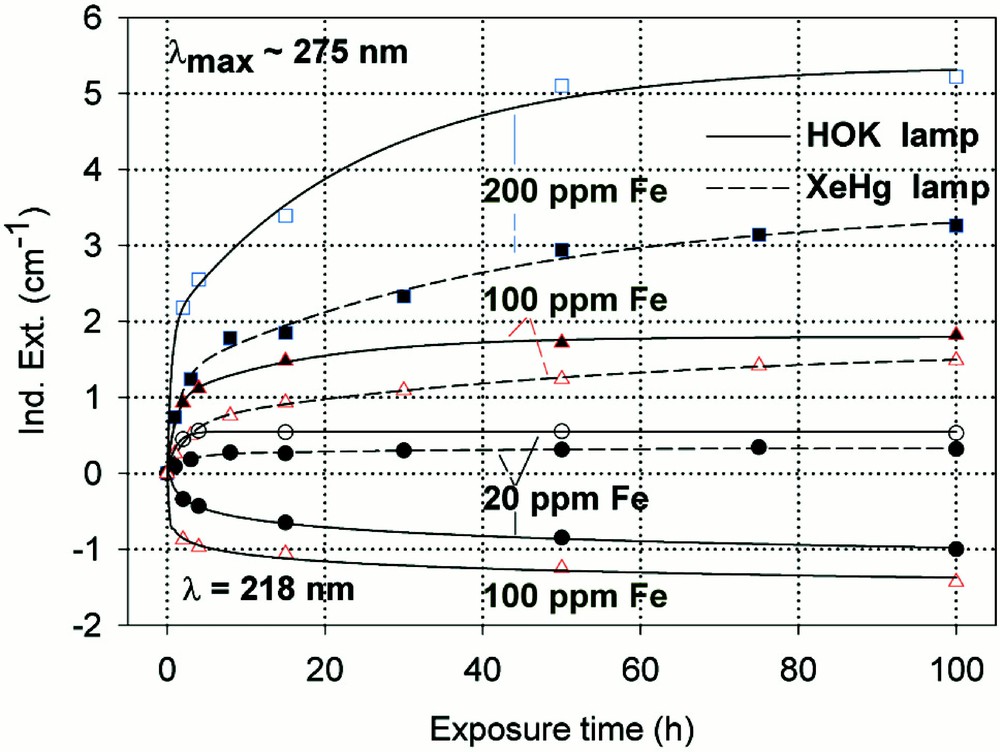
Kinetic curves for the maximal defect generation by different UV lamp irradiation, HOK (λ < 190 nm) and XeHg (λ < 230 nm) lamp, of borosilicate glass samples doped with increasing iron content, 20–200 ppm. (a) Samples melted under reducing conditions: the defect generation at λmax ∼ 250 nm increases very fast with iron content, especially with the HOK lamp. The continuous curves denote the function (2) for the HOK and (3) for the XeHg lamp, which are fitted to the experimental data. (b) Samples melted under oxidising conditions: a significant negative induced absorption at λ ∼ 218 nm is observed only with HOK irradiation in samples doped with 20 and 100 ppm Fe. Their continuous curves denote the function (4), which is fitted to the experimental data. The positive induced absorption at λmax ∼ 275 nm increased with the Fe content; it is also stronger with the HOK than with the XeHg lamp. Their continuous curves denote the function (3) for both lamps.
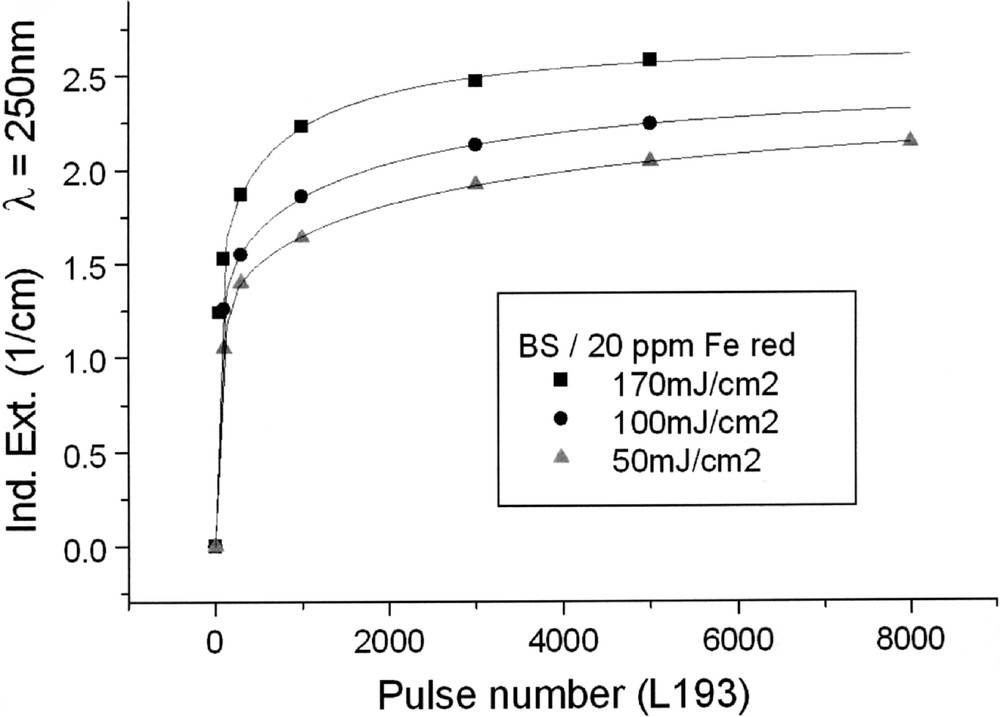
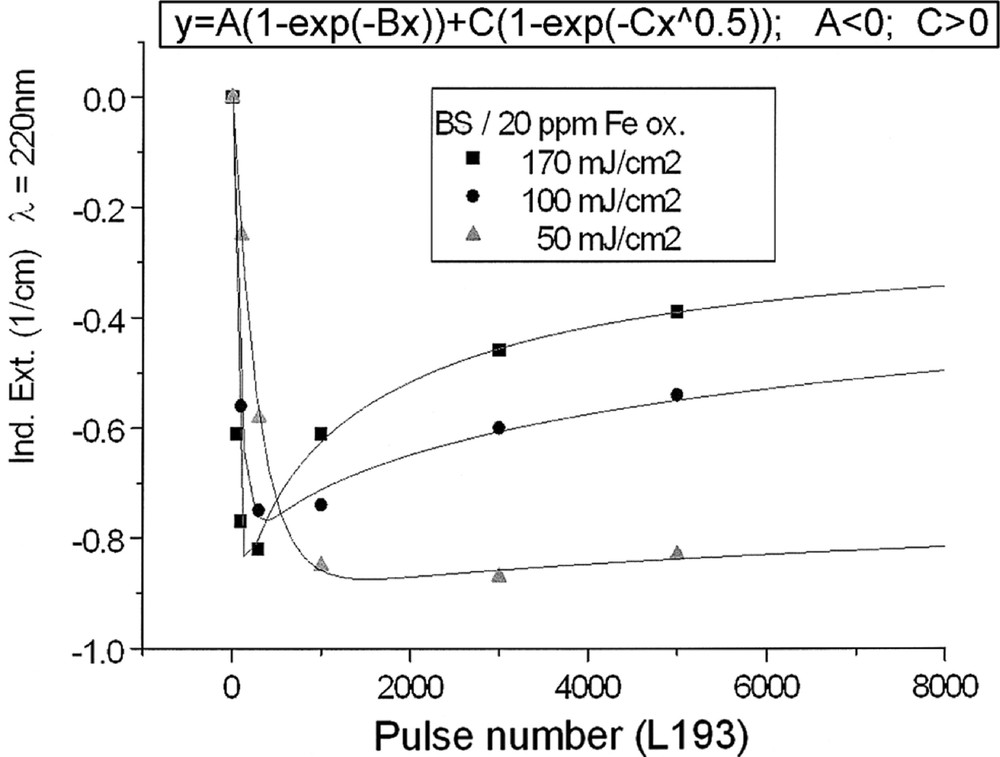
Kinetics for ArF laser defect generation in borosilicate glass samples with 20 ppm Fe melted under (a) reducing and (b) oxidising conditions, depending on pulse energy density: (a) at λ = 250 nm, depending on pulse number, a very fast increase of the defect generation with increasing energy density per pulse is observed; (b) at λ = 220 nm at first, a very fast negative induced absorption is observed, but after more than 100 pulses, this effect goes back, especially at high energy density, 170 mJ cm2; at low energy density, 50 mJ cm–2, the rate of increase is only small. All continuous curves denote the function (5), which is fitted to the experimental data.
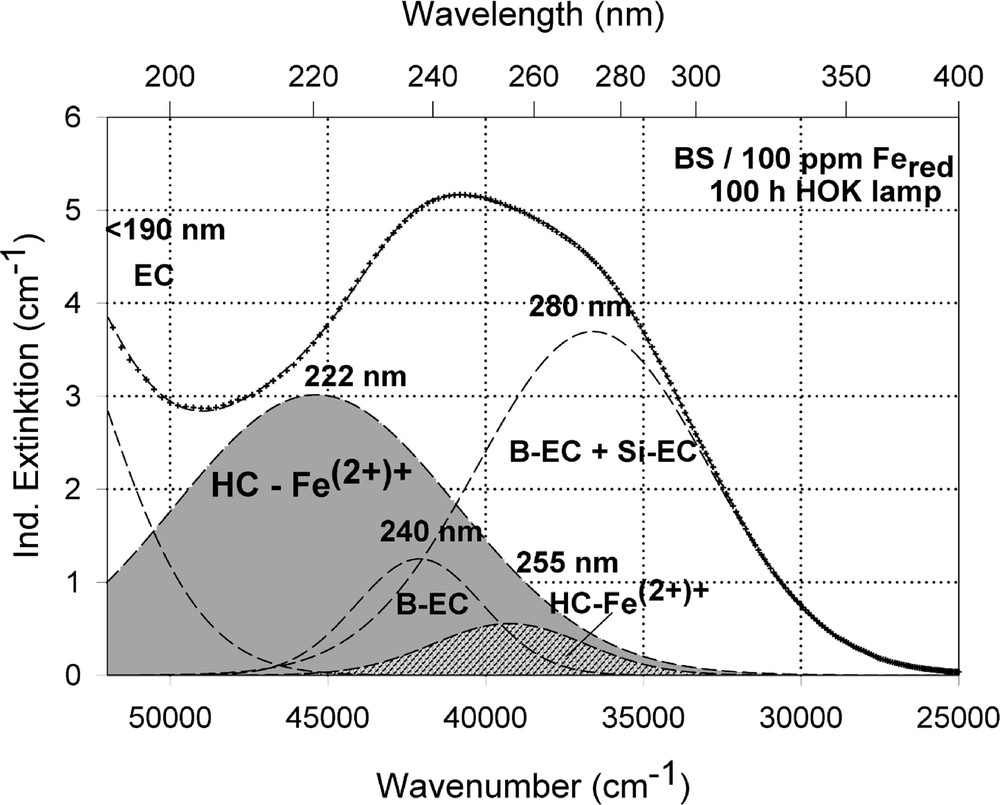
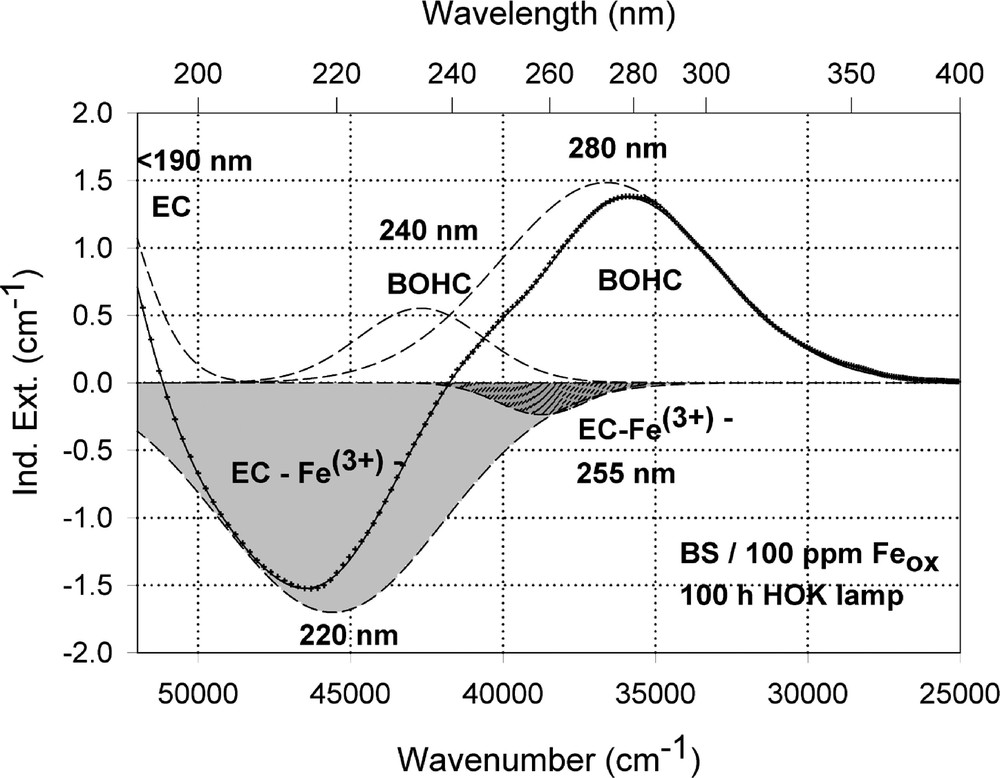
Peak simulation and designation of defect bands in BS samples with 100 ppm Fe after 100-h HOK lamp irradiation: (a) sample melted under reducing conditions; (b) sample melted under oxidising conditions.
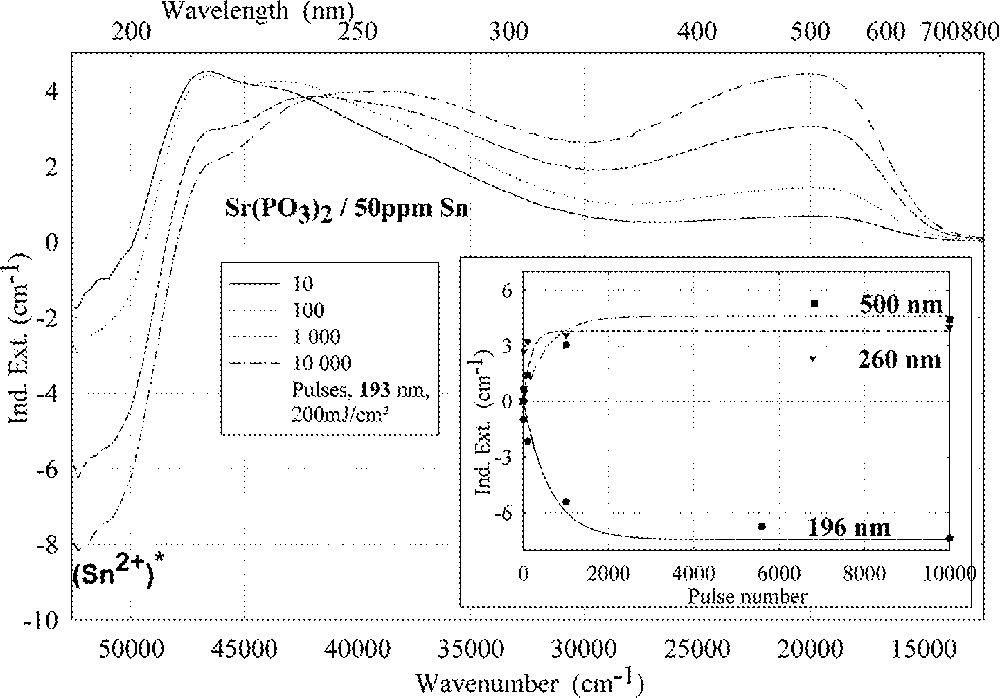
Figs. 9–13 give an overview of the UV lamp and laser-radiation-induced defects in different tin-doped glass samples. Tin-doped fluoroaluminate glass samples, FP/50 ppm Sn as Sn2+, are very stable against UV lamp irradiation. No significant change of the tin absorption was detected in fluoride glass samples, only photo-oxidation of ∼3 ppm Fe2+ from the initial value, 〚Fe2+〛0 ∼ 15 ppm, as impurity (Fig. 9a and b). In contrast to phosphate, Sr(PO3)2/50 ppm Sn with ∼35 ppm as Sn2+ and Fe’ < 5 ppm, and borosilicate glass samples, BS/200 ppm Sn with ∼30 ppm as Sn2+ and ∼170 ppm as Sn4+, in which strong decrease of Sn2+ absorption also occurs with UV lamp irradiation. In FP glass samples with ∼50 ppm Sn2+, tin defect generation was found only with 193-nm excimer laser irradiation, which correlates with a very high negative radiation-induced absorption < 200 nm and positive values > 200 nm (Fig. 10). Defect formation at 193 nm is typical for Sn2+-related defects and at 450 nm for phosphorus oxygen-related hole-centre defects (POHC).
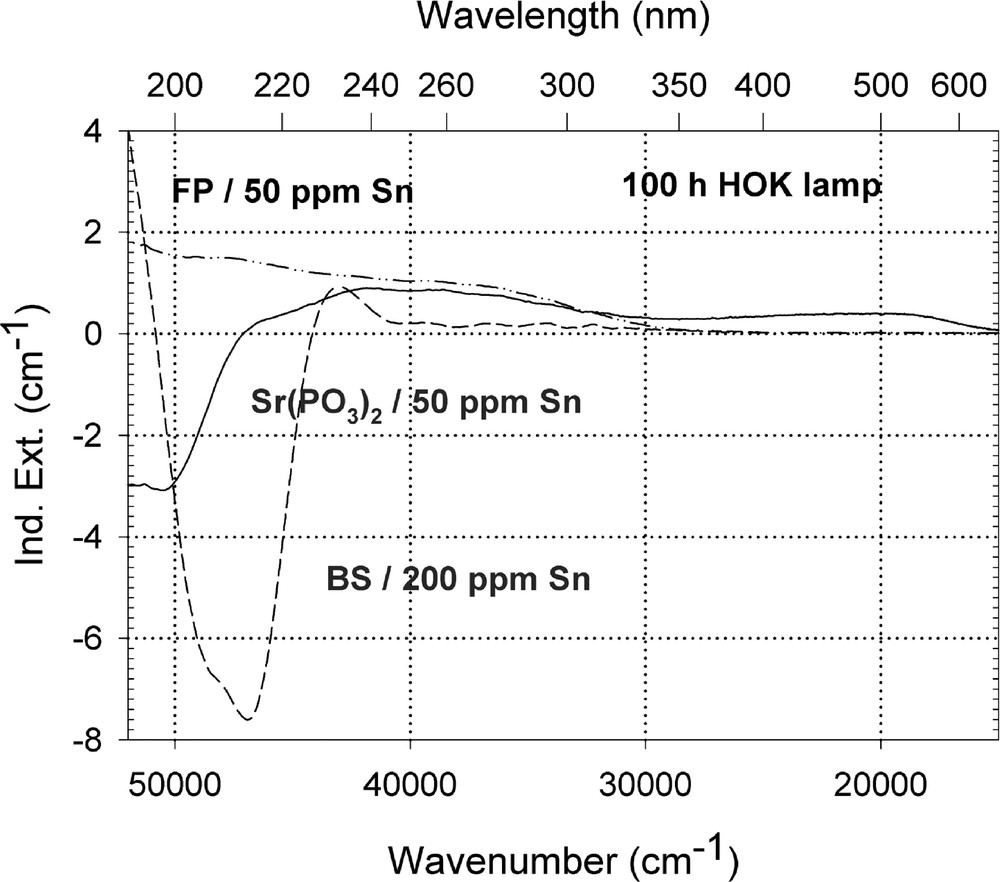
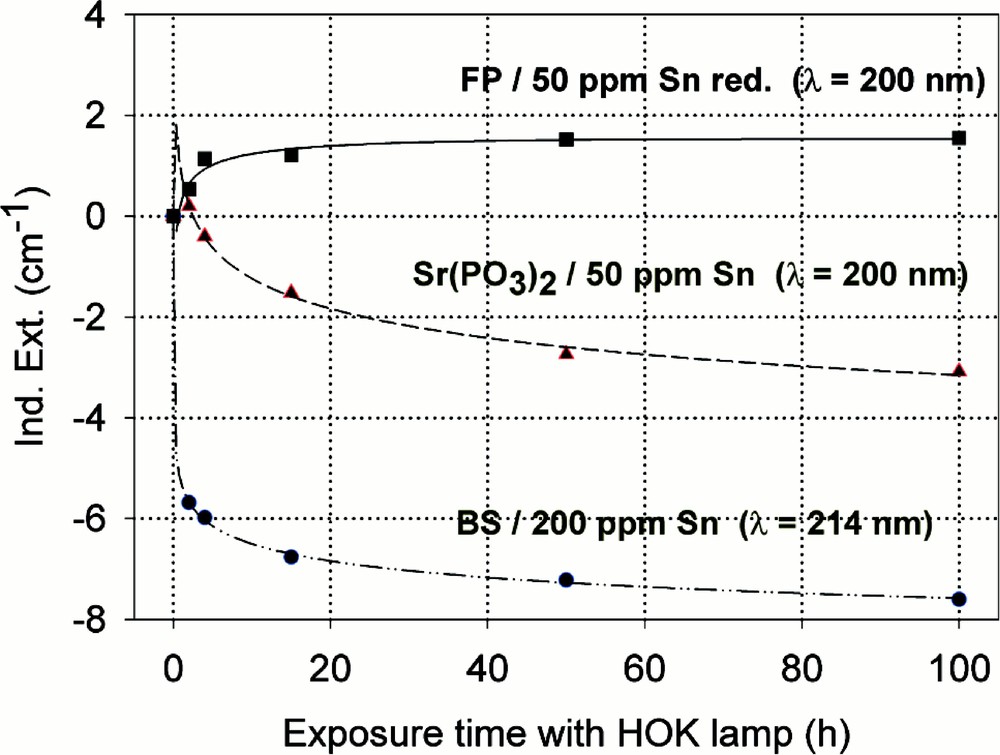
Comparison of UV-lamp-radiation-induced absorption in different tin doped glasses with nearly the same initial Sn2+ content, ∼30 ppm. (a) Negative induced absorption in the region of Sn2+ electron transitions was found only in the phosphate and borosilicate glass samples. No significant change in the tin absorption was detected in fluoride glass samples, only photo-oxidation of ∼3 ppm Fe2+ from the impurity. (b) Kinetic curves for the maximal defect generation. Their continuous curves denote the function (2), which is fitted to the experimental data.
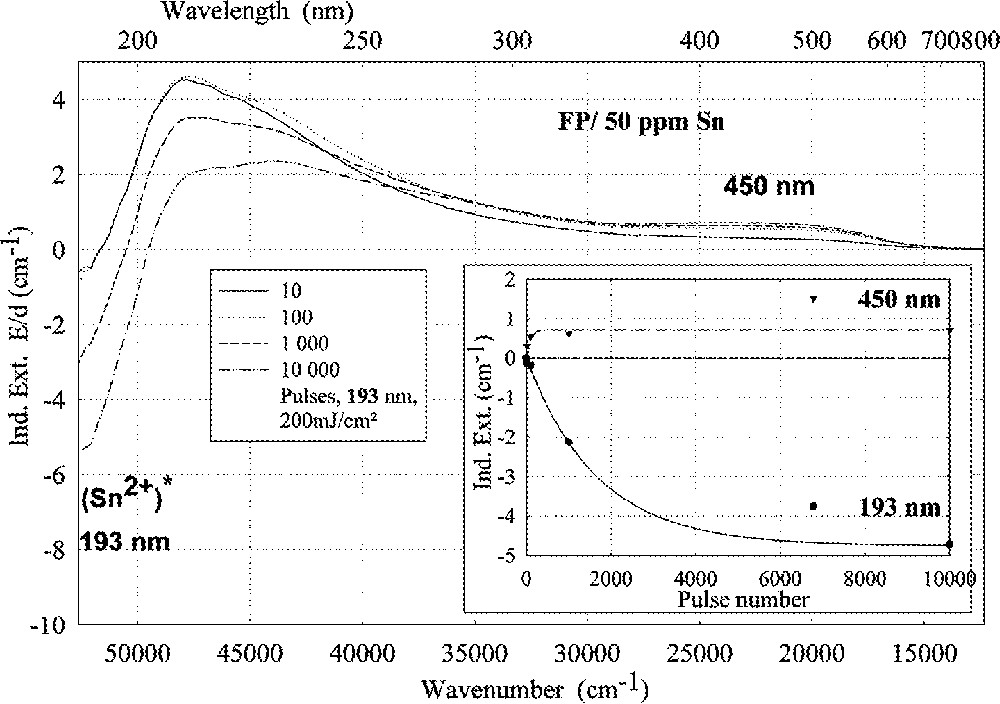
ArF (193 nm)-laser-radiation-induced absorption in a tin-doped FP glass sample depending on pulse number, energy density per pulse: 200 mJ cm–2; the continuous kinetic curves denote the function (6), which is fitted to the experimental data.
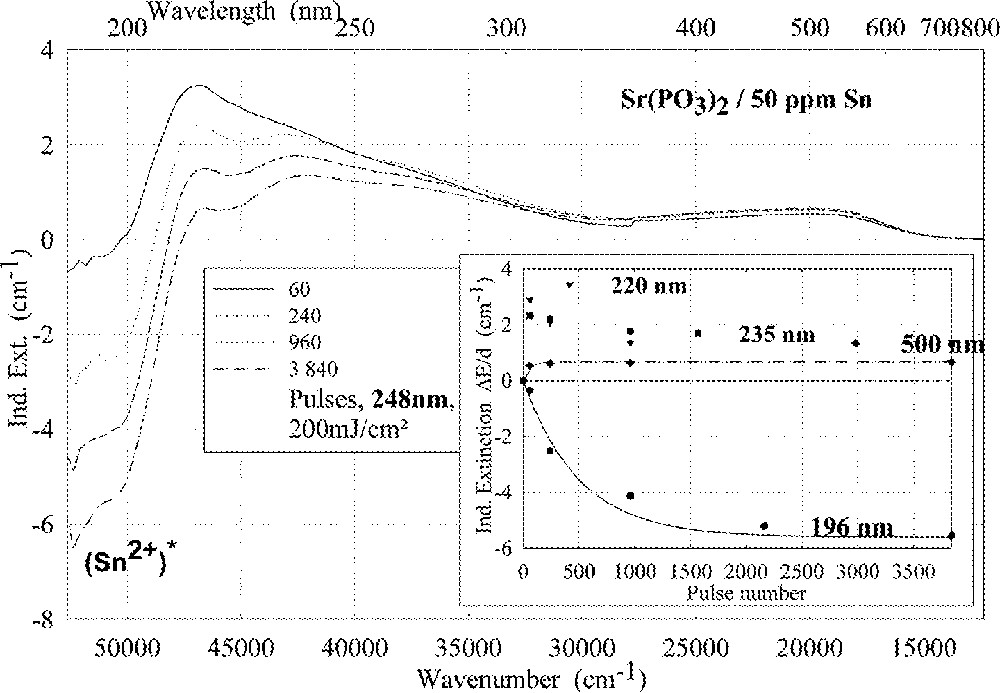
Comparison of laser-radiation-induced absorption in tin-doped phosphate glass samples for different laser wavelengths (with the same energy density per pulse: 200 mJ cm–2): (a) ArF laser at 193 nm, (b) KrF laser at 248 nm. The continuous kinetic curves denote the function (6), which is fitted to the experimental data.
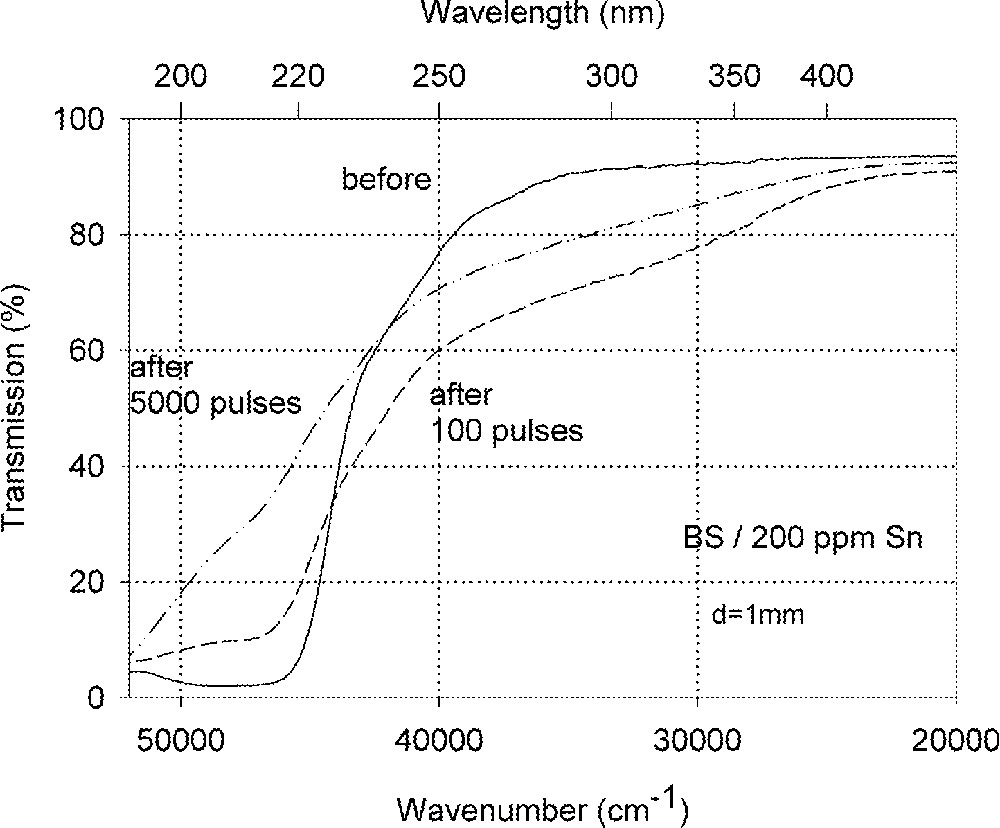
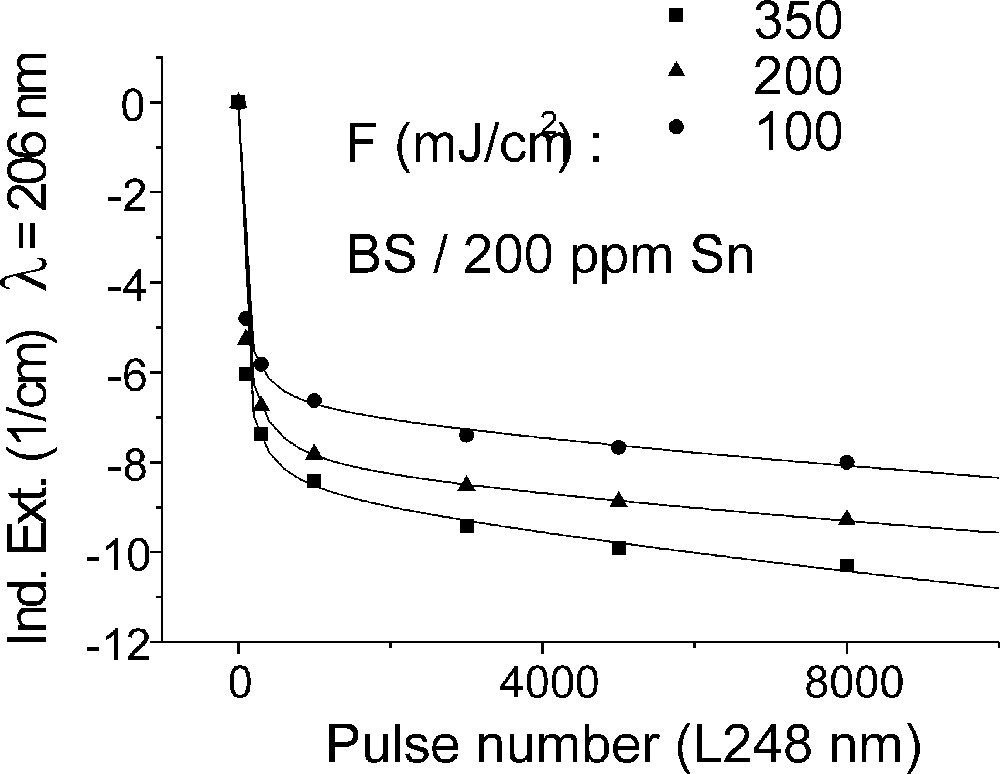
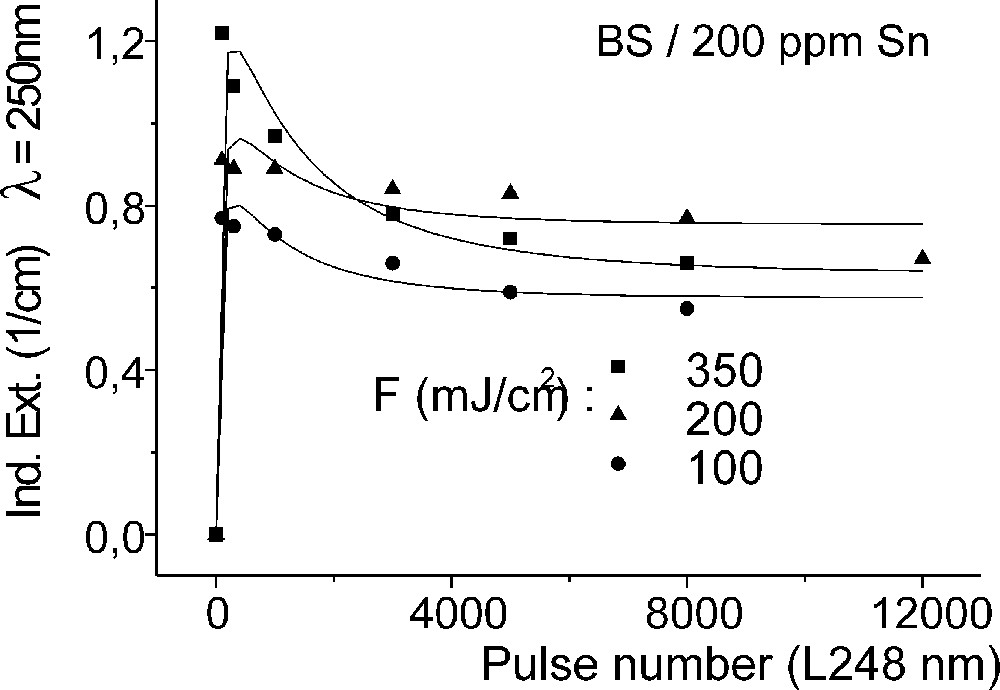
Influence of laser irradiation at 248 nm (KrF) on BS glass samples with 200 ppm Sn (∼30 ppm as Sn2+): (a) UV transmission spectra before and after laser irradiation with a pulse energy density, 350 mJ cm–2; (b) defect formation at 206 nm, depending on energy density and pulse number typical for Sn2+ related defects; (c) defect formation at 250 nm, depending on energy density and pulse number typical for intrinsic defects.
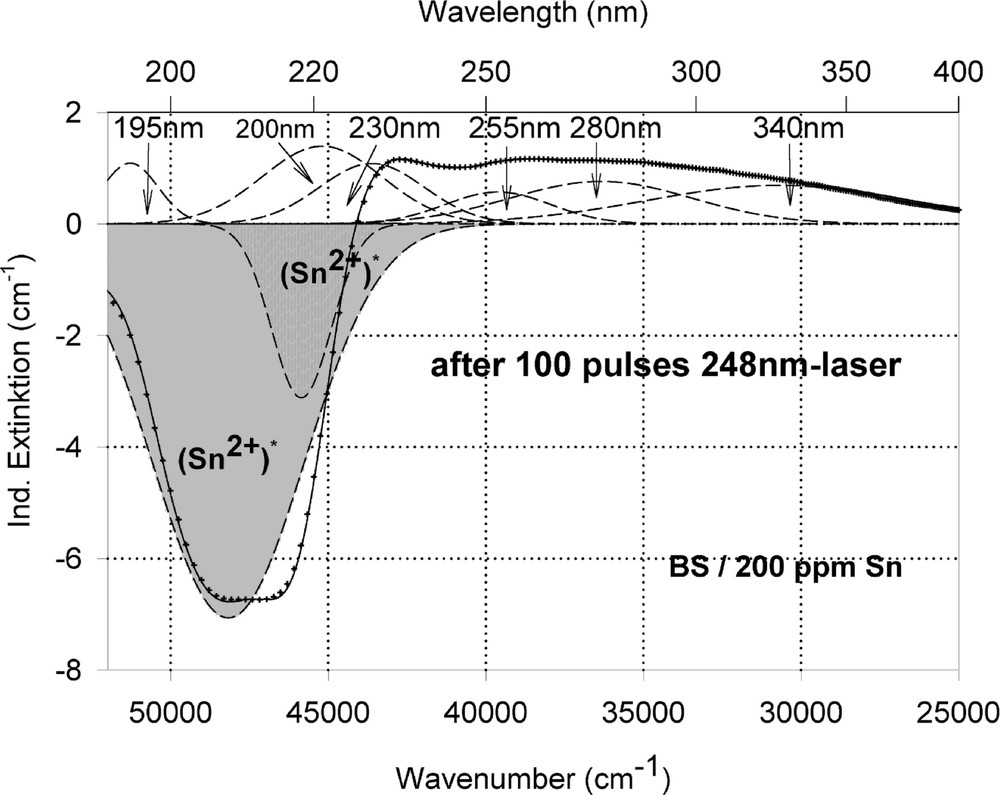
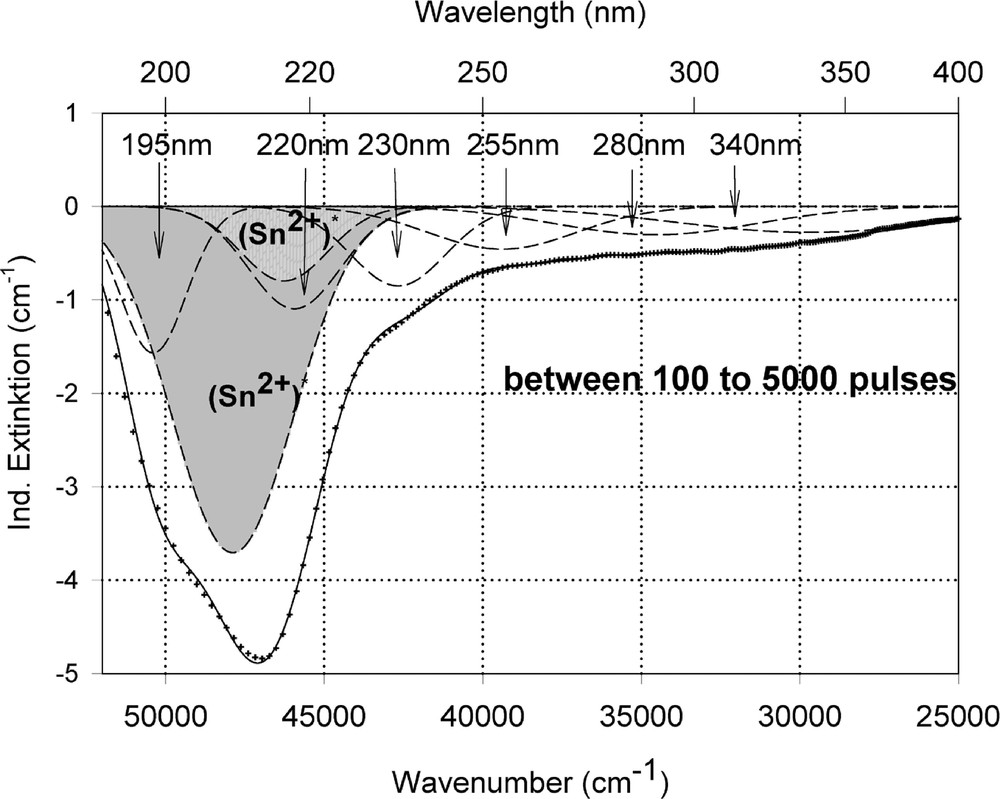
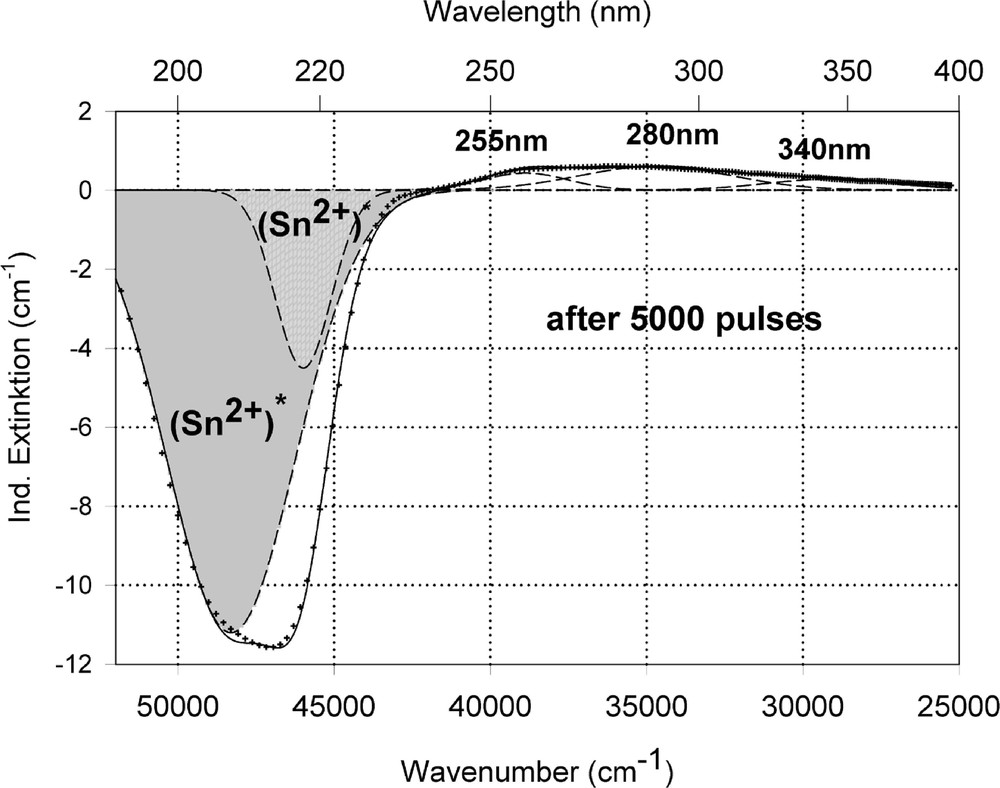
Peak simulation for the induced defects by 248-nm laser irradiation at high energy density, 350 mJ cm–2 per pulse (see Fig. 12): (a) after 100 pulses; (b) between 100 and 5000 pulses; (c) after 5000 pulses.
Fig. 11 compares the tin related defect formation in Sr(PO3)2/50 ppm Sn glass samples by different laser irradiation wavelength at 193 and 248 nm. Defect formation at ∼196 nm is typical for Sn2+-related defects and at ∼500 nm for POHC defects, which are much higher with 193-nm than with 248-nm laser irradiation. Figs. 12 and 13 give an overview of typical UV-radiation-induced defects in borosilicate glass samples doped with 200-ppm tin. The influence of 248-nm laser irradiation depending on pulse number and energy density per pulse is shown. At high energy density, 350 mJ cm–2 per pulse, a very fast change of the UV transmission in a opposite way is observed already after 100 pulses: an increase of the transmission below ∼230 nm and a decrease between 230 and 400 nm. At further irradiation, the increase of transmission < 230 nm is continued slowly, but for wavelengths > 230 nm, an increase in transmission is also found (Fig. 12a). The kinetic curves for the typical defect formation, depending on the pulse number and energy density per pulse, are demonstrated at λ = 206 nm, as the maximum of the Sn2+ absorption, in Fig. 12b, and at λ = 250 nm, in Fig. 12c. The defect generation at 250 nm increases very fast, in the same way as the Sn2+ absorption decreases, reaches a maximum after ∼100 pulses, but then, after further irradiation, this defect generation decreases again. Both effects increase with increasing energy density. Figs. 13a, b and c show a first assumption of a peak simulation for the 248-nm laser-induced defect generation at the highest energy density, 350 mJ cm–2 per pulse. The measured data (lines) could be well fitted with Gaussian functions (dashed lines) with a correlation coefficient > 0.999, and in good agreement with EPR measurements. After 100 pulses, the Sn2+ absorption bands are decreased and a lot of bands, accordingly EPR measurements mainly boron-related EC and HC defects, are formed, Fig. 13(a). Between 100 and 5000 pulses, further decrease of the Sn2+ bands connected with an increase of the boron-related defect bands is observed (Fig. 13b). As a result, after 5000 pulses (Fig. 13c), only a few weak intrinsic bands with maximums at 255, 280 and 340 nm besides the strong negative Sn2+ bands could be detected.
In the EPR spectra of tin-doped BS glass samples three additional signals, with g-values at 1.9775, 1.9866 and 1.9977, were found in all irradiated samples. The nature of these defects is still unknown, but their intensity was increased with increasing tin content.
4 Discussion
4.1 Charge transfer absorption of Fe3+ and Fe2+ complexes in different glasses
The three glass types investigated (Table 1) have very low optical basicity, Λ 〚10〛, and a large intrinsic UV transmission. But their structure is very different 〚4, 5〛 and so their influence on charge transfer absorption of Fe3+ and Fe2+ complexes is also different. The dominating UV absorption bands are caused in all three glass types by Fe3+ complexes. The measured spectra could be well fitted with Gaussian shape bands. In the fluoride phosphate glass FP with the lowest optical basicity, ΛPb = 0.38, and the highest ionic bonding, the band maximum, λ = 260 nm, has the lowest energy (38 500 cm–1 = 4.8 eV), the smallest bandwidth (8000 cm–1), and the lowest specific absorption coefficient, ϵ260 nm = 0.18 cm–1 ppm–1. The charge transfer should occur from the surrounding ligands to the central Fe3+ ion. In the case of FP, ligands are mainly fluorine in six-fold coordination, but oxygen ligands are possible too. The charge-transfer process in glass can be regarded as the promotion of a nonbonding p electron, on the ligand, to the lowest unoccupied energy orbital sited on the metal ion 〚10〛.
In phosphate glasses, Sr(PO3)2 and ultraphosphate 〚4〛, the maximum for the Fe3+ charge transfer band (λ = 240 nm) is shifted to a higher energy (41 700 cm–1 = 5.2 eV), a higher intensity (ϵ240nm = 0.20 cm–1 ppm–1) and a larger bandwidth (10 000 cm–1). These phosphate glasses possess a higher optical basicity, ΛPb = 0.47, and a higher covalent bonding than the FP glass.
The borosilicate glass (BS ∼ Duran) with nearly the same low calculated optical basicity 〚20〛, like the phosphate glass, shows another behaviour for the Fe3+ charge-transfer bands, due to other sites for Fe3+. A very strong and broad band with a maximum at 222 nm (45 050 cm–1 = 5.6 eV) is dominating (Fig. 1) and in good agreement with the data in high-purity soda–silica glass 〚13〛. A very high specific absorption coefficient, ϵ222nm = 0.30 cm–1 ppm–1, was determined. But a second smaller band with a maximum at 255 nm with lower intensity (ϵ255nm = 0.06 cm–1 ppm–1) was necessary for a well fitting of all measured spectra of iron doped BS glass samples. These Fe3+ charge transfer bands could be determined in all glasses investigated with high accuracy 〚2–4〛. Further transitions for Fe3+ and Fe2+ are assumed near the intrinsic UV edge of the glasses (Fig. 1a).
Exact determination of the Fe2+ charge transfer bands is more difficult. Only in FP glasses was it possible to shift the redox ratio completely to the Fe2+ state 〚2–4, 12, 20〛 and to determine the bands with high accuracy (Table 2). However, in phosphate and silicate glasses, the values for the Fe2+ charge transfer bands determined have a larger error. The main band maximum is between 215 and 220 nm, with a much lower intensity (ϵλ: 0.006 to 0.03 cm–1 ppm–1) than those for Fe3+.
4.2 Electronic transitions for Sn2+ and Sn4+
Three or four electronic s → p transitions for Sn2+ with 5s2 configuration were detected by optical absorption and luminescence 〚20, 22〛 spectroscopy shifted to longer wavelength in the range FP → P → BS glass samples with increasing covalent bonding (Table 3). These electronic transitions are parity allowed and depends strongly from the host glass (Figs. 2–4). Three transitions could be well fitted in glass samples with only a few ppm Sn2+ (Figs. 2b and 3b); with higher Sn2+ content, a fourth band at longer wavelength was found (Table 3). The highest intensity should have the allowed 1S0 → 1P1 transition with a maximum at ∼175 nm in FP, ∼180 nm in P and at 206 nm in BS glass samples. The 1S0 → 3P2 is forbidden (ΔJ = 2), but can obtain some intensity by coupling with vibrations, assuming for the fitted band with a maximum at 192 nm in FP, at 200 nm in P and at 216 nm in BS glasses. A third band, with a maximum at 217 nm in FP, at 220 nm in P and at 240 nm in BS samples and low intensity was fitted assuming for the 1S0 → 3P1 transition, which is spin-forbidden but can also be observed, due to spin-orbit coupling, which mixes the spin triplet and singlet states 〚20, 22〛. The intensity ratios detected for the four transitions in all tin-doped glass samples investigated were approximately 10:5:1:0.1. The specific absorption coefficients, ϵλ, were calculated with chemical analysis, absorption and luminescence spectroscopy and Mössbauer measurements on samples doped with higher tin contents (0.5–1%) and melted under the same conditions 〚21〛. Only 10–15% of the total tin content was found in the Sn2+ state in BS samples. The extrapolation to very low Sn concentration is still a problem, and so the absolute values for the absorption coefficients are not so sure.
Absorption bands and specific extinction coefficients ϵλ for Sn2+ and Sn4+ complexes in different host glasses.
| Glass | Sn2+ | Sn4+ | ||||||||
| λmax (nm) | Energy | ϵλ (cm–1 ppm–1) | Width (cm–1) | λmax (nm) | Energy | ϵλ (cm–1 ppm–1) | Width (cm–1) | |||
| (cm–1) | (eV) | (cm–1) | (eV) | |||||||
| Fluoride FP | 175 | 58 000 | 7.3 | 0.4 ± 0.1 | 11 000 | < 170 | >58 000 | >7.3 | ||
| 190 | 52 600 | 6.5 | 0.2 ± 0.1 | 5000 | ||||||
| 217 | 46 000 | 5.7 | 0.02 ± 0.01 | 3000 | ||||||
| 235 | 42 300 | 5.2 | ∼ 0.002 | 6000 | ||||||
| Phosphate P | ∼185 | ∼54 000 | ∼6.9 | 0.4 ± 0.1 | ∼6000 | ∼170 | ∼58 000 | ∼7.3 | ||
| 200 | 50 000 | 6.2 | 0.2 ± 0.1 | 4000 | ||||||
| 220 | 45 500 | 5.6 | 0.05± 0.1 | 4000 | ||||||
| 240 | 41 700 | 5.2 | ∼ 0.005 | 5000 | ||||||
| Borosilicate BS | 206 | 48 500 | 7.0 | 0.5 ± 0.2 | 5400 | ∼180 | ∼56 000 | 6.9 | ∼0.1 | ∼8000 |
| 216 | 46 300 | 5.7 | 0.2 ± 0.1 | 2200 | ||||||
| 240 | 41 700 | 5.2 | 0.04 ± 0.01 | 5600 | ||||||
| 260 | 38 500 | 4.8 | ∼ 0.005 | 6000 |
In the case of FP and P glasses, the Sn4+/Sn2+ ratio could be completely shifted to Sn2+ by melting under reducing conditions in a carbon crucible at temperatures > 1000°C 〚21〛. The s → p transitions are shifted in the vacuum UV region (Figs. 2 and 3) and these measurements have a larger error (∼30%) (Table 3).
For the Sr(PO3)2 glass sample doped with 50 ppm Sn, exists only an estimated value of ∼30 ppm Sn2+. The Sn2+ luminescence excitation and emission spectra 〚20〛 are also strongly dependent on the host glass. Narrow bands were measured in BS and very broad bands in FP samples different from those in P samples, due to the influence of the various local structure (surrounding ligands). But all measured spectra could be also well fitted with three or four Gaussian bands.
In all glasses investigated, a d → s electronic transition band with low intensity for Sn4+ in the VUV was found overlapped with the intrinsic edge (Table 3).
4.3 Radiation-induced effects in iron doped glasses
The influence of iron on radiation-induced effects in phosphate and fluoride phosphate glasses was described in previous papers 〚2, 4, 14, 15〛. Photo-oxidation of Fe2+, forming (Fe2+)+ hole centres (HC) and phosphorous related electron centres (EC) as a single photon process, was found with UV-lamp and laser irradiation in both glass types, phosphates (ultra- and meta-phosphates) and fluoride phosphates melted under reducing conditions (Fig. 5a and b). But the time dependence to reach the saturation value, for which a maximum of 50% of the initial Fe2+ content has been photo-oxidised, was very different. The measured kinetic curves could be well fitted with the function:
High-purity borosilicate glass samples, BS, with Fe < 10 ppm, are very stable against UV-lamp and 248-nm laser irradiation 〚6, 20〛. Therefore, the formation of UV-radiation-induced defects increases drastically with increasing iron content, especially in samples melted under reducing conditions (Figs. 6–8). BS samples for technical use normally have an impurity content of 100 to 200 ppm Fe. These glasses melted under reducing conditions have a good transmission in the UV–B region (280–320 nm) but unfortunately also a high solarisation (Fig. 6a and b), which increases with shorter wavelength irradiation (HOK > XeHg lamp). The kinetic curves for the maximal defect generation in Fe-doped BS samples melted under reducing conditions at λmax ∼ 250 nm (Fig. 6a) could be well fitted with the following functions:
- • for HOK-lamp irradiation
- • for XeHg-lamp irradiation
In the case of samples melted under oxidising conditions (Fig. 6b), the maximal positive defect generation at λmax ∼ 275 nm, depending on the exposure time x, could be fitted for both lamps with the same function (3), and for the negative defect generation at λmax ∼ 218 nm with a simpler function (4):
This means that the mechanisms for the radiation-induced processes are very difficult to recognise, because they are very complex. The defects can change. With HOK and laser irradiation, the formation curves can pass through a maximum or a minimum, due to change of photo-oxidation into photoreduction of the iron species, which is strongly dependent on the irradiation wavelength and the energy density (Figs. 6a and 7b). This makes the extrapolation of the defect generation for long-time irradiation very difficult, but increases the defect generation in silicate glasses with increasing iron content generally. Most kinetic curves can be well fitted with the function:
The designation of the generated defect was assumed by correlation of the induced optical bands, EPR analysis combined with thermal annealing experiments 〚20〛. It was found that photo-oxidation of Fe2+ is the first dominating step in all samples melted under reducing conditions. That means Fe2+ absorbs an UV photon and loses an electron to form stabilised (Fe2+)+ defect hole centres. The electron is trapped, forming boron- and silicon-related electron centres (Fig. 8a and b). The maximum for the induced (Fe2+)+–HC absorption band is at the same position as that for the Fe3+ charge-transfer transition, at 222 nm (Fig. 8a). The fitted maximums for boron- and silicon-related EC are assumed at 240 and 280 nm. In BS glass samples with low alkali contents, boron-related EC defects dominate. The superposition of the induced bands leads to a maximal radiation-induced absorption at ∼250 nm. The photo-oxidation rate is very high and increases with the energy density and the excitation efficiency for the Fe2+ species. The last is higher for the HOK, λ > 190 nm, than for the XeHg lamp, λ > 230 nm. In samples doped with 100 or 200 ppm Fe, the saturation value is not reached after 100 h irradiation with the XeHg lamp (Fig. 6a). The fitting results have shown that only 15 to 40% of the initial Fe2+ content was photo-oxidised. With HOK lamp irradiation, then an another process is initiated: the photoreduction of Fe3+, forming a (Fe3+)– defect electron centre by electron trapping and a boron-related hole centre (BOHC, λmax ∼ 280 nm), and also a boron-related electron centre (B-EC, λmax ∼ 240 nm), was detected as the dominating process in all samples melted under oxidising conditions (Figs. 6b, 7b, and 8b). The total content of the photo-reduced (Fe3+)– is very low, only 5 to 10% of the initial Fe3+ content; e.g., in the sample, BS/20 ppm Feox, a maximum of 2–3 ppm Fe3+ was reduced to (Fe2+)– by HOK or laser (248 nm) irradiation (Figs. 6b, 8a and b). No significant photoreduction could be detected with XeHg-lamp irradiation and course-selective excitation of photoelectrons, λ > 230 nm; the highest values were found with X-rays, for which an avalanche of electrons is released 〚20〛. Irradiation with the 193-nm laser, near the UV edge 〚5, 16〛, generates also intrinsic defects of BS in the visible region and an efficient fast photoreduction of Fe3+ (Fig. 6b). The results of the optical spectroscopy were consistent with those of the EPR analysis 〚20〛, also for the Fe3+ signal at g ∼ 4.3.
The initial reaction for the solarisation should be the release of an electron. In the case of oxidised melted samples, it is not clear where does this electron come from? High-purity BS samples, Fe < 1 ppm, are very stable against UV lamp and laser (248 nm) irradiation (Fig. 4), but solarisation increases with increasing the iron content. It could be also possible that traces of Fe2+ (< 10% of the total Fe content) in the oxidised samples are responsible for the first step, the release of an electron, as the initiator for the photoreduction of Fe3+. But there has to be still an influence of the surrounding glass matrix, because this process was not found in fluoride and phosphate glasses 〚4, 14, 15, 17, 20〛. In these glasses, Fe3+ species were not able to trap an electron and stabilise a (Fe3+)– defect electron centre. This is in contrast to the chemical reduction of Fe3+ to Fe2+ in the glass melt, which occurs very easy in FP and P systems 〚2–4〛. In the melts, a relaxation of the local structure for stabilising the reduced species is possible, whereas in the glass at room temperature this relaxation is not possible. The Fe3+ complexes are very stable and not involved in radiation-induced processes. They can be used as filters for increasing the radiation resistance. This is the main difference between fluoride and phosphate glasses, on the one hand, and silicate and borosilicate ones, on the other hand; in these latter, both Fe2+ and Fe3+ species take part into UV-radiation-induced processes, due to the local glass structure.
The photo-oxidised (Fe2+)+ defects in all glass samples investigated can also be formed with thermal treatment of irradiated glasses and no recovery was detected, in contrast to the photoreduced (Fe3+)– defects, which were annealed to Fe3+ by thermal treatment below the Tg temperature.
4.4 Radiation-induced effects in tin doped glasses
Tin doped FP glasses (Figs. 2a, 9a and b) are very stable against UV lamp irradiation, in comparison to tin-doped P and BS glasses. The HOK lamp spectrum starts at very short wavelengths, > 190 nm, for which an excitation of the Sn2+ electronic transitions is possible in all glasses investigated (Fig. 2–4). But, in FP glasses, no significant change in Sn2+ absorption bands with UV lamp irradiation was detected, but only photo-oxidation of Fe2+ as an impurity (Fig. 9a and b). This means that the fluoride glass structure prevents a tin-related defect generation by UV lamp irradiation. With 193-nm laser irradiation, pulse energy density 200 mJ cm–2, a fast Sn2+-related defect generation in FP glass samples was found (Fig. 10). The dependence of the measured kinetic curves on pulse number could be well fitted with the following equation (6):
Sn4+ species, which absorb in the shorter UV range (Fig. 2b) should also participate in the defect generation process. A model of defect generation in silicate glasses, doped with As, Sb, Sn, Pb or Ti, very similar to the mechanism of defect generation in FP glasses doped with Pb, is suggested 〚6, 15, 20〛. It can be explained by a two-step absorption process. This includes absorption of UV photons, an energy transfer process between the excited species, introduced by the dopants, and the precursors. The existence of Sn2+ or other ions, e.g., As3+, Sb3+, Pb2+, with s2 electronic configurations, which also show luminescence transitions, is very important for the defect generation. The disappearance of the s2 ions, which can be detected by the radiation-induced decrease in luminescence, explains the loss of induced extinction after passing through a maximum. In the case of tin-doped glasses, where the redox ratio Sn2+/Sn4+ can vary in a wide range between Sn2+ and Sn4+, both species can be involved in radiation-induced processes in all three glass types investigated.
5 Conclusions
The intrinsic VUV edge of glasses with low optical basicity is shifted towards longer wavelength in the range FP → P ∼ BS (Duran with ultra high purity). Charge transfer transitions of Fe3+ complexes are dependent on the glass matrix, i.e. the local glass structure. The maximum of the dominating Fe3+ band has the lowest intensity and energy in the FP glass with the lowest optical basicity and the most ionic bonding. In the P glass, the energy and intensity are a little higher. The highest energy and intensity were found in the BS glass. The charge-transfer bands for the Fe2+ complexes have much lower specific absorption coefficients than those for Fe3+ complexes in all glasses investigated.
The three s → p transitions for Sn2+ are much more influenced by the host glass than the charge-transfer transitions for Fe3+ and Fe2+ complexes. Their positions are strongly shifted to higher energies (shorter wavelength) in the range BS → P → FP. The redox ratio is shifted in the same range to the Sn2+ state. Sn4+ absorption bands (d → s) were found at shorter wavelength, near the intrinsic band edge, in all glasses investigated.
UV-lamp- and laser-radiation-induced defects were studied. Photo-oxidation of Fe2+ to (Fe2+)+–HC and EC-defects depending on the glass matrix with a single-photon mechanism was detected in all glasses. Fe3+ species participate in the radiation-induced processes only in silicate glasses. In FP and P glasses they are not able to trap an electron and stabilise a (Fe3+)– defect electron centre.
Sn2+ species in FP glasses are very stable against UV lamp, but not against 193-nm laser irradiation. In P and BS glasses, Sn2+ species are photo-oxidised also under UV radiation very fast. A two-step mechanism for the defect generation should be assumed. This includes absorption of UV photons, an energy transfer process between the excited Sn2+ species and the intrinsic precursors of the glass matrix and visa versa. Defects can change into each other very fast. Both, Sn2+ and Sn4+ are involved in the radiation-induced processes.
Acknowledgements
The author wishes to thank R. Atzrodt, P. Ebeling, R. Marschall, D. Möncke and U. Natura for the measurements and assistance, and the Deutsche Forschungsgemeinschaft (DFG, contract-number EH 140/2 and 3) and Schott Glas, Mainz, Germany, for financial support. U. Kolberg, K. Naumann, and S. Ritter are also acknowledged for helpful assistance and discussions.