

1 Introduction
Development of erbium-doped fiber amplifiers (EDFA) has attained enormous commercial success of fiber-optic telecommunication using the 1.55-μm wavelength band 〚1〛. However, amplifiers in the 1.31-μm communication window have received less attention, even though silica glass shows zero dispersion in the 1.31-μm wavelength region and most installed fibers worldwide are optimized at this wavelength 〚2, 3〛. As the transmission capability of the current 1.55-μm window is quickly reaching its saturation point, even with state-of-art dense wavelength division multiplexing (DWDM) techniques, commercial services using wavelengths other than 1.55 μm need to be established. In this respect, 1.31-μm wavelength window offers opportunities, provided that efficient and economical ways of signal amplification can be identified.
Pr3+ can provide 1.31-μm emission from the Pr3+:1G4 → 3H5 transition 〚4〛, and the optimization of this emission has been actively investigated 〚3–6〛. A module made of Pr3+-doped fluoride glass fibers combined with a 1.017-μm laser diode provided approximately a 30-dB gain 〚5〛. Itoh et al. 〚6〛 also reported a gain of 30 dB with a pump-power dependency of 0.81 dB mW–1 from Ga–Na–S glass fibers doped with Pr3+. However, this Pr3+:1G4 → 3H5 transition suffers from large multiphonon relaxation (MPR) that degrades the efficiency of the 1.31-μm fluorescence. To reduce the phonon interaction with the host glasses, Pr3+ ions need to be doped into low phonon-energy glasses such as non-oxide and heavy-metal-oxide glasses 〚7〛.
Dy3+ also emits fluorescence from the 6F11/2·6H9/2 → 6H15/2 transition that is useful for this second communication window 〚8–10〛. A stimulated emission cross-section of this transition (4.35 × 10⁻²⁰ cm2) in the sulfide glass matrix is approximately four times larger than the value of a similar transition in Pr3+ 〚8〛. The branching ratio of the transition exceeds 90%. Furthermore, Dy3+ can be pumped with a commercial InGaAs laser diode, since it has a good absorption band at ∼800 nm. However, the separation between the emission level (6F11/2·6H9/2) and the one immediately below is only 1850 cm–1. As a result, the measured lifetime of the emission level is only about 38 μs with a quantum efficiency of 17% 〚8, 9〛. This is approximately one tenth of the lifetime of the 1G4 level in Pr3+. Despite its potential usefulness, Dy3+ has not been considered as a practical choice for 1.31-μm band amplifiers, due to the poor radiative properties of the 1.3-μm emission.
On the other hand, recent research 〚11, 12〛 reports a significant enhancement on the lifetime and quantum efficiency of 1.31-μm emission from Dy3+. The host materials were Ge–Ga–S glasses containing a tightly-controlled amount of alkali halides, especially CsBr. Lifetimes of the Dy3+:6F11/2·6H9/2 level increased up to 1580 μs with a quantum efficiency approaching 100%. These results opened new possibilities for developing fiber-optic amplifiers for the 1.31-μm window. However, the re-crystallization tendency of Ge–Ga–S and Ge–Ga–S–CsBr glasses during the fiber drawing was strong 〚13〛 and therefore made the fiber fabrication difficult.
This paper provides a review of the 1.31-μm emission properties from Dy3+ doped into sulfide glasses containing alkali halides such as KBr, KI, CsBr, and CsI. First, the effect of the alkali halide concentration on the emission characteristics was investigated. Then, the Ge–Ga–S–CsBr glass compositions were further optimized by adding a small amount of As to provide suitable conditions for a fiber-drawing. The chemical durability of the glass against liquid water was investigated and the results were compared with the fluoride glass. Finally, the origin of improvement in these radiative properties is proposed based on the changes in the local environment of rare-earth ions. Raman, phonon side band (PSB) and fluorescence line narrowing (FLN) spectra were analyzed to elucidate the local structure.
2 Ge–Ga–S glasses with alkali halide addition
2.1 Experimental details
Glasses along the stoichiometric line of GeS2 and Ga2S3 were selected as hosts because of their high rare-earth solubility and good glass-forming ability 〚14〛. Three compositions, Ge0.29Ga0.05S0.66, Ge0.25Ga0.10S0.65 and Ge0.18Ga0.18S0.64, (atomic fraction) were used as starting glasses, hereafter referred to as GGS1, GGS2 and GGS3, respectively. Alkali halides of KBr, KI, CsBr, and CsI were added to form the final compositions of (1 – x) GGS1〚or GGS2, GGS3〛–x MX〚M = K, Cs and X = Br, I〛, where x values were 0.05, 0.10, 0.16 and 0.20 in mole fraction. Dy3+ concentrations in glasses were in the range of 0.01–0.1 in atomic %. Specimens were prepared by melting the starting powders in a rocking furnace 〚15〛 using silica ampoules as crucibles.
The refractive indices of glass specimens were measured at 632.8 nm via a prism method using auto-collimation. Absorption spectra of Dy3+ were obtained using an UV/VIS/NIR spectrophotometer and were used for the Judd–Ofelt analysis 〚16, 17〛. Fluorescence was measured by exciting the glasses at 800-nm pump light from a CW tunable Ti-Sapphire laser pumped by an Ar+ laser. The excitation beam was modulated with a variable frequency chopper controlled by a lock-in amplifier. Emission from the glasses passed through a computer-controlled 1/4m monochromator and was detected by an InSb detector cooled with liquid nitrogen. Fluorescence measurements were carried out at room temperature unless specified. Fluorescence decay curves were recorded using a computerized digital oscilloscope to investigate the fluorescence lifetimes of the specific rare-earth energy levels as well as the decaying behavior of the fluorescence. Measured lifetimes were obtained from the normal mean-duration time (τmean) of the fluorescence decay 〚11〛;
The optical band-gap was calculated by extrapolating the linear part of (α h ν)1/2 curve to the abscissa (h ν) 〚12, 18〛. Here, α, E0, hν, and C are absorption coefficient, optical band-gap of the glass, photon energy and a constant, respectively. Optical band-gaps of glasses were 2.49–2.71 eV and increased with the addition of alkali halides.
2.2 Emission properties
The intensity of the 1.31-μm emission (6F11/2·6H9/2→6H15/2), recorded from Ge0.25Ga0.10S0.65 glass doped with 0.1% Dy3+, was considerably smaller than the 1.75-μm emission (6H11/2→6H15/2). This spectrum is similar to one reported previously 〚14〛. On the other hand, when KBr or CsBr were added, the 1.31-μm emission intensity increased sharply at the expense of the 1.75-μm fluorescence. However, relative intensities of these two emissions remained almost unchanged in glasses containing iodides. Intensities of these two emissions are related to the change in the electron population densities of two emitting energy manifolds (6F11/2·6H9/2 and 6H11/2) following the addition of alkali bromides. The ratio of electron population densities between two excited manifolds (N1.3 μm/N1.75 μm) was calculated from the electron population density values, integrated emission intensity, radiative transition rate and the wavelength of the transition 〚19〛. The ratio for GGS2 glass was 0.02, which increased to 0.8 with the addition of 0.1 mol fraction of CsBr.
It was very difficult to maintain the population inversion for the 1.31-μm fluorescence since the lifetime of the 6F11/2·6H9/2 manifold was only 38 μs, while those of the lower 6H11/2 and 6H13/2 manifolds were approximately 1–3 ms 〚20〛. This was due to the high multiphonon relaxation rate (∼25 000 s–1) of the 6F11/2·6H9/2→6H11/2 transition. As a result, most of the excited ions resided at the 6H11/2 and 6H13/2 manifolds and the emission intensities starting from these two levels (1.75 μm and 2.86 μm) were stronger 〚7, 15〛. In the case of 0.9 GGS2–0.1 CsBr glass, the lifetime of the 6F11/2·6H9/2 level with 0.1 at.% Dy3+ doping was 1320 μs, which is approximately 35 times longer than that measured from GGS2 glass (Table 1). Quantum efficiency (η) of the transition increased from 17% to ∼100 %. Iodide or KBr addition was somewhat less effective as a host glass as shown in Table 1.
Calculated(τR) and measured(τm) lifetimes and quantum efficiencies (η=τm/τR) of 1.31μm fluorescence from 0.1 at.% Dy3+-doped chalcogenide and chalcohalide glasses.
| 0.9 〚Ge0.25Ga0.10S0.65〛– | 0.9 〚Ge0.25Ga0.10S0.65〛– | 0.9 〚Ge0.25Ga0.10S0.65〛– | 0.9 〚Ge0.25Ga0.10S0.65〛– | Ge0.25Ga0.10S0.65 | |
| 0.1 KBr | 0.1 CsBr | 0.1 KI | 0.1 CsI | ||
| τR | 840 | 964 | 326 | 317 | 205 |
| τm | 735 | 1320 | 220 | 193 | 36 |
| η | 0.88 | > 1 | 0.68 | 0.61 | 0.18 |
In principle, measured lifetime (τm) should equal radiative lifetime (τR) within the accuracy of experiments and calculation. τm is usually shorter than τR, since, in most cases, there is a certain degree of ion-ion interaction and multiphonon relaxation (MPR). However, in 0.9 GGS2–0.1 CsBr glass doped with 0.01 at.% of Dy3+, the measured lifetime of the 6F11/2·6H9/2 manifold was 1.58 ms, which was considerably longer than the radiative lifetime of 0.964 ms. These inconsistencies most likely originated from the limitation on the refractive index measurement. The Fuchtbauer–Ladenburg equation and correction factors of the refractive index (χ) in the Judd–Ofelt theory 〚16, 17〛 require refractive indices incorporating the Lorentz field actually experienced by rare-earth ions. In practice, they are usually replaced by measurable macroscopic refractive indices, i.e., the average values throughout the overall host. However, as evidenced from the large changes in the optical properties, the local environment surrounding Dy3+ were changed drastically with the addition of CsBr. Therefore, one needs to use the microscopic refractive index considering the local Lorentz field of rare-earth ions for the precise calculations of excited-state lifetimes. The microscopic refractive index affecting rare-earth ions and its wavelength dependence was calculated for 0.9 GGS2-0.1 CsBr glass 〚12〛 using the Cauchy dispersion formula 〚21〛.
Calculated refractive index at 632.8 nm was 1.804, which was considerably smaller than the experimentally measured macroscopic value of 2.023. Using this dispersion relationship, Judd–Ofelt analysis was carried out again for 0.9GGS2–0.1CsBr glass doped with 0.01 at.% of Dy3+. The calculated lifetime for the glass was 1.49 ms, which was longer than 0.964 ms obtained from the previous calculation (Table 2). Nevertheless, the quantum efficiency of the 1.31 μm emission in 0.9 GGS2–0.1 CsBr glass still remained approximately 100%.
Measured (τm) and calculated(τR) lifetimes of 6F11/2–6H9/2 manifold and Judd–Ofelt intensity parameters in 0.9 〚Ge0.25Ga0.10S0.65〛–0.1 CsBr glasses corrected by the Cauchy dispersion formula of the microscopic refractive index. Dy3+ concentration was 0.01 at.%.
| τR (ms) | τm (ms) | Ω2 (10–20 cm2) | Ω4 (10–20 cm2) | Ω6 (10–20 cm2) | Rms |
| 1.49 | 1.58 | 5.37 | 0.58 | 0.21 | 9.15 × 10⁻⁹ |
2.3 Compositional dependence
Changes in lifetimes and quantum efficiencies strongly depended on the concentration of CsBr in glasses (Fig. 1). This compositional dependence was investigated by systematically adding CsBr into GGS1, GGS2 and GGS3 glasses. Fig. 2 shows emission spectra for three Dy3+-doped glasses with compositions of (1 – x) GGS1–x CsBr glasses, where x = 0.03, 0.04 and 0.05 in mole fraction. Emission spectra from GGS1 glasses containing 3% and 4% CsBr did not show any changes, i.e., a weak 1.31-μm emission and a relatively strong 1.75-μm emission. On the other hand, addition of 5% CsBr glass showed a widely different fluorescence spectrum and became similar to the one in Fig. 1b. In addition, lifetimes showed an abrupt increase when the CsBr reached a certain concentration (Fig. 3). The increases in the 1.3-μm-emission intensity and lifetime of the 6F11/2·6H9/2 level became possible only when the number of CsBr molecules was equal to or larger than that of Ga atoms.
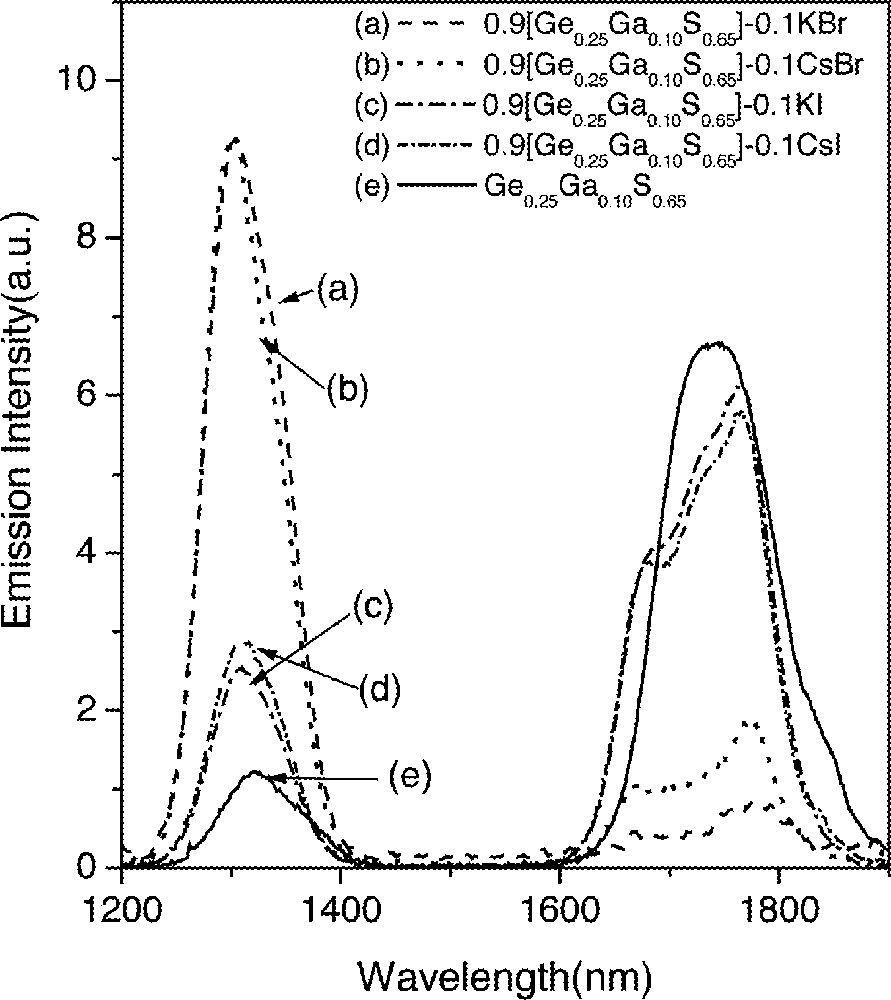
Emission spectra of the 1.31-μm (6F11/2, 6H9/2→6H15/2) and 1.75-μm (6H11/2→6H15/2) transitions in Dy3+-doped glasses.
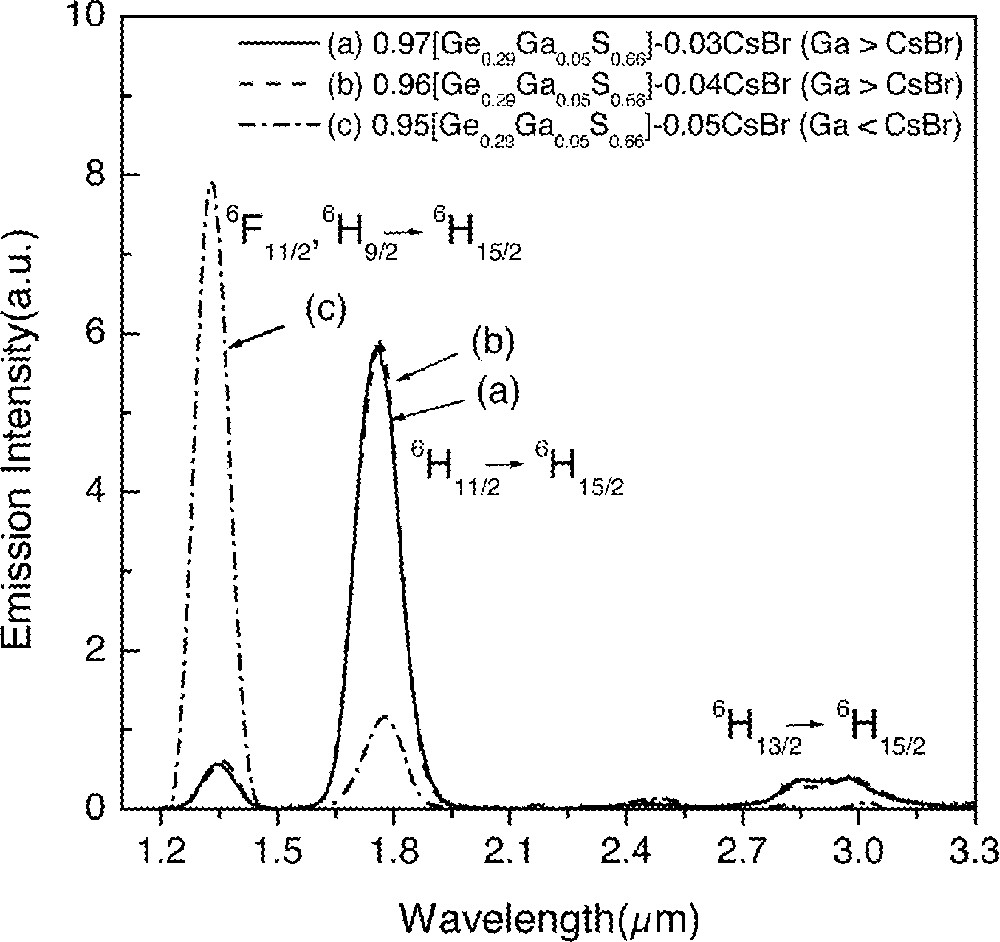
Compositional dependence of emission spectra from Ge–Ga–S–CsBr glasses doped with 0.1 at.% Dy3+.
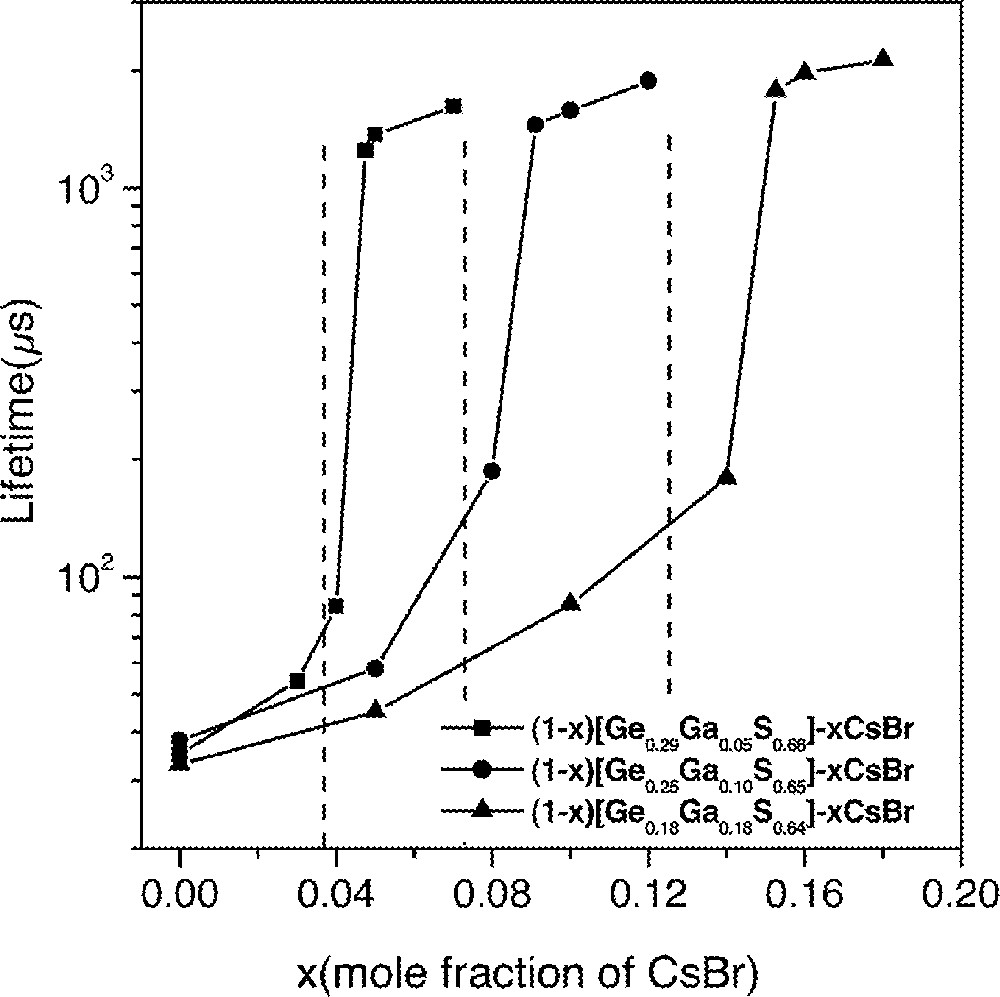
Compositional dependence of lifetime of Dy3+:6F11/2,6H9/2 level. Lines were drawn as a guide.
2.4 Multiphonon relaxation
When ion–ion interaction between rare earths is negligible, lifetimes of the excited-state energy levels are dependent mainly on multiphonon relaxation (MPR). In this case, MPR rates (Wmp) can be calculated from the following relationship 〚22〛:
From several pairs of the energy levels in Nd3+ and Dy3+, it was possible to evaluate the MPR rates for the energy gap (ΔE) of 900–3500 cm–1. The two solid lines in Fig. 4 are for GGS2 and 0.9 GGS2–0.1 CsBr glasses obtained from the least-squares fitting of the calculated Wmp and ΔE using the Wmp = W0 exp(–α ΔE) relationship 〚23〛. Here, W0 is the MPR rate extrapolated to zero energy gap and α is a constant depending only on host materials. It is clear from Fig. 4 that the MPR rate decreased by approximately four orders of magnitude for the Dy3+:6F11/2·6H9/2 level with the addition of CsBr. This difference in the MPR rates between Ge–Ga–S and CsBr-containing glasses can explain, at least partially, the changes in the intensity and lifetime of the 1.31-μm emission.
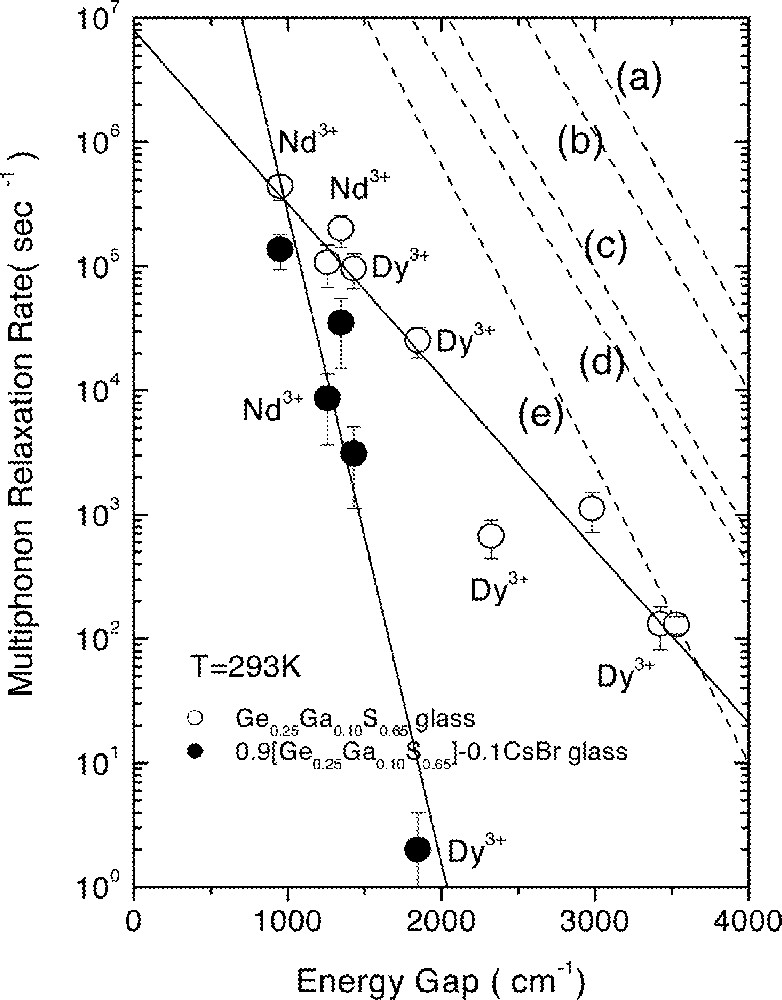
Dependence of multiphonon relaxation rates on energy gap for (a) phosphate, (b) silicate, (c) germanate, (d) tellurite and (e) fluoride glasses 〚22〛. Two solid lines are the result of the fitting for Ge–Ga–S and Ge–Ga–S–CsBr glasses.
3 Addition of As into Ge–Ga–S–CsBr glasses
3.1 Stability against re-crystallization
Even though the addition of CsBr decreased the crystallization tendency of Ge–Ga–S glasses upon re-heating, it is necessary to suppress the crystallization further by adding a small amount of As to realize the high quality optical fibers. Glasses along the GeS2–As2S3 tie-line were selected as starting points since they generally show high resistance against crystallization and provide transparency at a pump wavelength of ∼800 nm. The empirical parameter S as in equation (4) was used to include the crystallization rate effect in the stability criterion 〚24〛:
Characteristic temperatures and stability factors (S) for GAS glasses along the GeS2–As2S3 tie-line and (1 – 2 x) Ge0.25As0.1S0.65–x GaS3/2–x CsBr glasses.
| GAS | Tg (°C) | Tx (°C) | Tp (°C) | S (K) |
| Ge0.05As0.34S0.61 | 221 | 575 | 604 | 20.8 |
| Ge0.1As0.28S0.62 | 240 | 589 | 609 | 13.6 |
| Ge0.15As0.22S0.63 | 267 | 600 | 620 | 12.3 |
| Ge0.2As0.16S0.64 | 296 | 564 | 613 | 23.0 |
| Ge0.25As0.1S0.65 | 346 | 549 | 636 | 28.5 |
| Ge0.3As0.04S0.66 | 420 | 578 | 618 | 9.1 |
| (1 – 2 x) Ge0.25As0.1S0.65–x GaS3/2–x CsBr | ||||
| x = 0.05 | 296 | 502 | 541 | 14.1 |
| x = 0.1 | 295 | 474 | 523 | 15.4 |
| x = 0.15 | 245 | 575 | 600 | 15.9 |
| x = 0.2 | 208 | 590 | 612 | 15.9 |
Ga2S3 and CsBr were added while keeping the CsBr/Ga ratio to unity to maintain condition necessary for enhancement of the lifetime and quantum efficiency of 1.3-μm emission from Dy3+ as explained previously. Glass compositions were (1 – 2 x) 〚Ge0.25As0.10S0.65〛–x GaS3/2–x CsBr where x = 0.05, 0.1, 0.15 and 0.2 in mole fraction. Values of S decreased upon the addition of GaS2/3 and CsBr. However, it was apparent that the first crystallization peak at 500–550 °C in DSC thermograms (Fig. 5) disappeared when the x value increased to 0.15 and 0.2. No crystallization or softening occurred in a glass containing 5 mol% of GaS3/2 and CsBr, respectively when subjected to heat treatment at 500 °C for 5 min. However, upon heating to 520 °C, it crystallized without softening. Glass with 10 mol% of GaS3/2 and CsBr also devitrified at 500 °C with an insufficient amount of softening. On the other hand, when more than 15 mol.% of GaS3/2 and CsBr were added, no devitrification occurred and the glass softened when heated at 500 °C for 5 min. Therefore, glasses with compositions of (1 – 2 x) GAS–x GaS3/2–x CsBr (x = 0.15 or 0.2) appeared to be suitable for fiber fabrication. In fact, the glass with x = 0.15 was successfully drawn into fiber without significant devitrification.
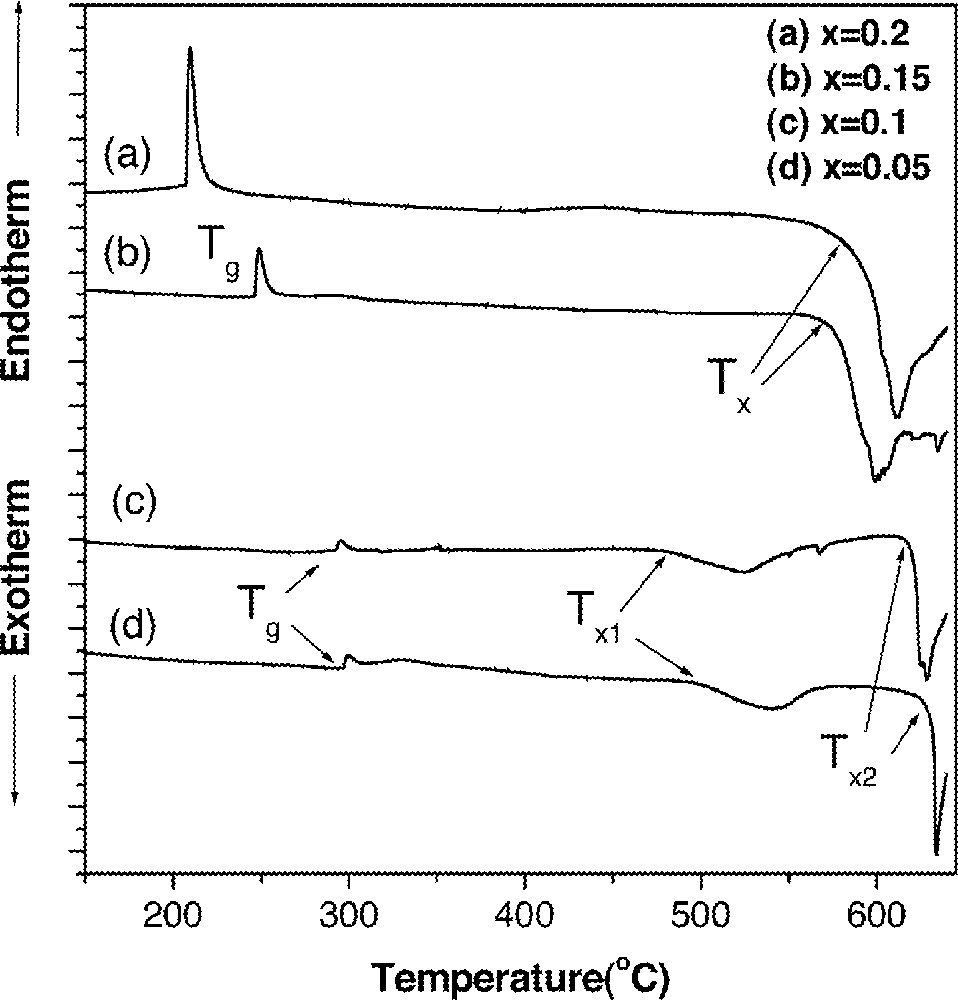
DSC thermograms of (1 – 2 x) Ge0.25As0.1S0.65–x GaS3/2–x CsBr glasses. Values of x are in mole fraction and curves were shifted for clarity.
3.2 Emission properties
As explained, emission properties from Dy3+ are highly sensitive to the chemical composition of host glasses. Therefore, it was necessary to examine the radiative properties of As-containing glasses to ensure the realization of properties obtained from glasses before the addition of As. As shown in Fig. 6, glasses with a CsBr/GaS3/2 ratio equal to or greater than unity again showed a higher 1.31-μm emission intensity compared to that of the 1.75-μm emission. Decay curves also showed a significant change when the quantities of GaS3/2 and CsBr became equal, visualizing the large increase in the lifetime of 1.31-μm fluorescence. The measured lifetime (τm) of the 6F11/2·6H9/2 manifold in GAS glass containing 15% GaS3/2 and 11% CsBr was only 191 μs. On the other hand, glasses with CsBr/GaS3/2 ratios greater than unity showed a measured lifetime of approximately 1850 μs with up to 90% quantum efficiency. Addition of As did not affect the radiative properties of Ge–Ga–S–CsBr glasses provide that the CsBr/GaS3/2 ratio remained ≥ 1.
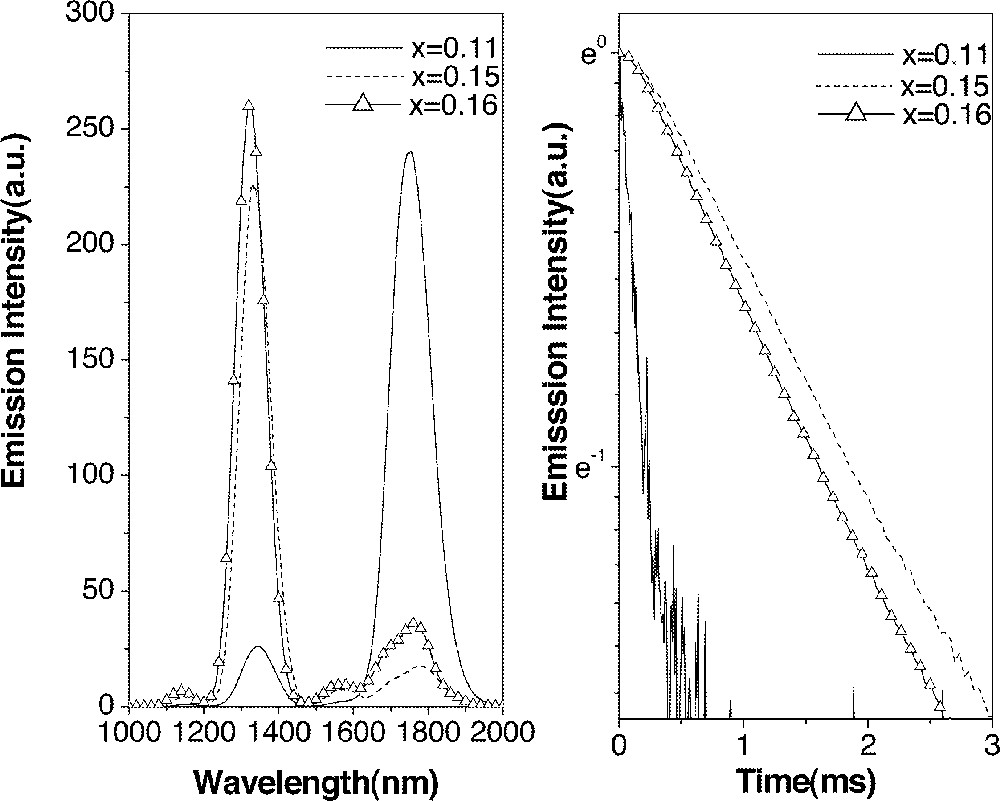
Emission spectra (a) and decay curves (b) of Dy3+:6F11/2·6H9/2→6H15/2 (1.31 μm) transition in (0.85 – x) Ge0.25As0.1S0.65–0.15 GaS3/2–x CsBr glasses.
3.3 Water durability
Since cesium bromides are hygroscopic, hydroxyl impurities are likely to be introduced into glasses if care is not taken during preparation and subsequent treatments. Furthermore, glasses containing large quantities of CsBr generally have poor chemical durability. To evaluate the durability of glasses against liquid water, specimens were polished and immersed in water at 30 °C for different durations up to 95 h. Following this, infrared transmittance spectra were recorded to examine the possible reaction between the glass and water molecules. Fig. 7 showed the IR transmittance spectra of the glass with x = 0.15. There were two spurious peaks at ∼3600 cm–1 and at ∼1600 cm–1, due to the contamination of hydroxyl groups and water molecules in an as-prepared glass, respectively. These peaks remained largely unaffected even after 90 min of immersion in liquid water. In the case of fluoride glasses, which are being used for many practical applications, these two peaks grew very fast even after only 30 min in water 〚25〛. Therefore, the reaction between these chalcohalide glasses and water is much less serious than that of fluoride glasses and can be minimized if an appropriate coating is applied in situ during the fiber drawing. However, there were considerable reactions after 95 hours of immersion.
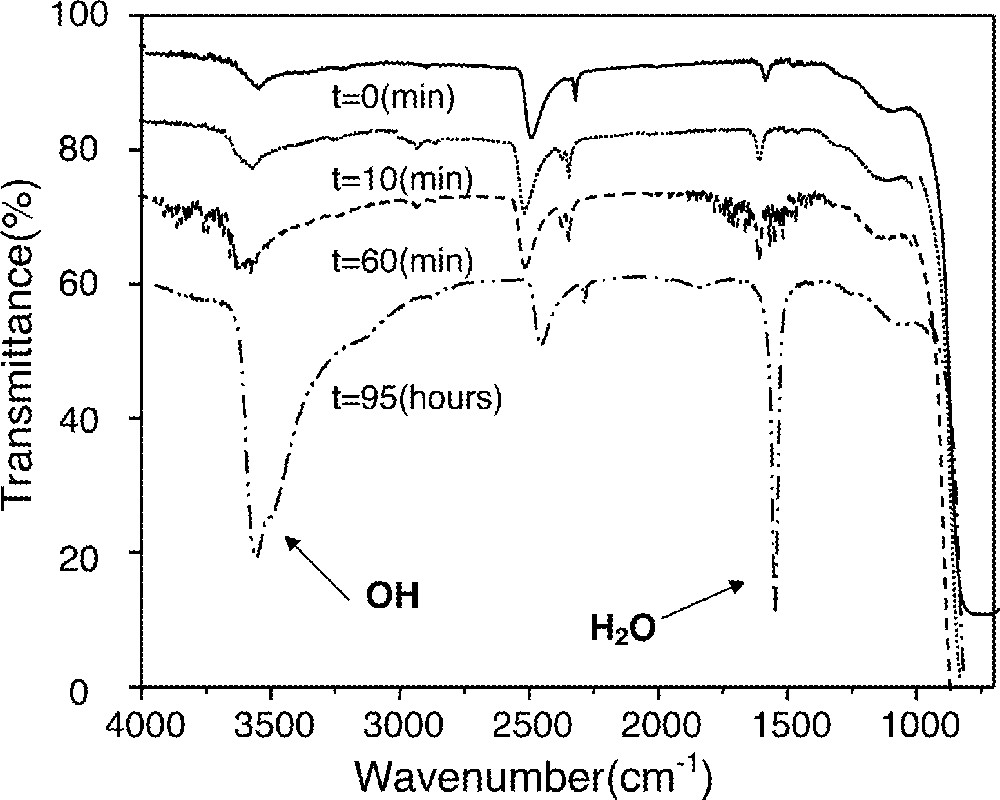
IR transmittance spectra of 0.7 Ge0.25As0.1S0.65–0.15 GaS3/2–0.15 CsBr glass after being immersed in water at 30 °C for various time durations. Baseline of the spectra were shifted for clarity.
4 Local environment of rare-earth ions
It is interesting to see that the addition of CsBr can result in such a large change in the emission properties. It is possible to speculate that the local environment surrounding rare-earth ions experienced considerable modification with alkali halide addition. This chapter deals with the proposed model of local environment of rare-earth ions in glasses using Raman, phonon side band, and fluorescence line narrowing spectroscopic methods.
4.1 Temperature dependence of multiphonon relaxation
Changes in the local phonon mode were identified quantitatively by analyzing the effect of temperature on the relaxation of the excited state of Dy3+. MPR rates remained almost constant up to temperature of approximately 150 K, but increased rapidly at high temperature due to the stimulated emission of thermally activated phonons 〚11〛. For relaxation in Ge–Ga–S glass, the following equation fitted the measured values most precisely if one assumes that a five-phonon process with 375 cm–1 vibration frequency dominated the multiphonon relaxation (Fig. 8).
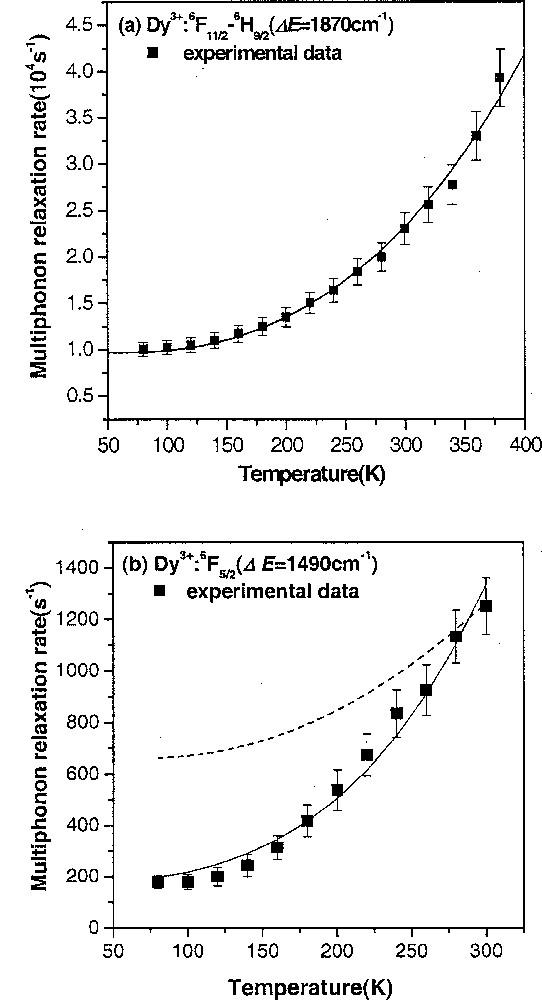
Temperature dependence of multiphonon relaxation rates in Dy3+ from the 6F11/2–6H9/2 level in GGS (a) and the 6F5/2 level (b) in GGS CsBr glasses.
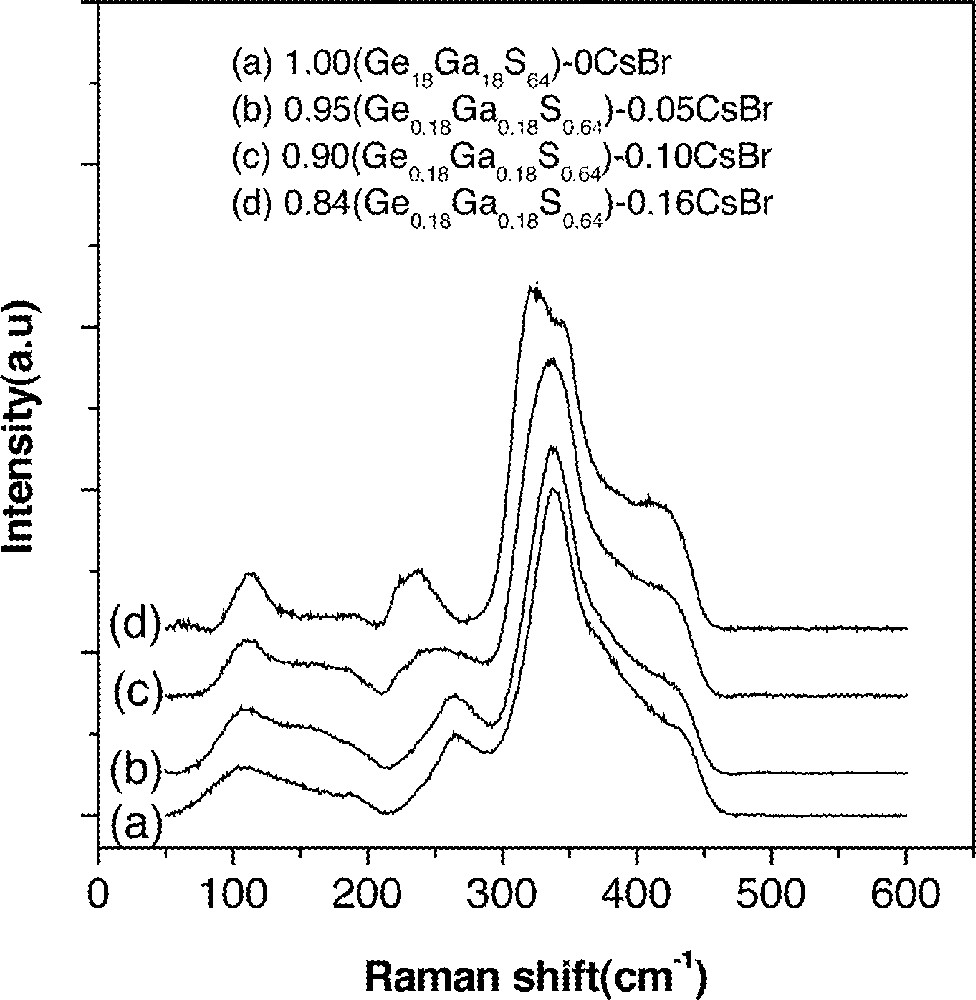
Raman spectra of (1 – x) (Ge0.18Ga0.18S0.64)–x CsBr glasses. Baselines of the spectra were shifted for a clear presentation.
4.2 Raman spectroscopy
Raman spectra of bulk glasses were recorded with a Raman spectrometer equipped with an one-meter triple monochromator and an Ar+ laser. The signals were recorded by a liquid nitrogen-cooled CCD detector array. The power of the laser was 300 mW and the resolution was 4 cm–1 for the excitation wavelength (514.5 nm). Data acquisition duration was 30 s.
It has been proposed that high rare-earth solubility of Ge–Ga–S glasses originated from the presence of Ge–Ge bonds and the edge-shared GaS4/2 tetrahedra in glasses 〚26〛. Addition of rare-earth sulfides can break Ge–Ge bonds to form non-bridging sulfurs or change the edge-shared GaS4/2 tetrahedra to the corner-shared ones. Rare-earth ions can find a place to fit near these broken bonds by performing a charge-compensating role of non-bridging sulfurs.
Spectra in Fig. 9 showed that new Raman band was found at ∼245 cm–1 upon the addition of CsBr. This band was due to the vibration of the Ga–Br bonds. The band at 265 cm–1 was due to Ge–Ge bonds and it disappeared completely only when the CsBr/Ga ratio became larger than unity (Fig. 9). It indicated that, when the CsBr/Ga ratio was less than unity, the glass network still has Ge–Ge bonds and edge-shared GaS4/2 tetrahedra. In this case, rare-earth ions were dissolved in a similar manner to the case of Ge–Ga–S glasses and resided next to GaS4/2 or GeS4/2 tetrahedra. As a result, the enhancement in the lifetime of the 1.31-μm fluorescence was not possible. On the other hand, when the CsBr/Ga ratio became equal to or larger than unity, most of these edge-shared GaS4/2 tetrahedra were transformed to 〚GaS3/2Br〛– units. This was similar to the formation of 〚GaS3/2Cl〛– units in GeS2–Ga2S3 glasses containing alkali chloride 〚27, 28〛. If the rare-earth ions were located near these complexes, they will experience the reduced electron–phonon coupling strength 〚11〛. As a result, an observed enhancement in the lifetime and quantum efficiency of the 1.3-μm emission became possible.
4.3 Phonon side band (PSB) spectroscopy
PSB modes represent the Stokes or anti-Stokes fluorescence induced by the phonon modes that are effectively coupled to the fluorescing energy level of rare earth ion 〚29〛. It has been impossible to apply PSB spectroscopy to chalcogenide glasses since fluorescence from Eu3+ has not been observed. However, efficient persistent spectral hole burning and characteristic fluorescence from the Eu3+:5D0 level were observed recently from Ga–Ga–S–KBr glass 〚30〛. Investigation of the local structure around rare-earth ions 〚31, 32〛 in these chalcohalide glasses became possible by taking advantage of Eu3+ formation.
A PSB spectrum of Eu3+-doped 0.85 (Ge0.18Ga0.18S0.64) + 0.15 CsCl glass (all in atomic or mole fraction) was recorded by measuring the fluorescence of 5D0 → 7F2 (∼615 nm) at 10 K while continuously changing the energy of pumping light in the vicinity of the Eu3+:5D0 level. Five distinct phonon modes located at ∼120, 149, 199, 226, and 259 cm–1 were identified as shown in Fig. 10. These phonon side bands of Ge–Ga–S–CsCl glass were compared with vibrational modes of the possible structural units in glass (Table 4). Most phonon side bands fit with the vibration mode of Ga2Cl6 dimer and CsGaS1.5Cl. In addition, most of the vibration modes from EuCl3 compound also matched the measured phonon side bands. Based on these analyses, it can be proposed that Eu3+ ions have Cl– ions as their nearest neighbors and these Cl– ions either form 6–8 coordinated EuCl3 〚33〛 or bond to the tetrahedral 〚GaS3/2Cl〛– subunit and/or Ga2Cl6. In any case, Eu3+ is surrounded by Cl– ions and these new Eu–Cl bonds played the most important role on the enhancement of the 1.3-μm emission properties of Dy3+.
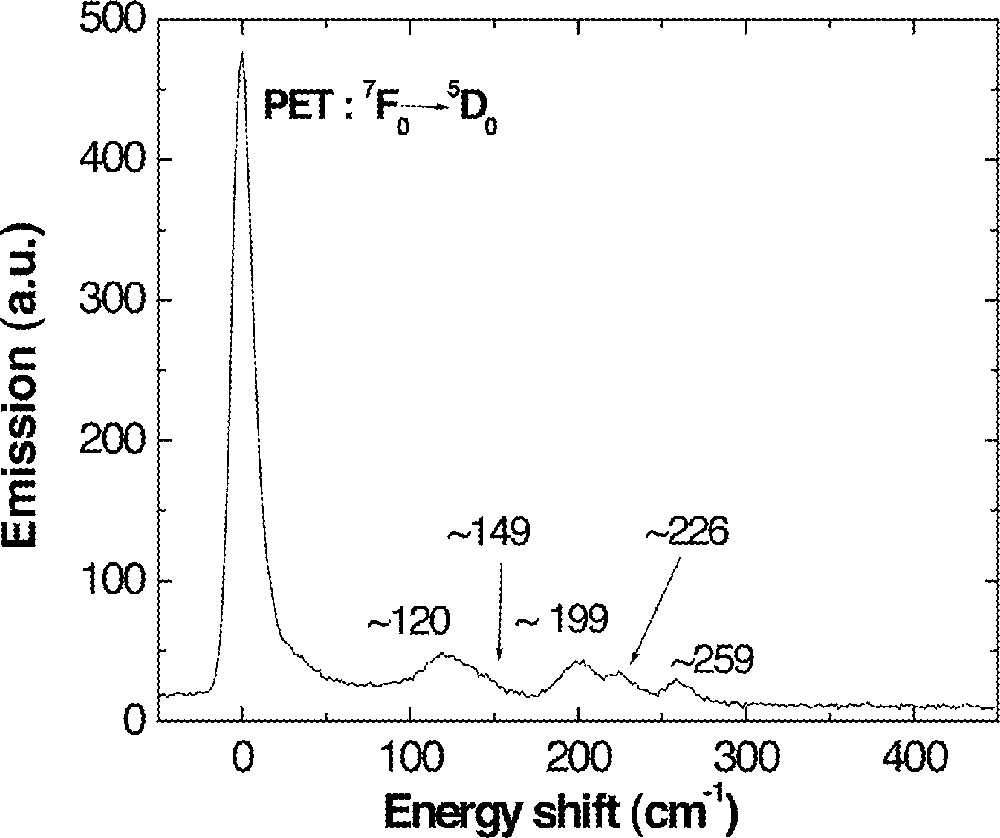
A phonon side-band spectrum of 0.1 mol% Eu-doped 0.85 (Ge0.18Ga0.18S0.64) + 0.15 CsCl glass recorded by monitoring fluorescence change of 5D0→7F2 transition (∼615 nm) at 10 K. PET represents the pure electronic transition.
Vibrational phonon modes of possible subunits in Eu-doped Ge–Ga–S–CsCl glass (in cm–1). Numbers in the bracket at the last line indicate the references.
| PSB | 〚GaCl4〛– | CsGaS1.5Cl | Ga2Cl6 | Ga2Cl6 | 〚Ga2Cl6〛2– | EuCl3 |
| 86 | 96 | 66–89 | ||||
| 106 | 107 | 100 | 106 | 96 | ||
| 117 | 116 | |||||
| 120 | 120 | 131 | 123 | 125 | 120 | |
| 141 | ||||||
| 149 | 153 | 165 | 167 | 156 | 151 | |
| 167 | ||||||
| 185 | ||||||
| 199 | 196 | |||||
| 215 | ||||||
| 226 | 228 | 233 | 227 | |||
| 243 | ||||||
| 259 | 253 | 268 | ||||
| 274 | 282 | 302 | ||||
| This work | 〚34〛 | 〚27〛 | 〚35〛 | 〚34〛 | 〚36〛 | 〚37〛 |
A PSB spectrum of 0.1 mol% Eu-doped 0.85 (Ge0.18Ga0.18S0.64) + 0.15 CsBr doped with 0.1 mol% Eu was also measured as shown in Fig. 11. Three distinct phonon side bands of ∼83, 125, 164 cm–1 with a weak band of ∼250 cm–1 were observed. Again, these phonon side bands were compared with possible structural units in the glass as shown in Table 5. They showed a good agreement with the vibration modes of Ga2Br6 dimer structure similar to the case of CsCl-containing glasses. Again, it implies that Br– ions are located in the vicinity of Eu3+ possibly in the form of Ga2Br6 or 〚GaS3/2Br〛– units. Therefore, local structure of Eu3+ is composed of 6–8 Br– ions and these Br– ions form 〚GaS3/2Br〛– or 〚GaBr3/2〛 in Ge–Ga–S–CsBr glass.
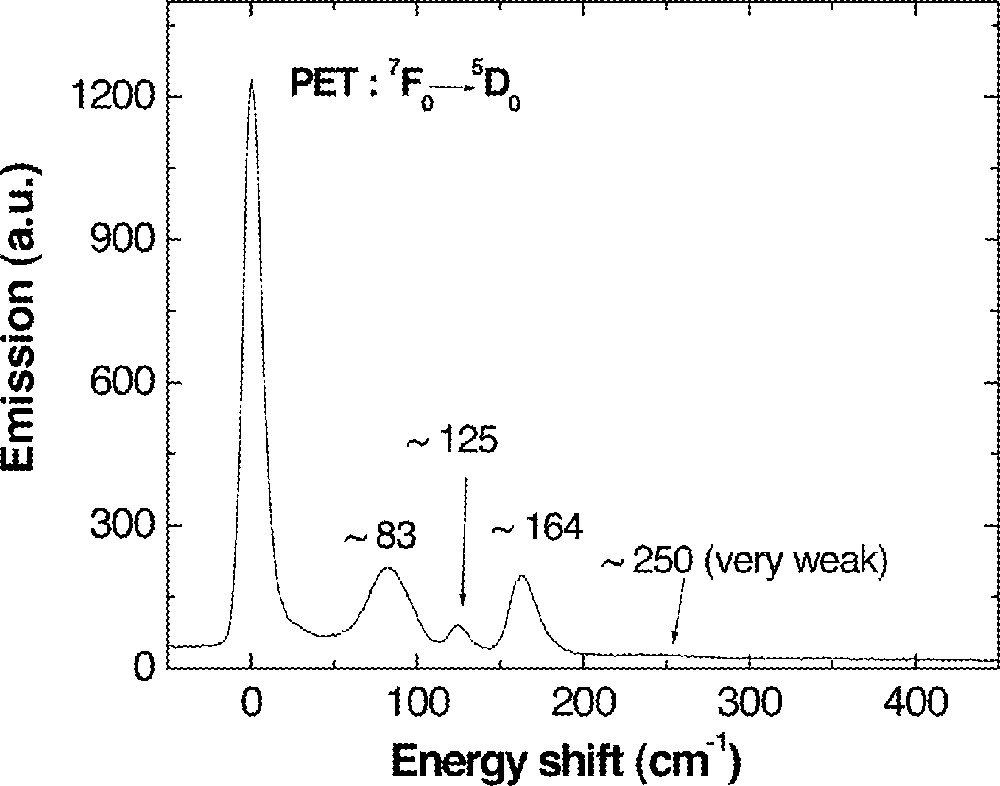
A phonon side-band spectrum of 0.1 mol% Eu-doped 0.85 (Ge0.18Ga0.18S0.64) + 0.15 CsBr glass recorded under the same condition as the spectrum in Fig. 10.
Vibrational phonon modes of possible subunits in Eu-doped Ge–Ga–S–CsBr glass (in cm–1). Numbers between brackets at the last line indicate the references.
| PSB | 〚GaBr4〛– | Ga2Br6 | Ga2Br6 | 〚Ga2Br6〛2– | LaBr3 |
| 71 | 68 | 74 | 70 | 68.2 | |
| 83 | 83 | 82 | 84 | 80.8 | |
| 93 | 90 | 92 | 92.1 | ||
| 97.1 | |||||
| 102 | 102 | 102 | 115.1 | ||
| 110 | 110.5 | ||||
| 125 | 118 | 119 | 126.1 | ||
| 126.9 | |||||
| 131.1 | |||||
| 139.5 | |||||
| 142 | 148.8 | ||||
| 164 | 176 | 158 | 164 | 166.9 | |
| 185 | 188 | ||||
| 201 | 204 | 201 | |||
| 210 | 221, 227 | 228 | |||
| 232 | 236 | ||||
| 250 | 264 | 241 | |||
| 269 | |||||
| This work | 〚34〛 | 〚35〛 | 〚34〛 | 〚36〛 | 〚38〛 |
4.4 Fluorescence line narrowing spectroscopy
If the proposed structural model is reasonable, Eu3+ ions should be located next to the well-coordinated structures. Then, the site-to-site variation must be low, since such a structure allows low flexibility on the location of Eu3+ ion within the complex. This is supported from the fluorescence line narrowed spectra of the 0.85 (Ge0.18Ga0.18S0.64) + 0.15 CsBr glass measured at 10 K (Fig. 12). The fluorescence spectra from 5D0→7F1 and 5D0→7F2 transitions did not show any broadening when the energy of the excitation light increased. This verifies that most Eu3+ ions in Ge–Ga–S–CsBr glass experienced similar crystal field parameters 〚39〛. Moreover, 5D0→7F1,2 transition is generally well-resolved into (2 J + 1) fluorescence peaks in most glasses when the local site symmetry of Eu3+ is lower than C2v 〚29, 40, 41〛. Fluorescence from both 5D0→7F1 and 5D0→7F2 transitions in Fig. 12 showed narrow linewidths and the (2 J + 1) splitting was not clearly identified. Therefore, the local symmetry surrounding Eu3+ ions in Ge–Ga–S–CsBr glass must be higher than that of conventional glasses.
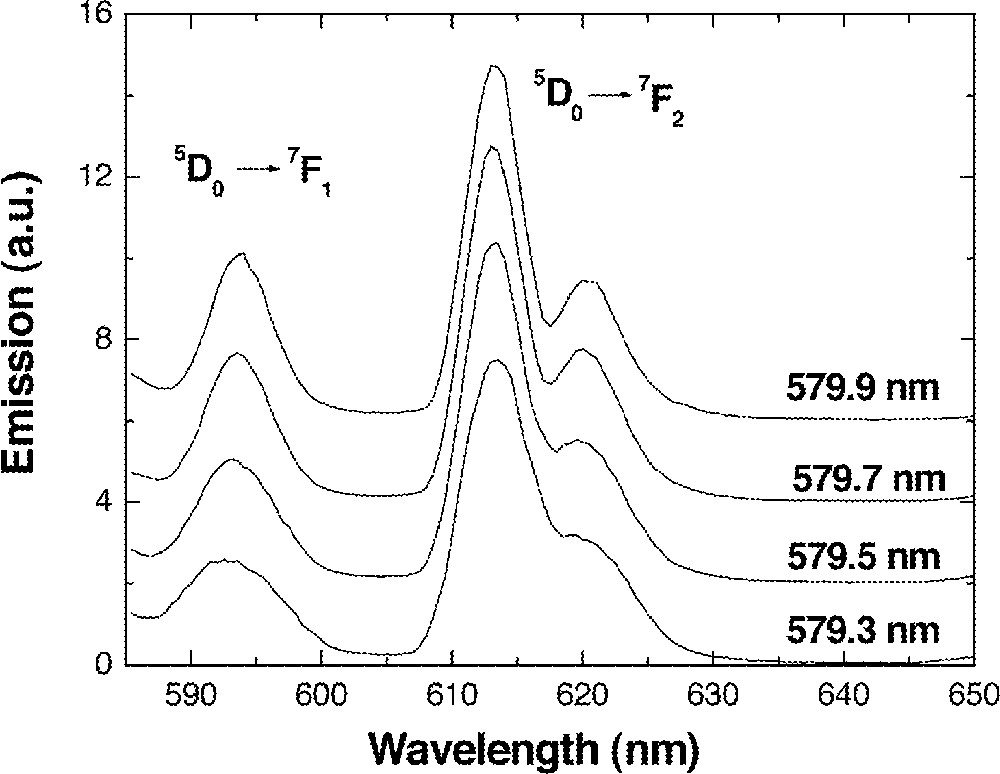
Fluorescence spectra of 0.1 mol% Eu-doped 0.85 (Ge0.18Ga0.18S0.64) + 0.15 CsBr glass at different excitation wavelengths. Fluorescence was measured at 10 K.
5 Conclusions
Intensity, lifetime, and other radiative properties of the 1.31-μm emission from Dy3+ experienced a great improvement upon the addition of alkali halides to Ge–Ga–S glasses. The lifetime of the 1.31-μm emission level (Dy3+:6F11/2–6H9/2) increased as much as 35 times with 10 mol% addition of CsBr. Quantum efficiency also approached 100%. The effect of alkali halides was maximized when the ratio of MX(M = K,Cs; X = Br,I)/Ga was equal to or larger than unity. A small amount of As was added into the Ge–Ga–S–CsBr glass to enhance stability against crystallization during fiber drawing. The optimum composition was 0.7 〚Ge0.25As0.1S0.65〛–0.15 GaS3/2–0.15 CsBr.
Phonon side band (PSB) spectra in Ge–Ga–S–CsBr (or CsCl) revealed that there are several low frequency (∼100 cm–1) phonon modes coupled to rare-earth ions. For instance, in Ge–Ga–S–CsCl glasses, local environment of Eu3+ ions is mainly made of Cl– ions. These Cl– ions form EuCl3, tetrahedral 〚GaS3/2Cl〛– subunit and/or Ga2Cl6. In all cases, the nearest neighbors of Eu3+ ions are Cl– ions and these Cl– ions exerted less coupling compared to those bonds in glasses without CsCl. A fluorescence line narrowing experiment indicated the narrow site-to-site variation of Eu3+ ions and further supported the formation of well-coordinated subunits in the vicinity of Eu3+ ions. Glasses in the Ge–As–Ga–S–CsBr system hold potential as host materials for wideband fiber-optic amplifiers.