

1 Introduction
Electrochemical techniques have long been used to investigate the kinetics of various types of reactions [1]. In this case, the time scale of the experiment is determined by the time duration required for a molecule to move from (resp., to) the electrode surface to (resp., from) the outer edge of the diffusion layer. The nature of the observed response depends on the relative magnitude of this time scale, θ, as compared to the half-life, τ1/2, of the chemical reaction that proceeds while the molecule of interest moves to or from the electrode surface. In the limiting case θ << τ1/2, the system behaves as if entirely under pure diffusion control, viz, all chemical kinetics are ‘frozen’ and one observes only voltammetric features characterizing transport to and from the electrode. Conversely, when θ >> τ1/2, the voltammetry is under pure kinetic control by the chemical kinetics. When θ is comparable to τ1/2, the response is a recognizable convolution of the two above limiting cases [1,2]. The fact that each one of these regimes has very characteristic qualitative and quantitative manifestations in cyclic voltammetry [1,2] explains easily why the method has been receiving increasing attention in several areas of chemistry, biochemistry and biology, and not only in electrochemistry.
An extremely important experimental advantage is that θ may be easily and precisely adjusted over a wide time range below the second by simply modifying the scan rate, υ, of the voltammogram. Indeed, increasing the scan rate, υ, in cyclic voltammetry allows one to decrease the thickness, δ, of the diffusion layer, viz, to adjust at will the time θ ≈ (RT/Fυ), required for molecules to travel over this distance:
| 1 |
However, exploration of the sub-millisecond time scale causes damageable interferences of the voltammetric perturbation by several factors that then affect and distort significantly the voltammetric data. Access to the sub-millisecond range requires therefore the consideration of these limiting phenomena and solutions must be found to avoid their interference, so that undistorted voltammetric information may be obtained [2,5]. A first obvious limit is that, as in any electrical problem, the electrochemical perturbation, E(t), cannot be applied to an electrode faster than the cell time constant. A second one is that a fraction of the instant energy delivered to the cell, i(t) E(t), is lost through ohmic heating dissipation, which necessarily occurs while the current i(t) is transported through the investigated solution. Both problems are minimized when performing electrochemistry at disk ultramicroelectrodes, which explains why the introduction of these electrodes of micrometric dimensions has opened several new frontiers to electrochemistry [5].
2 Experimental
Experimental details concerning the homemade ultrafast potentiostat and description of the ohmic drop compensation procedure have been described elsewhere [4].
2.1 Preparation of self assembled monolayers of [Os(bpy)2(py–B)Cl]+
The three-electrode electrochemical cell (0.3 ml) used in this study was identical to that previously reported [4]. The working electrode (2.5-μm radius) was homemade by the cross section of a platinum wire (Goodfellow) encased in a glass tube and sealed with epoxy. It was polished first with fine emery paper and then with a polishing cloth on which 0.3 μm alumina slurry (PRESI) was added. It was then washed with ultrapure water. The complex was synthesized according to a published procedure [6]. A microliter sample of the complex dissolved in acetone (ca 1 mM) was then added to a 10-ml solution of 0.5 M NaNO3 in ultrapure water so as to obtain a concentration of ca 10 μM [6]. 0.25 ml of this stock solution was then added to the electrochemical cell. Full coverage of the surface was then effective within 5 min [7]. Voltammetric scans were then recorded under full ohmic-drop compensation.
All experimental details concerning the voltammetric study of the 64-Ru/PAMAM dendrimer (section 4.2) have been reported elsewhere [7,8].
3 Principle and validity of nanosecond-time-scale voltammetry
3.1 Intrinsic difficulties borne by voltammetry at ultrafast scan rates
To allow significant electrochemical kinetic informations to be derived, the electrochemical perturbation E(t) must be applied to the time-dependent Faradaic impedance, ZF(t), which represents the electrochemical-chemical sequence investigated [1]. This must be performed with an extreme precision both in the potential and time spaces. The current of Faradaic origin, iF(t), which ensues must be determined with similar adequate precision since it contains all the information about ZF, viz, about the rate of the physicochemical and chemical processes that are occurring. Reaching scan rates in the megavolt-per-second range requires this to be performed with a frequency of a few tenths of GHz [4,9]. Today, such frequencies are available in most electronic equipments, even those aimed to the grand public. However, the specificities of electrochemical cells that stem basically from the fact that usual chemical solutions are not at all electronic conductors and are poor ionic conductors [1] make them a real challenge in electrochemistry.
The overall equivalent electrical circuit of an electrochemical cell is represented in Fig. 1a for a three-electrode configuration. Formally, such a circuit depends on three Faradaic impedances, ZJ, three capacitances, CJ, and three resistances, RJ. Indeed, each electrode is characterized by the electrochemical reactions which occur at its vicinity (reflected by its Faradaic impedance ZJ), its double layer capacitance which is imposed by the specific interface created between this electrode and the solution (CJ), and the resistance of the current tube that connects this electrode to the two other ones through the solution (RJ). However, among all these elements, only one, ZF(t), is of interest since it characterizes the electrochemical and chemical phenomena investigated and which are occurring at the working electrode (noted WE in Figs. 1 and 2) surface and within its near vicinity.
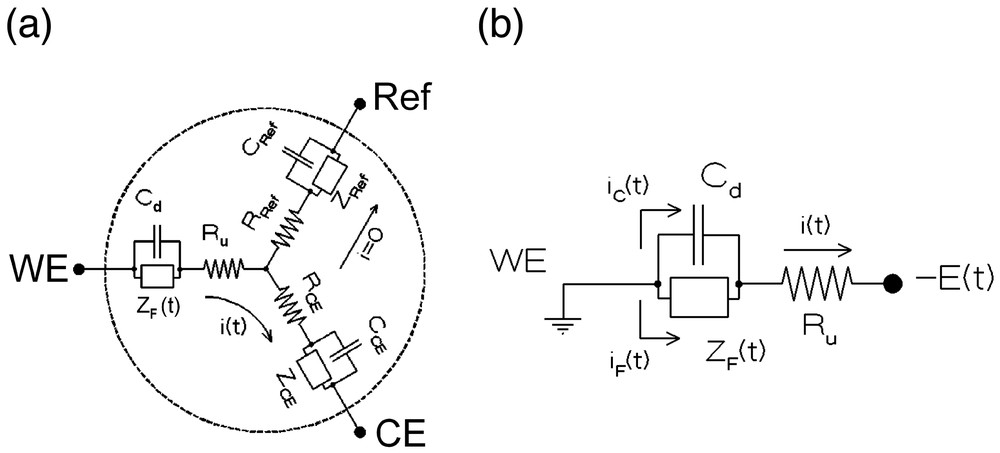
Equivalent circuit of a three-electrode electrochemical cell (see text). (a) Complete cell (WE: working electrode, Ref: reference electrode, CE: counter-electrode). (b) Apparent electrical circuit of the same cell when restricted to the working electrode thanks to the use of a potentiostat: ZF(t): time-dependent Faradaic impedance, Cd: working electrode capacitance, Ru: uncompensated resistance, iF(t): Faradaic current, iC(t): capacitive current, i(t) = iF(t) + iC(t): total current.

(a) Electronic diagram of a potentiostat for voltammetric experiments with on-line ohmic drop and time constant electronic compensations up to 2 500 000 V s–1 (adapted from [3,4]). (b) Experimental current traces obtained at 2 MV s–1 when the potentiostat shown in (a) is connected to a RC dummy cell (R = 10 kΩ, C = 3 pF), for 100% compensation and increasing damping factors (increasing damping corresponds to decreasing magnitude of the oscillations; see text). Adapted from [4].
Using a potentiostat and an adequate reference electrode (noted Ref in Figs. 1a and 2) allows one to virtually eliminate the phenomena occurring at the two other electrodes, so that the working electrode circuit element may be controlled alone [1,10] (Fig. 1b). However, this is not sufficient since one should really be able to apply the electrochemical perturbation to the Faradaic impedance only (viz, at the boundaries of ZF in Fig. 1b) and measure simultaneously the Faradaic current iF(t) that flows through ZF only. In practice, this is not feasible, since it is apparent from Fig. 1b that the imposed potential variation, E(t), may not be applied to ZF only, but necessarily encompasses the ohmic resistance Ru, and that the current which is measured includes necessarily a capacitive component, viz, i = iF + iC:
| 2 |
| 3 |
This shows that because of the presence of the ohmic resistance, Ru, the capacitive and Faradaic currents interfere. The degree of this detrimental interference is evidently reduced whenever the amplitude of the term Ru i(t) and of its first time derivative are made negligible vs E(t) and υ respectively. In this respect, introduction of ultramicroelectrodes has provided a net gain of several orders of magnitudes in scan rate through the ‘natural’ reduction of this term. Indeed, for a disk-shaped working electrode of considerably smaller dimensions than those of the other electrodes and of the cell, Ru is the ohmic resistance of the infinite half-space of solution which is limited by the working electrode surface (cf. Fig. 3a). This is then given by:
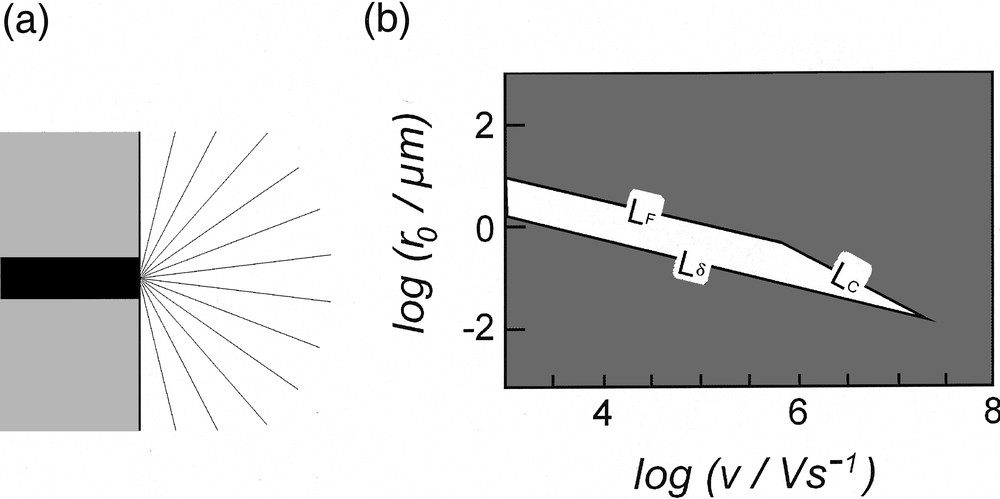
(a) Schematic representation of the cross-section of the convergent current flux lines (gray lines) at a disk electrode (black area) embedded in an insulating plane (gray area). (b) Zone diagram indicating the domain (white area) in which the point featuring the system must lie to minimize any distortion in cyclic voltammetry (see text for the definition of LF, LC and Lδ). Adapted from [5,13,14].
| 4 |
| 5 |
Combination of equations (4) and (5) shows easily that Rui(t) ∝ ρ r0, so that reduction of the working electrode size by any given factor provokes de facto a reduction of the ohmic dissipation by the same factor. However, one cannot only resort to this geometrical trick to get rid of the ohmic term and of its associated cell time constant. Indeed, a disk electrode cannot develop a planar diffusion layer that is larger than its radius because of the involvement of spherical convergent diffusion [11,12]. This is generally not a significant limitation at usual electrodes but may become a severe one when the electrode radius is considerably decreased. In voltammetry, when δ (as given in equation (1)) is commensurable or larger than r0, the voltammogram progressively looses its transient characteristics and becomes a steady-state one [5]. Then the diffusion rate is no more imposed by the scan rate but only by the electrode radius [11,12]. This imposes a natural constraint on the lowest dimension of an electrode that may be used at a given scan rate whenever a fully transient voltammogram is required. This limitation imposes de facto that the point featuring the system investigated, as defined by the electrode radius r0 and the scan rate υ, must be located above the line labeled (Lδ) in the zone diagram shown in Fig. 3b [5,13,14].
To pursue, we need to precise further the relationship in equation (5), since the scan rate dependences are different for the Faradaic (iF) and capacitive (iC) currents. In voltammetry, equation (3) shows that at a given scan rate, the capacitive current reaches the limit iCmax = Cd υ after a few times RuCd, which is then termed the cell time constant. Since Cd is proportional to the electrode surface area, the maximum capacitive current is then proportional to the scan rate [1]:
| 6 |
| 7 |
Based on this analysis [13,14], it is deduced that the system must be located within the polygon delimited by the set of three lines (Lδ, LF, LC) in order that distortions remain negligible whatever their origin. In Fig. 3b, these limits are shown for a maximal ohmic drop of 10 mV (LF, LC) and a 5% maximum involvement of spherical diffusion (Lδ). An immediate characteristic of the domain shown in Fig. 3bis that it spontaneously vanishes at very large scan rates. In other words, above a given scan rate it is impossible to define experimental conditions in which all three distortions are negligible. At scan rates below this threshold, a specific electrode radius needs to be used for a particular scan rate. Thus, at a scan rate of 104 V s–1, the electrode radius must fall between 0.50 and 3.50 μm, whereas it should be between 0.06 and 0.35 μm for υ = 106 V s–1.
Practically, the zone diagram shown in Fig. 3bis to be considered as the optimistic theoretical situation. Indeed, the limit, Lδ, due to the capacitive current is even more drastic since very small electrodes (viz, of a few micrometers and below) present important stray capacitances, so that the overall capacitance of the system is no more equal to that of the electrode interface (viz, proportional to their surface area, equation (6)), but tends to vary as their radius, and even become constant for extremely small electrodes. Consequently, when scan rates reach the range of several thousands volts per second, resorting to ultramicroelectrodes only is not sufficient to produce undistorted voltammograms, even if this allows to severely reduce the problems borne by ohmic drop and by time constants in electrochemical experiments [5].
Another unexpected effect of ohmic drop that we have not yet addressed is related to an intrinsic artifact that is often unfortunately neglected when cyclic voltammetry is used for kinetic purposes. Indeed, in a classical experiment, a transient species is generated during the forward voltammetric scan, and is analyzed during the backward scan. The kinetic measurement is then related to that of the fraction of electrogenerated species that has ‘survived’ the time span θΔE required to scan over the potential difference, ΔE = |Egen – Ecoll|, separating the potential, Egen, at which it has been generated, and that, Ecoll, at which its residual concentration is collected. At first glance, θΔE seems to be reciprocally proportional to υ, a fact that is usually advocated in many textbooks and published works. However, when ohmic drop is not negligible, Egen and Ecoll shift in opposite directions, so that ΔE ≈ (ΔE)0 + 2 Ru |igen|, where igen is the current intensity at Egen, inclusive of the capacitive components, and (ΔE)0 the value of ΔE that would be observed in the absence of any ohmic drop. Since we have seen above (Fig. 3b) that at extremely large scan rates capacitive currents dominate, one sees from equation (6) that at large scan rates:
| 8 |
3.2 Principle and experimental validity of electronic on-line ohmic drop compensation in megavolt-per-second voltammetry
Evidently, one way to deal with the above systematic distortions is to incorporate them into the basic equations of the system at hand, so that a series of distorted voltammograms may be simulated and compared to the experimental ones [15,16]. It is however obvious that this approach amounts to “dilute” the kinetic information among several other factors that are irrelevant but becomes the major ones upon increasing the scan rate. Indeed, as evidenced above, the chemically interesting part of the voltammogram becomes a lesser and lesser component of the experimental voltammetric data when υ increases, so that the precision and accuracy on the Faradaic component drop rather fast. This is particularly obvious when one thinks about the principle of conductimetric measurements. Indeed, the above set of equations shows immediately that the limit of equation (2) at extremely high frequencies is simply the Ohm law:
| 9 |
Therefore, the whole system behaves simply as a diode whose switching potential, Eswitch, is fixed by the redox couple of interest. In other words, the limit of voltammetry at high scan rates is conductimetry... This explains why the above strategy (viz, through allowing for the distortions to occur in experimental voltammograms and accounting for their effects in theoretical predictions) is very quickly limited upon increasing the scan rate and is generally restricted to the situations in which ohmic drop, time constants and spherical diffusion contributions amount only to a few percent of the experimental signal. For usual experimental electrochemical conditions, even upon using ultramicroelectrodes of micrometric dimensions, the limit of this a-posteriori approach is located around a few ten thousand volts-per-second. As pointed out by Fawcett in a review, up to the mid-nineties, these drawbacks restricted the use of straight cyclic voltammetry to microsecond time scales [17]. Other methods such as a.c. admittance voltammetry could be used then to probe nanosecond electrochemical kinetics since the solution resistance could be extracted a posteriori [18,19]. However, by doing so, the great advantages of cyclic voltammetry in elucidating unknown mechanisms were lost.
Therefore, we have been interested in developing another strategy to solve the problem borne by equations (2) and (3). This strategy is based on on-line electronic compensation of ohmic drop by positive feedback, which has been developed previously for electrodes of standard sizes and for much lesser scan rates [20]. Indeed, since Ru may be measured independently, provided that i(t) may be known sufficiently fast, one is able to impose at each instant a potential E(t) + ϵ × Ru i(t) between the working and reference electrodes instead of E(t) as is usually done and as it has been considered above. Provided that ϵ may be made adequately close enough to unity, an undistorted voltammogram should be obtained. Indeed, equation (2) becomes then:
| 10 |
| 11 |
| 12 |
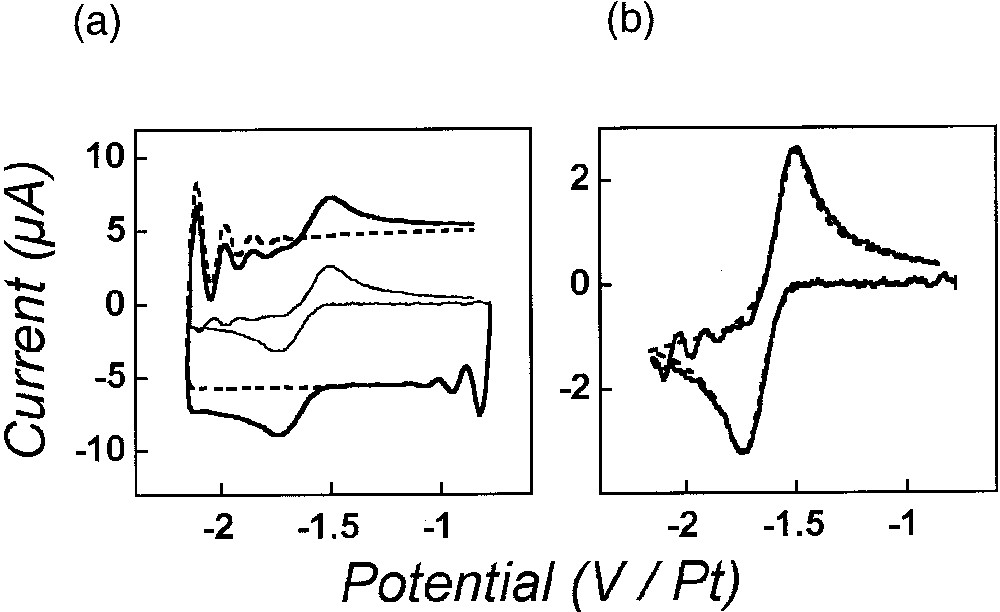
Cyclic voltammetry of the reduction of anthracene (14.3 mM in acetonitrile, 0.9 M NEt4BF4) at a gold disk electrode (r0 = 2.5 ± 0.1 μm) at 1.96 MV s–1 with 100% compensation. (a) Voltammograms obtained in the absence (dashed traces; capacitive current alone) or in the presence (thick solid trace; total experimental current: Faradaic and capacitive) of anthracene. The light solid trace in the middle of the figure represents the Faradaic current alone as obtained by arithmetic subtraction of the dashed voltammetric trace from the solid thick one (see text). (b) Comparison of the subtracted voltammogram (solid curve) shown in (a) to the corresponding theoretical voltammogram (dashed curve) as obtained by simulation of the Faradaic current only considering a pure Butler-Volmer charge transfer (E0 = – 1.61 V, α = 0.45, k0 = 5.1 cm s–1, D = 1.6 × 105 cm2 s–1, and r0 = 2.5 μm), without including any ohmic-drop, time constant or instrumental distortion [4]. The potential scales in (a, b) refer to a Pt-wire floating reference electrode. In (a) and (b), the voltammetric scan starts at –0.77 V in the negative direction. Adapted from [4].
Fig. 2a presents the electronic circuit of a potentiostat with on-line electronic compensation of ohmic drop and time constant which has been recently designed in our laboratory to allow undistorted voltammograms to be recorded up to scan rates of 2 500 000 V s–1 [3,4].
The drawback of this technique is however that since the resistance is virtually canceled by this procedure, the capacitive current tends to oscillate with a characteristic frequency depending on the selfic properties of the electronic components and of the circuitboard design, but also on the cell time constant Ru Cd [21]. This is shown in Fig. 2b. Therefore, one needs to avoid the development of large oscillations by adding some external electronic damping into the potentiostat circuit. This damping has to be optimized, since the damping time constant must be simultaneously high enough to avoid severe oscillations of the capacitive current at initial times (Fig. 2b), and small enough to avoid filtering of the Faradaic signal. The circuit design shown in Fig. 2a incorporates such a damping circuit, and the effect of increasing the damping constant up to its optimal value is shown in Fig. 2b. This demonstrates that virtually undistorted voltammograms may be obtained up to a few megavolts- per -second.
3.3 Experimental demonstration of the validity of the approach: reduction of anthracene
Reduction of anthracene in acetonitrile is one of the paramount of well-behaved redox systems affording among the highest heterogeneous rate constants of electron transfer. Its rate constant is in fact too high to be measurable by cyclic voltammetry performed at standard scan rates. However, the use of scan rates in the megavolt per second range allowed its facile determination: k0 = 5.1 cm s–1 (α = 0.45), as evidenced in Fig. 4 [4]. Furthermore, the validity of the procedure for ohmic drop and time constant on-line compensations is evidenced by the ‘rectangular’ aspect of the capacitive current in Fig. 4a, as well as by the very good agreement between the experimental subtracted voltammogram shown in Fig. 4b and the predicted one, which was simulated without consideration of ohmic drop, time constant or any instrumental distortions [4]. It is noteworthy that the important oscillations (compare Fig. 2b) which were apparent in the experimentally recorded voltammogram (Fig. 4a) almost cancel out upon subtraction of the capacitive current (Fig. 4b), which confirms experimentally that these instabilities are essentially contained into the capacitive current due to its derivative nature (equation (3)) and that they therefore do not affect significantly the instant potential applied to the Faradaic impedance [4].
Therefore, besides its intrinsic kinetic value, such experiment establishes the experimental validity of our approach as well as that of the potentiostat design shown in Fig. 2a.
4 Probing redox communication within molecules
We have established in the above that cyclic voltammetry may be performed without significant distortions up to a few megavolts-per-second. This range of scan rates correspond to the nanosecond range in terms of half-life time of electrogenerated intermediates, viz, to the time required for a molecule to move over a distance of a few nanometers (equation (1)). In other words, through this approach, voltammetric methods may be used over the whole kinetic range in which rate constants still bear their usual meaning related to chemical activation of molecules and are not affected by diffusive components [22].
However, we want to demonstrate here that access to such ultrafast voltammetry opens also the door to the direct and in-situ monitoring of dynamic chemical communication within molecules or other nanoobjects. This will be established here in the particular case of electronic communication within molecules adsorbed onto an ultramicroelectrode surface.
4.1 Redox coupling between a surface and the redox center of a molecule in a self-assembled monolayer
Self-assembled monolayers (SAM) have been the focus of increasing interest over the past decade [23]. One interest of the ‘SAM-strategy’ is that it allows the precise positioning of an active center at a given molecular distance from an electrode surface to which the center of interest is attached through adsorption of a tailored linker (Fig. 5a). This offers for example the possibility of testing the effect of virtually any chemical bonds present in the linker onto the long-range electronic coupling between a redox terminal center and an electrode.
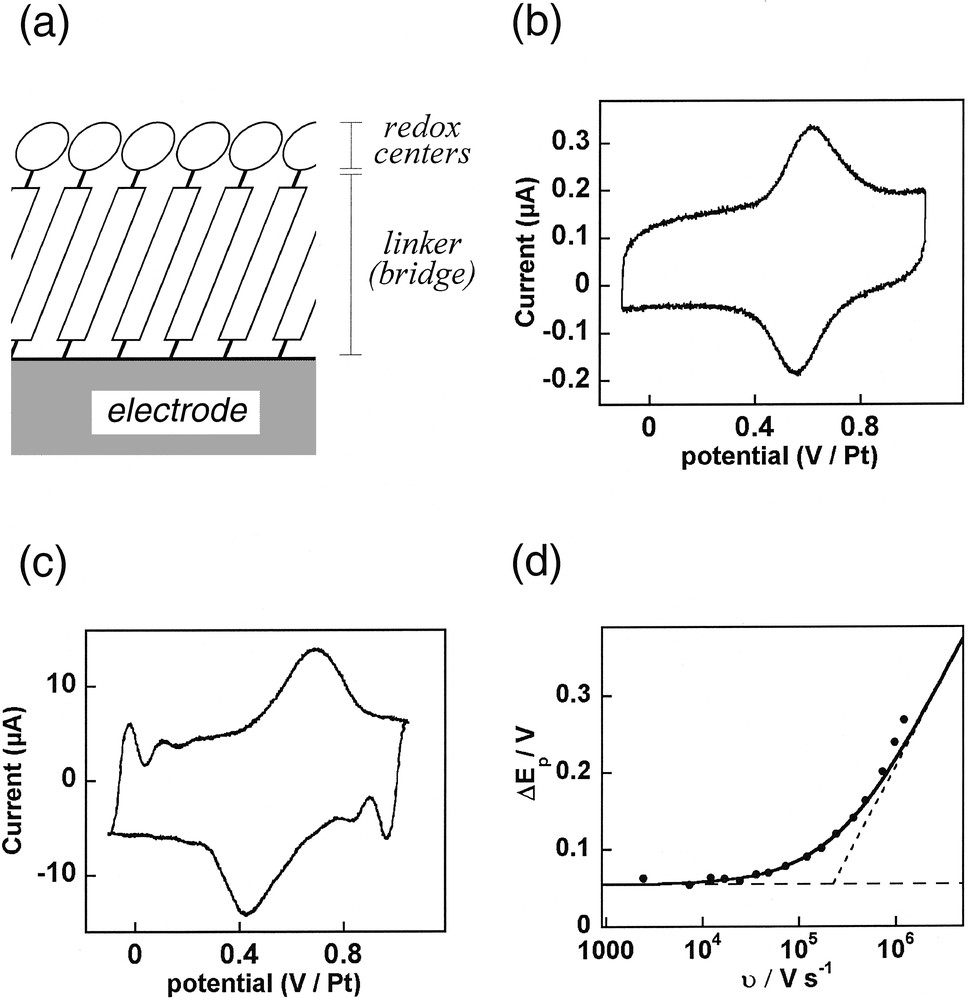
(a) Schematic representation of the molecule arrangement within a self-assembled monolayer (SAM) aimed to probe the electronic coupling between a redox center and an electrode surface through a given chemical linker (see equation (14)). (b,c) Cyclic voltammetry of a SAM of [Os(bpy)2(py–B)Cl]+ with B = –(CH2)2–py assembled onto a platinum polycrystalline ultramicroelectrode (r0 = 2.5 μm) placed in water/0.5 M NaNO3 at a scan rate: υ = 12 kV s–1 (b) or 0.96 MV s–1 (c). (d) Variations of the peak-to-peak potential separation between the anodic and cathodic waves versus the scan rate. Symbols: experimental data; solid curve: theoretical predictions for k = 4.3 × 10⁶ s–1 (α = 0.5); dashed lines: theoretical limits for a Nernstian (horizontal) or a limiting charge transfer (slanted) behavior.
Such long-range electron transfers are indeed extremely important in several biological molecules, for the properties of advanced organic materials as well as for the chemical engineering of molecular and supramolecular properties: non linear optics, molecular engines, molecular electronics, molecular switches, etc. However, up to now, the measurement of fast rates of electron transfers occurring within molecules could be performed only through fast photophysical methods which imposed generally to resort to very specific rigid tethers and to photochemically excited redox centers [24]. Indeed, this was formally accessible to electrochemical measurements through the SAM-strategy, but due to the kinetic limitations of usual electrochemical methods, direct measurements of such high rate constants were restricted to the measurement of rather slow kinetics or were indirect [25].
Theory predicts that the rate of electron transfer should drop exponentially with the distance λ separating the two coupled centers within the transition state [26]. Several studies of long-range electron transfer have confirmed this prediction and have shown that the rate of electron transfer drops exponentially with λ, with an attenuation factor per unit of distance β being of the order of 1 Å–1 [24,27], i.e. 10 nm–1, when the electron transfer occurs through space or over a non-conjugated bridge such as a saturated chain:
| 13 |
In the SAM strategy, the electron transfer efficiency of the bridge is reflected by the first order rate constant k (in s–1) of the electron transfer between the electrode and the redox center immobilized through this bridge (Fig. 5a). To demonstrate the ability of megavolt-per-second voltammetry to determine such rate constants, we have investigated the voltammetry of the self assembled monolayer of an osmium complex [Os(bpy)2(py–B)Cl]+ (py and bpy stand respectively for 4-pyridine and 2,2′- bipyridine, see equation (14)) linked to the surface of 2.5-μm-radius polycrystalline-platinum ultramicroelectrode through adsorption of the pyridyl terminal part of its linker B (B = –(CH2)2–py).
In the slow scan rates range, the corresponding voltammogram is composed of two symmetrical bell-shaped peaks (viz, one anodic, one cathodic, Fig 5b) whose shapes do not vary with the scan rate, except for a proportionality of their current intensities to the scan rate. This is characteristic of a Nernstian electron transfer for an adsorbed layer of redox centers [1]. In other words, up to moderately high scan rates, k is sufficiently large vis-à-vis the voltammetric time scale θ ≈ RT/F υ, viz, k θ >> 1, so that at each instant the whole population of osmium centers in the SAM layer is in redox thermodynamic equilibrium with the electrode potential. One may nevertheless notice in Fig. 5b that there is a scan rate independent slight peak-to-peak separation (55 mV), which evidences that a reversible phase transition occurs within the film upon oxidation and reduction [8]. The occurrence of this phase transition has been confirmed by quartz crystal microbalance studies [6,7,28–30] but this phenomenon is irrelevant to our present scope, since it is kinetically decoupled from the molecular dynamics of the individual [Os(bpy)2(py–B)Cl]+ centers upon electron transfer.
Upon increasing the scan rate, the time scale of the voltammetric experiment becomes smaller and smaller vis-à-vis the electron transfer rate constant, so that one may obtain ultimately k θ << 1, provided that sufficiently high scan rates may be achieved. This results in a distinctive modification of the anodic and cathodic voltammetric peaks, which become slanted and lose their symmetrical bell-shape, and shift toward higher potentials (Fig. 5c) so that an increasing peak splitting is observed upon increasing the scan rate (Fig. 5d). This behavior is characteristic of the transition into a kinetic regime where the electron transfer becomes limiting [1] and governs the voltammetric behavior of the SAM. Such a transition between fast and slow electron transfer regimes allows therefore a facile and precise determination of k [1]. From the data in Fig. 5d, one obtains k = (4.3 ± 0.5) × 106 s–1 (α = 0.5), which reveals the very strong electronic coupling between the osmium center and the platinum surface through its py–(CH2)2–py bridge.
4.2 Monitoring electron hopping communication within a nanometric molecular object
In this section we wish to elaborate about another ultrafast cyclic voltammetry application, which concerns the monitoring of electron hopping diffusion at the molecular level within a nanometric molecular object. Electron hopping between redox centers in molecular object has been widely used to explain special features of diffusion within conducting polymers [31–35]. This concept was introduced in the late sixties and early seventies [36–38] to explain why an apparent diffusion of redox centers may be observed, even when those centers are trapped within a matrix that then prevents their physical diffusion. Indeed, electron exchange between two identical molecules with different redox states located at two different sites within a matrix, is a tantamount of the physical displacement of each molecule towards the site where the other was located, as is evidenced in equation (15):
| 15 |
| 16 |
| 17 |
This notion of electron hopping has regained a large interest very recently, owing to the important debate about the possible occurrence of electron hopping communication between base pairs in DNA molecules [25,39,40]. In such a case, electron hoping could indeed be responsible for the propagation of a hole within a single DNA molecule over nanometric distances [41]. This phenomenon, if true as we believe, should have important consequence in rationalizing the effect of oxidatively induced mutations as well as in designing new concepts of biochips [41].
This prompted us to investigate if such electron hopping could be characterized directly by our ultrafast voltammetric techniques. Indeed, voltammetric experiments performed within nanosecond time scales correspond to the development of nanometric diffusion layer whose sizes thus approach those of single molecules. As a first approach aimed to validate this principle, we have investigated the occurrence of electron hopping within redox dendrimers adsorbed onto an ultramicroelectrode surface. Indeed, in comparison with DNA, dendrimers with pendant redox centers are well suited for investigation by ultrafast cyclic voltammetry due to their size and to the facile manipulation of their redox sites.
The specific molecule studied here is a fourth-generation polyamidoamide (PAMAM) dendrimer capped with 64 ruthenium(II) bis-terpyridine moieties, Ru(tpy)2 [42]. In moderately polar solvents, molecular modeling shows that the molecule has a spheroidal shape with a radius Rsoln of 5 nm, and that the redox sites tends to be exposed toward the solution so as to minimize the contact between the solution and the PAMAM linkers [42]. This justifies why when placed in acetonitrile solutions, these dendrimer molecules strongly adsorb to platinum surfaces to form a self-assembled monolayer (Fig. 6a) [42,43]. The ensuing monolayers of adsorbed redox dendrimer have been characterized by quartz crystal microbalance experiments as well as by STM techniques (Fig. 6a) [43], which revealed the precise quasi-hexagonal arrangement of dendrimers at the electrode surface. Yet, STM did not allow the investigation of the degree of electron hopping communication within each dendrimer. Furthermore STM could only image the “top” side of the dendrimer molecules, which thus appear as adjacent cupolas of slightly larger radius Rads (by ca 10%) than that in solution (Fig. 6a). As evidences by the sketch in Fig. 6b, such an increase of radius suggests that the dendrimer underwent significant deformation upon adsorption, in agreement with the large energies of adsorption (ΔG0 ≈ –50 kJ mol–1 for the RuII dendrimers) [42]. However, at this stage this had to remain speculative, since STM could not provide any information about the topology of the side of the dendrimer molecule located below its diametrical plane, which faces to the electrode surface but only about that of the part facing to the solution (Fig. 6b).
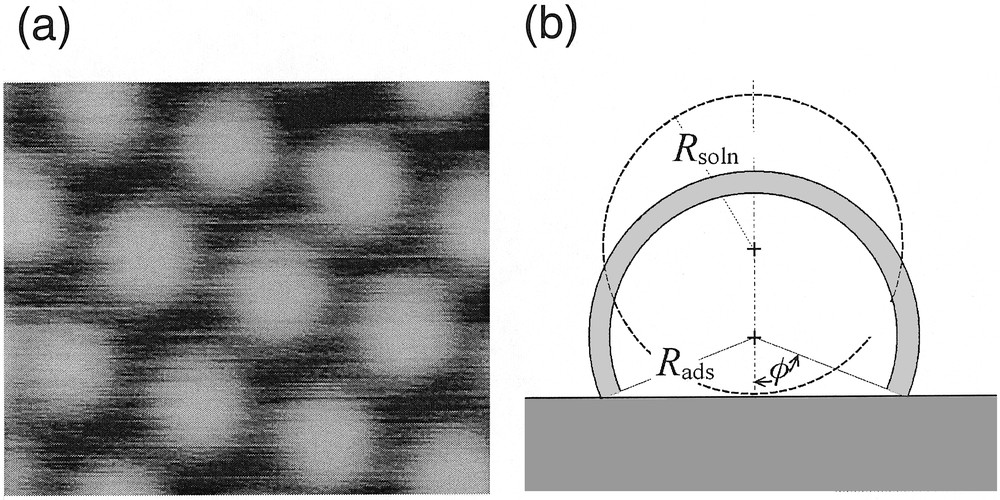
(a) STM imaging of the array formed bya first-generation polyamidoamide (PAMAM) dendrimer capped with eight ruthenium(II) bis-terpyridine moieties upon adsorption onto a platinum electrode surface (adapted from [43]). (b) Schematic representation of the 64-Ru/PAMAM dendrimer molecule investigated here adsorbed onto the platinum surface. Two configurations are shown. That shown in dashed line represents an undistorted molecule resting onto the electrode surface and retaining its solution radius, Rsoln. The other, shown in solid lines and gray domain, corresponds to a dendrimer which undergoes distortion in order to minimize the contact between its PAMAM linkers and the solution, and which exposes towards the solution an external shell (shown as the gray crown) in which the 64 redox sites are distributed (φ is the contact angle of the ensuing truncated sphere; Rads its radius; the thickness of the shaded area is d, the diameter of one Ru(tpy)2 center). Note that the two sketches are represented in scale assuming that the inner volume of each globule remains identical. Adapted from [8,44].
Let us consider one adsorbed dendrimer molecule with its shell of redox centers whose section is shown as the grey area in Fig. 6b. Whenever cyclic voltammetry is carried out at scan rates such that δ, the extent of the electron hopping diffusion layer – equation (1) where D is now replaced by Dhop given in equation (16) –, would result much greater than the dimension of the adsorbed dendrimer, all the 64 RuII metal centers are oxidized into their RuIII within a single anodic voltammetric scan. The voltammetric situation is then exactly comparable to that described above about the voltammetric investigation of the osmium SAM at slow scan rate.
On the other hand, if the scan rate may be made fast enough so that δ results smaller than the dimension of the molecule, a semi-infinite diffusion response within a truncated spherical cupola (viz, within the grey area in Fig. 6b) is expected. By careful consideration of this sort of diffusionnal response, information can be gained about the rate constant k, which sustains the electron hopping process (equation (16)) and also about the topology of the space in which the diffusive process occurs [8]. Therefore, the same experiment gives simultaneous insight into the degree of redox communication within the redox shell sketched in Fig. 6b and on the actual geometry of this shell. The later information gives access to the measurement of whatever deformation, if any, is experienced by the spherical dendrimer upon its adsorption onto an electrode surface. Extensive theoretical work has been performed in our laboratory in order to fully characterize the electrochemical behavior of this system, and to detail how the topology of the dendrimer redox shell could be extracted from a series of voltammograms obtained at different scan rates. These results have been reported in detail elsewhere [8]. Our aim here is thus only to summarize the corresponding results.
Cyclic voltammograms have been obtained at a wide series of scan rates ranging from 36 kV s–1 to 2.52 MV s–1, and a representative set of these voltammograms is shown in Fig. 7a–c [8,44]. It is clear from this set of voltammograms that one gradually passes from the situation where the whole dendrimer is oxidized at ‘slow’ scan rates (viz, 36 kV s–1, Fig. 7a) to that of a perfect transient voltammetry for the highest scan rates (viz, 2.52 MV s–1, Fig. 7c). This transition is better evidenced by the variations of the scan-rate-normalized peak current intensity, viz, Ip/υ1/2, as a function of the scan rate υ, which are presented in Fig. 7d. Thus, at slow scan rates, i.e., when δ >> Rads, the peak current intensity Ip is proportional to the scan rate (viz, Ip/υ1/2 ∝ υ1/2, in Fig. 7d) as expected for the voltammetry of a molecularly thin redox film adsorbed on an electrode surface [1,8]. At higher scan rates, i.e. when δ << Rads, Ip tends to be proportional to the square root of scan rate (viz, Ip/υ1/2 = constant, in Fig. 7d), as expected for a system undergoing semi-infinite diffusion [8].
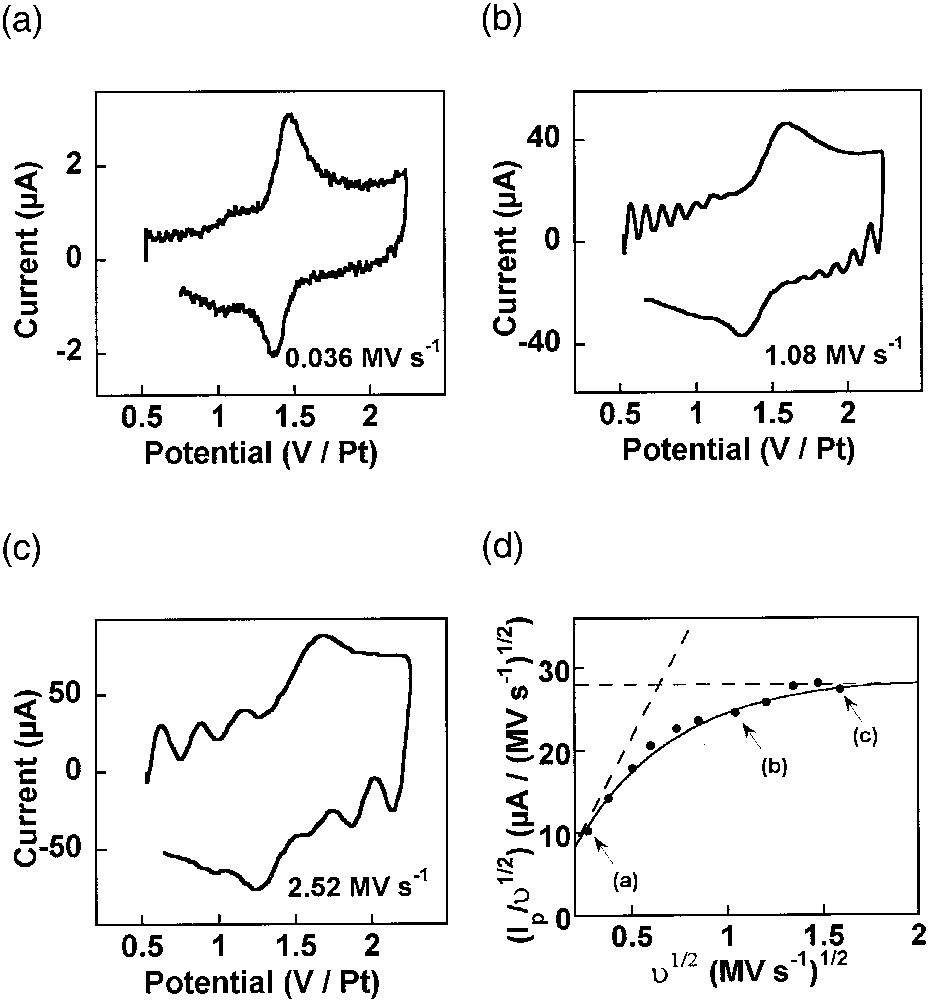
(a–c) Ultrafast cyclic voltammetry of a fourth-generation PAMAM dendrimer capped with 64 Ru(tpy)2 redox centers adsorbed onto a platinum electrode (r0 = 5 μm) in acetonitrile + 0.6 M NEt4BF4 (adapted from [8,44]). The scan rates are indicated on each panel in MV s–1. (d) Symbols: variations of the experimental scan rate-normalized voltammetric current peak intensity as a function of square root of scan rate. Solid line: predicted behavior for φ = 1.2 rad, Rads = 5.5 nm and Dhop = 5 × 10⁻⁶ cm2 s–1. The horizontal dashed line corresponds to the semi-infinite diffusion limit observed at ultrafast scan rates, and the slanted one to the thin-layer limiting behavior obtained at ‘slow’ scan rates (see text). Points labeled (a), (b), (c) in (d) correspond respectively to the voltammograms shown in (a), (b), (c).
For analysis, the diffusion equations for electron hopping on the surface of a sphere have been formulated and solved with the appropriate boundary conditions. This afforded expressions for the peak current intensity in terms of several parameters, namely Dhop, Rads, and φ [8]. In order to extract useful information from the voltammograms, simulations were carried out to extract the parameters which best matched the experimentally observed response [8]. The first crucial parameter is φ, since it characterizes the topology of the space in which the electron hopping diffusion occurs (viz, the gray area in Fig. 6b). Indeed, φ is a measure of how much the dendrimer deforms as it ‘squashes’ down onto the electrode surface. A series of working curves which characterize the variation of Ip/υ1/2 with υ1/2, for several values of φ, were calculated and then the experimental data were examined to find which working curve best fit the data [8]. From this analysis, a value of φ = 1.2 ± 0.1 rad was determined. The fit to the experimental voltammetric data is shown in Fig. 7d for this value of φ. Note that this value corresponds precisely to the solid shape drawn in Fig. 6b. It is thus deduced that the PAMAM dendrimer molecule does not rest on the electrode surface by retaining its spherical solution shape, but that its adsorbs by forcing a significant fraction of its chain linkers to be in close contact with the electrode surface (Fig. 6b). In fact, within the framework of this model and for the experimentally determined φ value, the disk of contact between the dendrimer and the electrode has a radius of Rads sin φ ≈ 0.93 Rads, so that it is very close from a diametrical section. Thus, the adsorbed dendrimer molecule more closely resembles a hemisphere than a sphere as it does in solution. Assuming that the dendrimer molecule retains more or less its inner volume when it adsorbs on the electrode surface, one obtains Rads ≈ 1.1 × Rsoln for this value of φ, so that the dendrimer molecule is predicted to apparently swell by 10% upon adsorption. Such prediction based on voltammetric data only compares extremely well with the result of STM investigations of related dendrimers on platinum electrode surfaces. Indeed, it was noted that the radius of the adsorbed globule was ca 10% larger than that for the free molecule [45].
For the above value of Rads and φ values, the fit in equation (7d) affords the value of Dhop = 5 × 10⁻⁶ cm2 s–1 [8]. Upon noting that the thickness of the spherical shell of redox centers is d = 1.4 nm (i.e. is equal to the molecular diameter of one Ru(tpy)2 redox center), equation (16) yields the value of the rate constant of the electron hoping reaction in equation (15) for AN/N+1 = Ru(tpy)2II/III. Thus, k = 4.8 × 10⁻¹⁶ L s–1 is determined. When converted into a homogeneous molar self-exchange rate constant (equation (17)), this corresponds to a value ksolnact of 1.7 × 10⁹ M–1 s–1 for the would-be homogeneous rate of electron transfer between a RuII and a RuIII. To the best of our knowledge, ksolnact has never been determined for RuII/III(tpy)2 complexes, but the self-exchange rate constant ksolnact ≈ 109 M–1 s–1 has been reported for the related RuII/III(bpy)3 system in water [46]. In other words, the measured Dhop value corresponds exactly to what is expected for a solution electron self-exchange involving two redox centers that are adjacent in the transition state.
However, the redox sites distributed on the surface of the dendrimer molecule are neither adjacent, nor are they able to achieve permanent close contact. Indeed, it can be estimated that to achieve a full coverage of the ‘squashed’ dendrimer surface with redox centers being in close contact, 140 redox sites would be necessary. Since only 64 are present on each dendrimer molecule, the RuII/III centers cannot be in close contact, and their average center-to-center distance, λ, is ca 2 nm.
Considering the above average distance λ = 2 nm and using equation (13) with β = 10 nm–1 predicts that the rate of electron transfer observed between two centers resting on the surface of the dendrimer at their statistical equilibrium positions should be approximately one thousandth of the observed one. The experimental value of k, however, is comparable to that expected for free centers in solution which come into close contact upon electron transfer. That leads to the conclusion that, even though the redox centers are linked to their dendritic branches, they must possess considerable mobility inside their potential wells, at least for what concerns displacements of a few angstroms, which are required to reach close contact in the transition state of the electron transfer reaction. Since the radius of one ruthenium center is ca 0.7 nm, this implies that a pair of two nearby centers should move cumulatively by 0.6 nm from their equilibrium positions to reach close contact without a high energetic cost or severe viscous drag [8], since these factors would be immediately reflected into the k value [8].
Using the experimentally determined k value, it is possible to determine a maximum value of the force constant attracting each redox center in its potential well and to subsequently estimate the maximum tolerable surfacic viscosity of a ruthenium center when it moves within its potential well [8]. The result of that calculation is that the surfacic viscosity, ηS, of one Ru(tpy)2 molecule in its potential well is considerably less than 10–20 N s m–1 [8]. For comparison, application of the Stokes-Einstein relationship to Dsoln = 5 × 10⁻⁶ cm2 s–1, a typical value for the diffusion coefficient of a free Ru(tpy)2 molecule in solution would predict a surfacic kinematic viscosity ηSpred = ηsoln d = 6 π (d/2) Dsoln /kB T = 7 × 10–13 N s m–1, if the viscous drag on the same center in the dendrimer was identical to that in solution. This latter value exceeds considerably the maximum allowable value of ηS for the dendrimer system owing to the measured k value. In other words, the viscosity of the redox centers on the spherical dendritic shell is at least 106 times smaller than that in a free solution, which evidences that the centers have a considerable mobility compared to that in a liquid solution.
At first glance, this is certainly counterintuitive since in a dendrimer a Ru(tpy)2 center is linked to a radial chain that ought to rub against their neighbors upon any of the motion Ru(tpy)2 center. Our results show therefore that these frictions between linkers are minimal even for a ‘squashed’ dendrimer, at least when a nearby pair of RuII and RuIII centers move over a distance of ca half a nanometer towards each other to achieve close contact at the electron-transfer transition state. Most importantly, the dendrimer structure seems to prevent the building-up of the tight solvent and ionic atmosphere around each redox center such as those that exist in solution and are responsible for the electrophoretic drag. This may reflect the fact that the magnitudes of the physical phenomena are different. Indeed, here the movements that bring the centers into close contact occur only over a few angstroms, while those considered in solution in defining diffusion coefficients involve much longer distances. This may also be due to the fact that the dendrimeric structure itself prevents tight electrophoretic atmospheres to build up. At this stage, this remains an open question; nevertheless the experimental fact is that mobility of the ruthenium centers is greatly enhanced compared to what occurs in a solution and which is reflected by usual diffusion coefficients. To the best of our knowledge, this important effect has never been considered before. However, this unsuspected facile mobility of dendrimer-borne active centers certainly needs to be taken into account in rationalizing the reactivity of dendrimer-supported catalysts. Indeed, this may induce considerable chemical cross-talk between vicinal catalytic centers and thus enforce mechanistic paths that may greatly differ from those known for the same catalysts when they are homogeneously dispersed or covalently bound to a solid support.
5 Conclusion
By taking advantage of the capability to obtain undistorted cyclic voltammograms up to scan rates in excess of 2.5 MV s–1, we have been able to demonstrate that voltammetric methods can be used with great kinetic profit to monitor very fast chemical processes occurring in the nanosecond time domain.
Most importantly, since these ultrafast scan rates correspond to diffusion over sub-nanometric distances, voltammetric methods can be elaborated into ‘molecular microtomes’ offering new experimental tools through which the dynamics and the topology of nanoscopic molecular objects adsorbed on surfaces may be investigated by a precise adjustment of the size of nanometric diffusion layers.
Acknowledgements
This work was supported in parts by CNRS (UMR 8640 ‘PASTEUR’), ‘École normale supérieure’ and the French Ministry of Research for the French part and by Cornell University for the US part.