

1 Introduction
Annexins constitute a family of multi-domain proteins characterized by a main C-terminal core whose three-dimensional organization is highly hierarchical. This core consists of four ~70 residue domains, D1 to D4 (Fig. 1), exhibiting an identical topology with only a limited sequence homology of approximately 30%. The domain topology comprises five helix segments, named A to E (Fig. 1b), organized in a characteristic super helix motif [1]
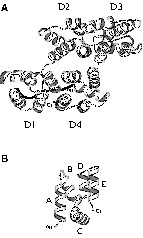
(a) Ribbon representation of the structure of annexin I from crystallographic data. (b) Topology of one domain of annexin I, showing the five helices A, B, C, D and E.
It was previously shown that, when isolated from the rest of the protein, the annexin domains exhibit a large scale of stability. In particular, the isolated D1 domain of annexin I conserves the super-helix 3D topology, constituting an autonomous folding unit, whereas the following isolated D2 domain is unable to adopt a tertiary fold, exhibiting only residual secondary structures [2–4]. These findings comforted us in the choice of annexins as suitable models for investigating both the mechanisms governing the folding process of a multi-domain protein and the sequence-stability relationships associated with a given topology.
The divergent behaviour of the two isolated D1 and D2 domains is connected to very distinct dynamical features, and the description of the amplitudes, rates, and mechanisms of the various motions present in those domains is an essential step in the understanding of protein folding processes. We previously analysed by Nuclear Magnetic Resonance the dynamics of the partially unfolded D2 domain, which is dominated by fast motions in the pico-to-nanosecond range [5,6]. We present here a preliminary analysis of the dynamics of the D1 domain, focused on the analysis of slow motions in the μs–ms range. The use of a relaxation-compensated Carr–Purcell–Meiboom–Gill sequence as proposed by Loria et al. [7] allowed us to demonstrate the presence of such conformational motions in this domain and to characterize them.
2 Materials and methods
2.1 NMR sample
The annexin I D1 domain production and purification were achieved as previously described [4]. The sequence of the D1 domain contains 81 amino acids (~9 kDa). The D1 domain was solubilized in a 20 mM phosphate buffer, 90% H2O, 10% D2O, pH 3. The D1 domain concentration in the sample was 1 mM.
2.2 NMR experiments
NMR experiments were carried out on a Bruker DRX spectrometer operating at 600 MHz and equipped with a 5-mm triple-resonance gradient probe with actively shielded z-axis gradients.
The pulse sequence used to determine chemical exchange in the D1 domain was based on previously-described relaxation dispersion experiments [7,8]. The frequency of the pulses of the CPMG-like sequence, νCPMG, is defined as 2/τcp, where τcp is the delay between two 180° nitrogen pulses. This frequency varies with the experiments, so that the total number of pulses applied during the CPMG-like sequence varies too. To compensate that difference and thus avoid a possible temperature difference between the experiments, a series of off-resonance pulses was applied at the very beginning of the pulse sequence on the 15N channel. The CPMG-like sequence duration was kept constant, as described by Mulder et al. [8]. It had to last long enough to observe a significant effect on the peaks observed, and short enough for us to be able to observe these peaks. The optimal value for the D1 domain was found to be equal to 50 ms. The values of νCPMG that could then be used were 81, 164, 248, 335, 424, 515, 608, 703, and 800 Hz. The 90° nitrogen pulse was equal to 35 μs. Twelve experiments were performed to determine R2eff: two experiments recorded without the relaxation delay performed at the beginning and at the end of the series, and used as reference experiments, one experiment at each one of the above-mentioned frequencies, and a doublet at 515 Hz.
Measures were realized at 293 K. All experiments were recorded with 1024 points in the 1HN dimension, 256 points in the 15N dimension, with eight scans per FID, and a recycle delay of 3 s (approximately 1 h 50 min per experiment). Experiments were recorded with the 1H spectral-width set to 13 ppm, and the 15N spectral-width to 25 ppm. In all cases, quadrature detection was achieved by the echo-antiecho method.
2.3 Data processing and determination of relaxation rates
NMR spectra were processed using Bruker software XwinNMR. A pure squared cosine bell and a pure cosine bell were applied along t2 and t1 respectively. The data were zero-filled to 512 points along t1 and to 4096 along t2 prior to Fourier transform. Finally, an automatic baseline correction was applied in both dimensions, using the corresponding XwinNMR function. Peak picking, peak integration and intensity determination were performed using the software AURELIA.
Values of R2eff were calculated from the following relation: R2eff(νCPMG) = –1/T × ln(I(νCPMG)/I0), where R2eff is the effective transverse relaxation rate constant, T is the length of the relaxation delay, I(νCPMG) is the intensity of a peak at frequency νCPMG, and I0 is the intensity of the same peak on the reference spectra. The resulting relaxation dispersion data R2eff(νCPMG) were fitted for each available residue to (i) a flat line, (ii) the fast-exchange equation [9] (see Eq. (1) displayed below) and (iii) the general equation for two site exchange (see Eq. (3) of Millet et al.) [10]. Fittings were achieved using the Levenburg–Marquardt minimization algorithm, implemented in the Matlab software. Initial values for parameters were obtained from a grid search minimization. F-test criteria were used to assess the statistical significance of using successively more complex models (form (i) to (iii)), and more complex were only retained when justified. No residue yielded a statistically significant improvement from the second to the third model. Goodness of fits and error estimations were obtained using established Monte Carlo procedures, with an experimental error calculated using the doublet experiments at 515 Hz. Five hundred simulated data sets were selected from a Gaussian noise distribution centred on the R2eff values back-calculated from the optimised parameters. A model was considered satisfactory if the optimised χ2exp lay within the 95% confidence limit obtained from the 500 Monte Carlo simulations, i.e. χ2exp < χ295%.
In the limit of fast exchange (kex > Δω) and using a two-site exchange model, three parameters describing the exchange process, , τex, and Φex (Φex = Δω2 pA pB) can be extracted from curve fittings to the experimental data, using the established equation:
| (1) |
3 Results and discussion
3.1 Relaxation constants measurements
The presence of conformational motions occurring in the micro- to millisecond timescale can give rise to line broadening of the NMR resonance, which yields an additional Rex contribution to the intrinsic transverse relaxation rates of nuclear spins. Quantification of this exchange contribution from standard transverse R2 measurements is however difficult, for multiple reasons: (i) the increase in the R2 relaxation rates can come from various parameters, such as an anisotropy of the molecule, or the presence of multiple nanosecond timescale motions; (ii) for residues undergoing conformational motions, the observed R2 relaxation-rate constants depend on the pulse spacing (τCP) between 180° pulses of the CPMG sequence used to refocus the 15N magnetization during the relaxation period. The observation, or not, of an increase of R2 relaxation rates leading to the hypothesis of conformational motions then depends on the choice of this pulse spacing. Actually, the dependency of R2 with the pulse repetition rate in the CPMG, due to the fact that τCP lies in the range of the exchange processes, allows one to show unambiguously the presence of conformational motions. However, the interpretation of data obtained using classical CPMG pulse trains at multiple frequencies is complicated by the difference in the relaxation rates between in-phase and anti-phase coherences.
The relaxation-compensated CPMG experiment (rcCPMG) developed by Loria and coll. allows quantification of chemical exchange processes by rendering evolution of in-phase and anti-phase coherences independent of the pulse spacing [7]. The values of R2eff thus obtained can be fitted using Eq. (1) to extract kinetic parameters (kex) under the assumption of fast conformational exchange (kex > Δω).
Values of R2eff could be evaluated at all νCPMG frequencies for 69 out of the 76 nitrogen amides of the D1 domain of annexin I. For I34 and K39, signal was below detection in the experiment using the lowest value of νCPMG (81 Hz), as a result of too important line broadening. For residue A31, R2eff could be calculated for only four values of νCPMG. Residues T38, L76 and L79 gave no observable signal for any value of νCPMG at 293 K. These residues appear in the HSQC spectra at higher temperature, indicating that their absence at 293 K is due to exchange broadening. Their Rex contribution is here too high to be quantified.
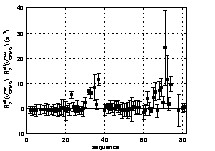
The contribution of conformational motions to the value of R2eff is minimal for high values of CPMG pulse train frequencies. Values of R2eff (νCPMGmax = 800 Hz) thus reflect mostly the fast dynamics of the D1 domain in the pico-to-nanosecond range. They are displayed as a function of the sequence of the protein in Fig. 2. Absolute values of these data cannot be analysed because of proton–proton relaxation, which contributes to the anti-phase nitrogen relaxation rate constant. However, the profile R2eff along the sequence reveals a striking difference of dynamical behaviour of the extremities of the domain. In the N-terminal side, the increase of R2eff observed from residue 2 to residue 11 reflects the classical increase of flexibility in the hundred-of-picoseconds range, indicating a loss of structuration when going to the N-terminal extremity. This phenomenon is not observed in the C-terminal segment, where the values of R2eff remain roughly constant, indicating that motions remain highly restricted up to the last residue. It shows that the domain retains a high degree of structure in its C-terminal extremity.

Values of the effective relaxation rate constant R2eff (in s–1), determined for the D1 domain of annexin I using the highest CPMG pulse train frequency (νCPMG = 800 Hz), as a function of the sequence of the domain.
3.2 Conformation exchange in the D1 domain
A first rough estimation of the amount of conformational motions along the backbone of the D1 domain can be evaluated from the difference in the R2eff values obtained for the two extreme values of νCPMG (81 and 800 Hz). The results are shown in Fig. 3. A number of residues exhibit significant positive values of R2eff (νCPMG = 81 Hz) – R2eff(νCPMG = 800 Hz), showing that conformational exchange occurs at multiple backbone sites along the protein. The corresponding residues are mainly located in two regions of the D1 domain, between residues 30 and 40 and between residues 62 and 77. A more isolated exchange contribution is also evident for I23. Residues 31, 34 and 39, whose resonances were too broadened in the experiments performed with νCPMG = 81 Hz, do not appear in the figure. An extrapolation from the values obtained at higher field frequencies allows an evaluation of R2eff(νCPMG = 81 Hz) – R2eff(νCPMG = 800 Hz), leading to exchange contribution higher than 40 Hz for these residues. Residues 38, 76 and 79, whose resonances are broadened below detection for all frequencies, are likely to exhibit even higher conformational exchange contributions that cannot be quantified from CPMG experiments.
Qualitative estimation of residues exhibiting backbone conformational motions from the difference values of R2eff at the minimal (νCPMG = 81 Hz) and maximal (νCPMG = 800 Hz) CPMG pulse repetition rate. R2eff(νCPMG = 81 Hz)–R2eff(νCPMG = 800 Hz) are displayed as a function of the D1 domain sequence. Values equal to zero and positive are expected for residues without conformational exchange and for residues that undergo conformational exchange, respectively.
3.3 Conformational exchange parameters
R2eff(νCPMG) relaxation dispersion profiles were then fitted to either a flat line or to Eq. (1) to evaluate the conformational exchange rate (see § Material and Methods). Some characteristic relaxation dispersion curves are shown in Fig. 4, and the exchange rate constants obtained from the fits are displayed as a function of the D1 domain sequence in Fig. 5. The fitting procedure yielded reliable values of exchange rate constants for the 14 residues for which conformational exchange had been detected in the preliminary analysis. The parameters extracted from the fit are shown in Table 1. Only residue A 31 did not lead to a satisfactory fit, due to the too small number of available points (only four R2eff(νCPMG) values). Values of kex range between 1300 and 2500 s1, corresponding to values of exchange times going from 400 to 750 μs. These values are comparable to those found on other proteins [7,10–15], and are compatible with the hypothesis of fast exchange at the chemical-shift scale.
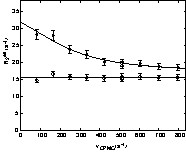
Relaxation dispersion curves for the D1 domain of annexin I at 600 MHz and a temperature of 293 K. R2eff(νCPMG) curves were fitted to Eq. (1) describing a fast chemical exchange between two sites. Data are shown for residue E74 that exhibit chemical exchange and residue H20 in which no dispersion is observed.

Values of the exchange rate constant kex as a function of the D1 domain sequence. kex values were obtained from the fit of the dispersion curves to Eq. (1) describing a fast chemical exchange between two sites.
exchange parameters of D1 domain
| Residue | δv (ppm) | τex (ms) | kex (Hz) | R2inf (Hz) |
| I23 | 1.0 ± 0.7 | 428 ± 154 | 2336 ± 841 | 14.8 ± 1.6 |
| E30 | 0.8 ± 0.7 | 399 ± 248 | 2506 ± 1558 | 13.4 ± 2.0 |
| T32 | 0.9 ± 0.6 | 575 ± 163 | 1739 ± 493 | 14.7 ± 1.2 |
| I33 | 1.0 ± 0.8 | 473 ± 166 | 2114 ± 742 | 15.1 ± 1.7 |
| D35 | 1.1 ± 0.7 | 491 ± 146 | 2037 ± 606 | 14.6 ± 1.6 |
| L37 | 1.1 ± 0.5 | 593 ± 128 | 1686 ± 364 | 16.6 ± 1.1 |
| E62 | 0.65 ± 0.4 | 736 ± 312 | 1359 ± 576 | 13.9 ± 0.7 |
| K65 | 0.75 ± 0.7 | 681 ± 44 | 1468 ± 949 | 16.0 ± 1.5 |
| K66 | 0.95 ± 0.8 | 524 ± 218 | 1908 ± 794 | 13.4 ± 1.7 |
| T68 | 0.9 ± 0.6 | 577 ± 135 | 1733 ± 405 | 12.8 ± 1.0 |
| G70 | 0.6 ± 0.6 | 619 ± 278 | 1616 ± 726 | 12.5 ± 1.2 |
| H71 | 1.6 ± 1.0 | 591 ± 186 | 1692 ± 533 | 14.4 ± 2.6 |
| L72 | 1.2 ± 1.0 | 612 ± 306 | 1634 ± 817 | 15.5 ± 2.7 |
| E74 | 1.0 ± 0.6 | 583 ± 138 | 1715 ± 406 | 16.9 ± 1.1 |
It should be noted that the absence of exchange contribution only indicates that the corresponding residues do not exhibit conformational motions at the timescale probed by the rcCPMG experiments, i.e. in the range 200–5000 Hz for kex. This limitation is due to the limitation in pulses spacing and pulses repetition rates in the CPMG sequence. Especially, motions characterized by faster exchange constant rates are not detected here.
3.4 Localization of conformational exchange in the D1 domain
Fig. 6 shows the exchange rate constants reported on the 3D structure of the D1 domain. This structure was extracted from the crystallographic structure of the entire annexin I. It is composed of five alpha helices named helices A, B, C, D and E, organized in a super helix motif. Residues E 30, A 31, T 32, I 33, I 34, D 35, L 37, and K 39 are all located in helix B, residues E 62, K 65, K 66 are located in helix D, and residues G 70, H 71, L 72, and E 74 are located in helix E. The extensive conformational exchange observed in this annexin domain is remarkable and still awaits an interpretation in terms of folding mechanism or biological significance.
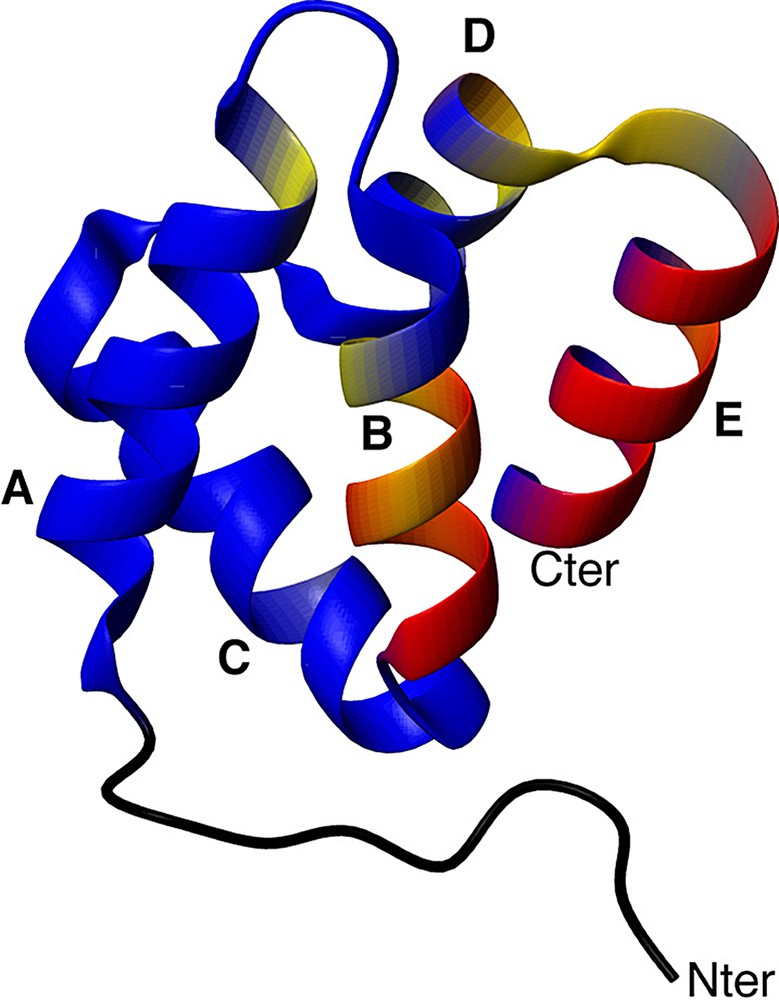
Localization of conformational motions in the D1 domain. Backbone residues are coloured from blue (no exchange contribution) to yellow (moderate exchange contribution) to red (high exchange contribution). Helices are indicated.