

1 Introduction
Since many years, adsorption of particles onto surfaces has been extensively studied, both theoretically and experimentally. This interest has practical and fundamental reasons. Adsorption of proteins onto surfaces of medical implants, production of biosensor detectors, deposition of colloidal particles onto inner surfaces of tubes and containers in industrial installations, deposition of particulate materials on ship’s hulls, wings and other elements of airplanes are just a few examples of systems for which knowledge on adsorption of particles is very important. Studies of particle adsorption are interesting also as an element of fundamental investigations on packing three-dimensional objects on surfaces.
Initially the adsorption leading to formation of monolayers of adsorbed objects was described using the simple Langmuir model [1]. One of the most important parameters characterizing absorbing surfaces is surface coverage (θ), defined as a fraction of the surface covered with adsorbed particles (θ = N q/S0, where N is the number of adsorbed particles, q surface covered by one particle and S0 total surface area). According to the Langmuir model the rate at which the surface coverage increases is proportional to the surface fraction not covered with particles (1 – θ(t)) multiplied by the concentration of particles in the bulk (C). The rate at which the surface coverage decreases due to desorption was assumed to be proportional to the surface coverage at a given moment. Combination of these terms yields equation (1), describing the overall rate at which θ changes with time:
| (1) |
In equation (1), ka and kd denote the rate constants of adsorption and desorption, respectively.
It has been noticed, however, that equation (1) is oversimplified and cannot be used for characterization of real systems [2]. Namely, the fraction of the surface excluded from adsorption of new particles is larger than the surface coverage and in effect the surface available for adsorption is smaller than (1 − θ) [2–4]. Indeed, any isolated spherical particle with radius R (surface coverage π R2) excludes from adsorption of similar particle the surface π(2R)2. This is because any new particle cannot be deposited at a distance closer than 2 R from the adsorbed one (overlapping of particles not allowed). Thus, it is necessary to include in the kinetic equation (1) a function Ψ(θ,t) correcting size of the excluded area:
| (2) |
In principle, Ψ(θ) depends not only on the coverage but also on time and should be written as Ψ(θ,t). One could expect that, for systems with desorption and lateral diffusion of adsorbed particles, the distribution of particles on surface, and thus fraction of surface excluded from adsorption, may change with time even without any changes of θ. The average time (τΔr) after which Ψ(θ,t) (for θ = constant) approaches its equilibrium value on the surface area Δr2 equals τΔr = Δr2/4 D (D denotes surface diffusion coefficient).
In the case of adsorption from a mixture of n types of particles differing in size, equation (2) should be replaced with a set of differential equations (3) and (4).
| (3) |
| (4) |
The analytical form of the function f (cf. equation (4)) is not known, however, for θi = constant, the rate with which Ψ(θ1, θ2 ,...θn, t) changes with time should depend on positions of particles (
Due to the mentioned above difficulties solutions of equations (3)–(4) were found only for simplified systems. For example, there were analysed systems with irreversible adsorption of particles (kdi = 0) that cannot diffuse on the surface (Di = 0). The assumptions mentioned above are valid when the attractive short-range particle–surface interactions are strong. For such systems,
| (5) |
Equation (5) was solved by many authors who used analytical and/or Monte Carlo based computer methods [2,4–7]. It has been found that for long time θt→∞= 0.547 (jamming limit).
Kinetic equations were analysed also for an extreme case when diffusion of particles on the surface is so fast that at any moment, for a given number of adsorbed particles, particle distribution on the surface is at equilibrium [2]. Recently, there were published papers dealing with irreversible and/or reversible adsorption of particles with polydisperse diameter distribution [9–12]. There were analysed also systems allowing the adsorbing particles, which are falling onto the adsorbed one, to diffuse around in a search for a free area [6,10] and systems with changes of the area occupied by one particle (due to changes of its shape) [11,13]. However, systems taking into account together such events as: adsorption, desorption and lateral diffusion on surface (random sequential adsorption, desorption lateral diffusion–RSA–DLD systems) till now were not analysed.
In this paper we present some results of the studies based on the RSA-DLD model. In these studies the adsorption from binary mixtures of hard spheres with different radii was investigated. For analysed systems we assumed high rates of particle adsorption and very low rates of particle desorption. Such behaviour is characteristic for the adsorption of proteins from protein mixtures. Typically, the above process comprises an initial period during which the composition of the surface layer is controlled by the kinetics of adsorption and a much longer period during which an equilibrium composition is being established [14]. It has to be stressed that in the case of proteins, not their size, but other factors, such as enthalpies of protein-surface interactions and changes related to entropies of denaturation accompanying adsorption, determine the composition of the adsorbed layer.
Adsorption of polymer microspheres is usually irreversible. However, recently we noticed that adsorption of microspheres with hydrophilic surfaces (polystyrene core/polyglycidol shell particles) on mica is reversible and allows for an exchange of adsorbed microspheres and microspheres in suspension (S. Slomkowski, S. Sosnowski, E. Przerwa, M. Gadzinowski, A. Dworak, M.M. Chehimi, Europolymer Congress, Stockholm, Sweden, June 2003).
Many authors approximated adsorbed spheres with hard disks. However, such approximation is not valid for spherical particles with various diameters that are able to diffuse on the surface. For the hard disk model, the shortest distance between the centres of the adsorbed particles is equal to the sum of their radii. However, in the case of lateral diffusion, there are possible situations (an example is shown in Fig. 1 ) when the distance between the centres of the particles projected onto the surface is shorter than the sum of the particle radii. We took this factor into account while writing the program for our studies.
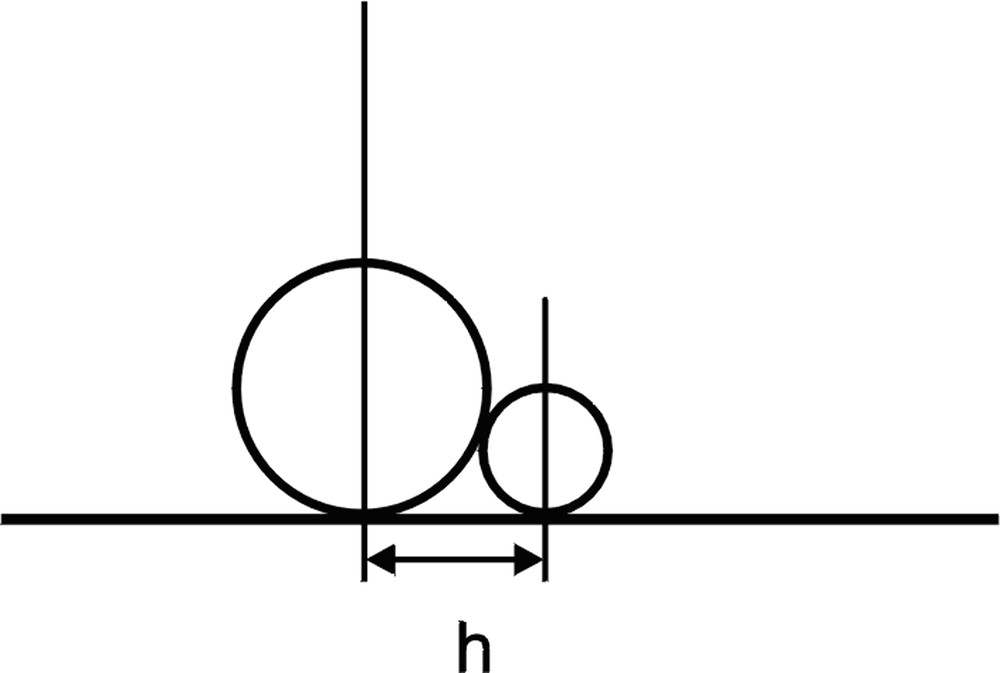
Large and small particle at their close contact. Distance between projections of particle centres on the plane of adsorption.
2 Computer program used for simulations
The computer program written in our laboratory for simulation of particle monolayers formed on a square cell by particle deposition from binary mixtures is based on the Monte Carlo-type algorithm. The program is able to handle up to 106 particles. However, only for less than 10 000 deposited particles, the computer experiments could be performed within the reasonable time (using conventional PC machines up to 100 hours). The role of the ‘wall’ effects was minimized by using the periodic boundary conditions.
Variable parameters affecting formation of particle monolayers included: concentrations of particles of each kind in a space adjacent to the surface, rate constants of particle adsorption on selected not occupied site (relative accuracy of site position in x or y directions was 10−9 with respect to the edge of the cell), probability of lateral movement of an adsorbed particle in a randomly selected direction on the surface (assuming that other particles do not interfere with such event), and rate constants of desorption. Computer experiments were carried out assuming that the concentration of each type of particles just above the absorbing plane does not change with time. This means that the total number of particles in the reservoir above the plane is much higher than the maximal number of particles that could be deposited onto the cell surface and that the characteristic time for particle diffusion in the bulk is much shorter than the characteristic time for particle adsorption and/or desorption.
The assumption that particles are spherical has the following consequence. When the distance h between projections of particle centres on the surface fulfils the condition
For the adsorption of spherical particles, we took into account the possibility that the falling sphere may slip on the one that has been already adsorbed (the ballistic model introduced by Jullien et al. [15]). In effect, the incoming particle is deposited next to the first one (cf. Fig. 2 ), provided there is a sufficient space for such deposition. When the incoming sphere falls exactly onto the top of the adsorbed sphere, or in such a way that the distance between projections of particle centres is smaller than X percent of the adsorbed particle radius (X will be called an exclusion parameter), the incoming particle is scattered back. Otherwise, it rolls down toward the surface, as indicated in Fig. 2.
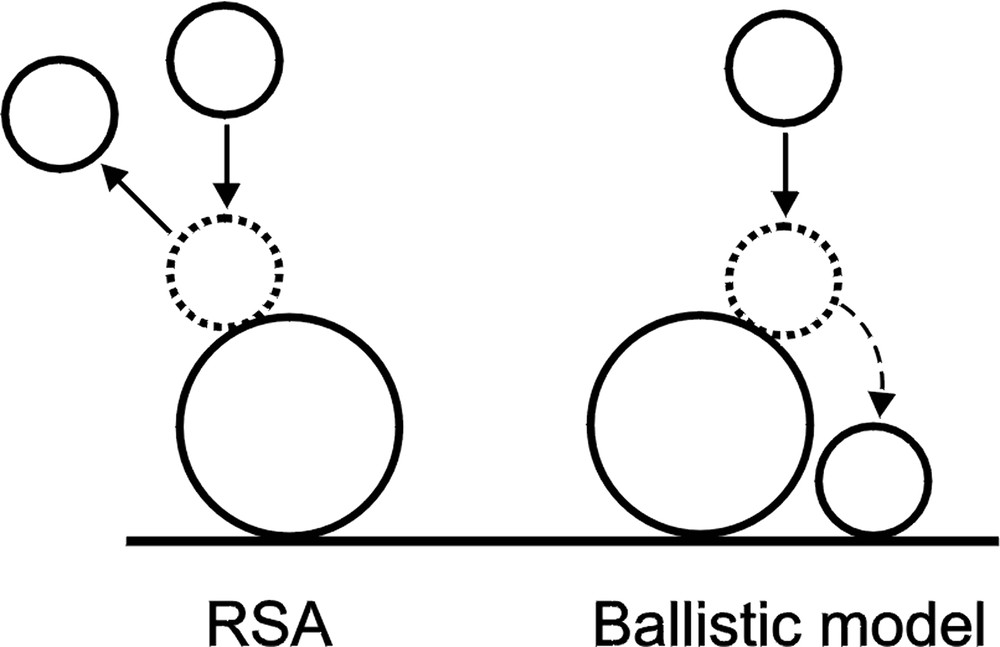
Interaction of adsorbing particle with adsorbed one according to the RSA model and the modified RSA model with ballistic deposition.
Simple reasoning allowed determination also of the locations of adsorption sites for spheres that rolled on two adjacent particles deposited earlier on the surface.
It is worth to mention also another model (‘mobile adsorption model’ introduced by Pefferkorn et al. [6,10]) taking into account interactions of adsorbing particles with particles that have been adsorbed earlier. According to this model, when a randomly selected area is already occupied, the adsorbing particle is able to move in the interface and becomes adsorbed in the immediate vicinity of the first selected position. In comparison with the standard RSA model, both the ballistic and the mobile adsorption models induce increased probability of particle adsorption in the nearest vicinity of the adsorbed particles. However, comparison of computer experiments based on these models has not been performed.
Computer experiments performed during our studies required input of the following parameters:
- • total concentration of particles in the space adjacent to the adsorbing plane (C0);
- • fraction of small (f1) particles (fraction of large particles f2 = 1 – f1);
- • radii of small (R(1)) and large (R(2)) particles;
- • rate constants of adsorption and desorption for small (k′a(1) and k′d(1)) and large (k′a(2) and k′d(2)) particles
- • probability of on plane diffusion (PD) and maximal length (λ) of a jump for small and large spheres (PD(1), PD(2), λ(1) and λ(2))
Probabilities of particle adsorption during time increment Δτ onto the non-occupied surface were calculated as follows: Pa(1)=k′a(1)f1C0Δτ and Pa(2)=k′a(2)f2C0Δτ.
We took into account the possibility that the adsorbed large spheres at some locations may screen the small spheres (cf. Fig. 1) and hinder their desorption. Thus, when the distance h between projection of the centre of small sphere with radius R(1) onto surface and projection of the centre of large particle (with radius R(2)) fulfils the condition
Each computer experiment included repetition of the following steps
- • (i) Attempted adsorption of small particles. This process includes generation of a random number q in the range from 0 to 1. If q >Pa(1), the computer skips further steps related to adsorption of a small particle and proceeds to adsorption of the large one. However, if q <Pa(1), a place on the cell surface for adsorption of the small particle is selected randomly; provided this place is free, the incoming particle becomes adsorbed. Otherwise, when the distance between projections of the centres of incoming and adsorbed particles differs more than by X percent of the radius of adsorbing particle (exclusion parameter), the ‘ballistic’ model has been assumed for particle deposition (i.e., the adsorbing particle slips on the adsorbed one towards the surface). When this distance is equal or less than X, the incoming particle is scattered back. The exclusion parameter equal 100% corresponds to the model with particles represented by hard spheres (in all instances, the adsorbing particle falling onto the adsorbed one is scattered back). The exclusion parameter equal to 0% corresponds to the completely inelastic scattering. One may assume that for real particles, values of the exclusion parameter will be between these extremes. After having attempted the adsorption of a small particle, regardless whether it was successful or not, the computer proceeds to the second step, an attempt to adsorb a large particle.
- • (ii) Attempt to adsorb a large particle. An attempt to adsorb a large particle is performed in the similar way as the above-described attempt to adsorb a small one.
- • (iii) Diffusion of adsorbed particles on the surface. Subsequently, for each adsorbed particle (small and large) the computer decides (with probability PD(1) and PD(2) for diffusion of small and large particles, respectively) whether the particle will be moved on the surface or will stay at its actual position. If, for a given particle, this decision is positive, the computer randomly selects the direction of the jump. The length of the jump is selected randomly in the range from 0 to λ(1) and/or λ(2) for small and large particles, respectively. If the way to the new position is free (i.e., if adsorbed particles do not interfere with the movement), the particle is located in the new place. Otherwise, it is moved in the selected direction to the place at which it contacts the first interfering particle.
- • (iv) Desorption. For each adsorbed particle, subsequently, the computer decides (with probability Pd(1) and Pd(2) for small and large particles, respectively) whether the particle will be desorbed from the surface.
After completion of the fourth step, the computer repeats the cycle. After a predetermined number of cycles, the data with information on positions of all adsorbed particles are saved. These data are used later for the calculation of such parameters, as surface coverage and surface concentration of small and large particles at a given time moment (using one cycle as the time unit).
3 Results and discussion
In a set of computer experiments that will be discussed below, the relative fractions of small and large particles (denoted as particles of type 1 and 2, respectively) have been varied. All other input parameters were not altered. The total concentration of particles in bulk was equal to 10 (in arbitrary concentration units) and did not change with time. A set of experiments was carried on with fraction of small particles (f1) varied from 10 to 90%. The ratio of particle radii was 0.5 (R(1) = 15 and R(2) = 30 arbitrary units). Rate constant of desorption for small particles (1) was k′d(1)=0.000 133 and for large particles k′d(2)=0.000 033. Rate constants for adsorption of both types of particles were equal k′a(1)=k′a(2)=1.
In real systems, the values of desorption rate constants may vary, depending not only on particle diameters, but also on their chemical structure, determining particle–surface interactions. In the computer experiments discussed in this paper, the rate constants of desorption have been chosen arbitrary, assuming only that the probability of desorption for large microspheres is lower than for the small ones. The probability of lateral movement for both kinds of particles was assumed to be the same and equals 0.5; however, the maximal length of a jump was two times larger for small particles than for the large ones (λ(1)/λ(2) = 2). The exclusion parameter used for the calculation of the probability that the adsorbing particle falling onto the adsorbed one eventually will reach the surface was 1%. It has to be stressed that, according to our previous studies for X < 40%, the degree of coverage depends very weakly on X [8].
Assemblies of deposited particles were characterized by surface concentrations of each type of adsorbed particles and by the relevant surface coverage. Examples of the dependence of surface coverage on time (expressed as a number of cycles) for systems with 10% and 90% of small particles in the bulk are shown in Fig. 3 .
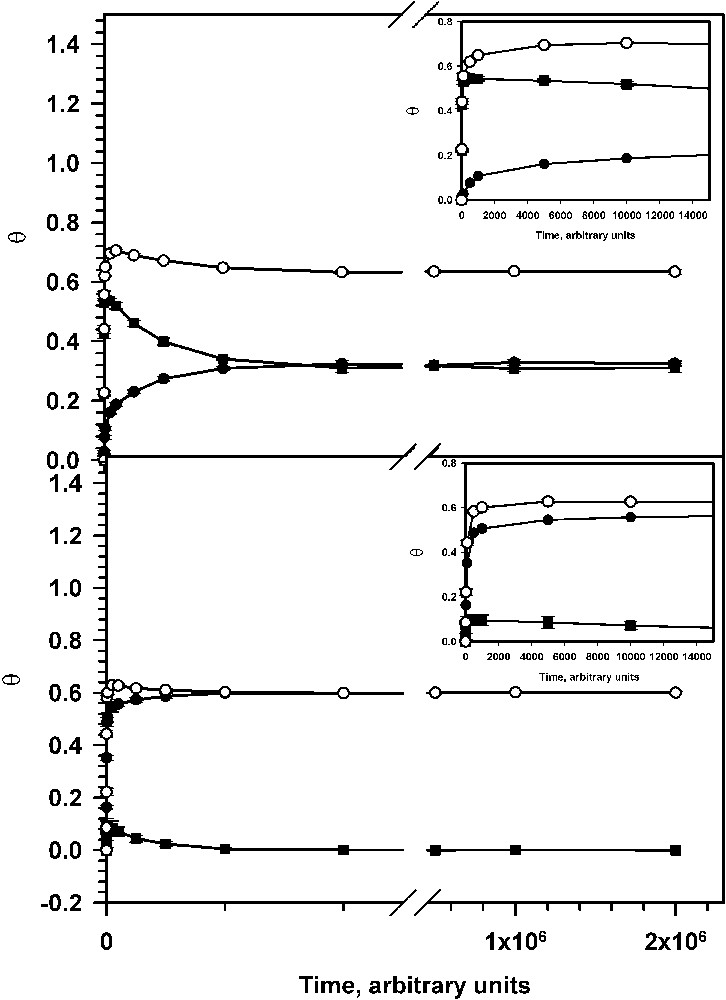
Dependence of surface coverage on time: (top) f1 = 0.1; (bottom) f1 = 0.9. Inserts illustrate the short-time behaviour.
Plots in this figure show a very rapid increase of the surface coverage with large particles. However, after passing a maximum, the surface coverage with large particles slowly decreases to equilibrium. The decrease of the surface coverage with large particles is accompanied with an increase of the surface coverage with small particles. It is worth noting that the total coverage (the sum of the coverage with large and small particles) approaches an equilibrium value much earlier than the partial equilibria are established. Similar behaviour (replacement of the large particles with the small ones) has been noticed recently for the system with reversible adsorption, without diffusion of particles on the surface and without assumption of ballistic particle deposition [12]. However, in our studies, we noticed a higher equilibrium surface coverage, which was reported in the above-mentioned paper. Such difference is not unexpected, since it has been shown that ballistic deposition of microspheres and their lateral diffusion allow for denser packing of particles and thus for a surface coverage higher than 0.547 (the value corresponding jamming limit for the RSA model) [8,14].
The whole process of particle deposition could be divided into two parts (cf. Fig. 3). The first one is the stage during which the total surface coverage approaches values differing by less than ca 5% from the corresponding equilibrium coverage. During the second stage, the total coverage almost does not change and the final, complete equilibrium is established mainly by replacement of large particles with the small ones. Because during the second stage the changes of the total coverage are very slow, it is reasonable to assume that at any moment the distribution of adsorbed particles onto the surface is also close to the equilibrium distribution and the area excluded form adsorption (due to interference of adsorbed particles) does not depend directly on time (∂Ψ/∂t = 0). Thus, for the second stage, one can write the equation (derived from equation (3)):
| (6) |
High adsorption rate constants and very slow desorption ones induce a very high surface coverage during the second stage of particle adsorption. A particle incoming from bulk can be adsorbed only when in the preceding moment some other have been desorbed, making sufficiently large free space. Adsorption of a large particle requires either preceding desorption of a needed number of small particles from the area with appropriate size or desorption of a large particle. Thus, during the second stage of the deposition process, the probability of formation of cavities for incoming large particle would be proportional to:
| (7) |
In expression (7), n is a number of small particles that must be desorbed from a given area to make space for adsorption of the large one and αn is a coefficient. The coefficient αn is equal to the ratio of the area liberated by desorption of n adjacent small particles and the area liberated by desorption of one large particle.
Computer experiments did show that for the systems with low desorption rate constants and low concentration of small particles in the bulk, at the beginning of the second stage, the surface concentration of small particles is lower than the surface concentration of the large particles. Therefore, at this moment the second term in equation (7) is much smaller than the first one. With time, the first term decreases (N2 decreases) and the second one approaches a constant (N1 increases and approaches the equilibrium value). In computer experiments with high fraction of small particles in bulk, we noticed that at the beginning of the second stage, the surface concentration of small particles is close to the corresponding equilibrium value (cf. Fig. 3).
Thus, at the second stage of particle deposition, for the systems with rate constants of desorption much lower than the rate constants of adsorption, the probability of forming cavities for adsorption of large particles could be approximated as follows:
| (8) |
Therefore, the expression for the surface fraction available for adsorption of large particles could be written as:
| (9) |
Substitution of expression (9) into equation (6) leads to the following kinetic equation for the surface concentration of large particles (equation (10)):
| (10) |
The solution of this equation is given below:
| (11) |
In equation (11), t = 0 is assigned to the beginning of the second stage, N2,s denotes the surface concentration of large particles at this moment and N2,e is the corresponding equilibrium surface concentration.
After rearrangement of equation (11), we could write:
| (12) |
| (13) |
Because during the second stage of particle deposition the total surface coverage is very close to its equilibrium value, we did assume that the number of adsorbed small particles replacing the large one that has been desorbed is constant; the following equation holds:
| (14) |
Substitution of N2 from equation (11) into (14) and resolution of the obtained equation yields:
| (15) |
Rearrangement of expression (15) gives:
| (16) |
With purpose to verify applicability of the discussed above approximations we used values of surface concentrations of adsorbed particles obtained from computer experiments as input data for the simple analytical approximate expressions (12), (13) and (16). By using these expressions it is possible to evaluate the desorption rate constant for large particles and compare this value with the ‘true’ value used in computer experiment. Examples of plots of the left-hand sides of equations (12) and (16) as a function of time are shown in Fig. 4 .
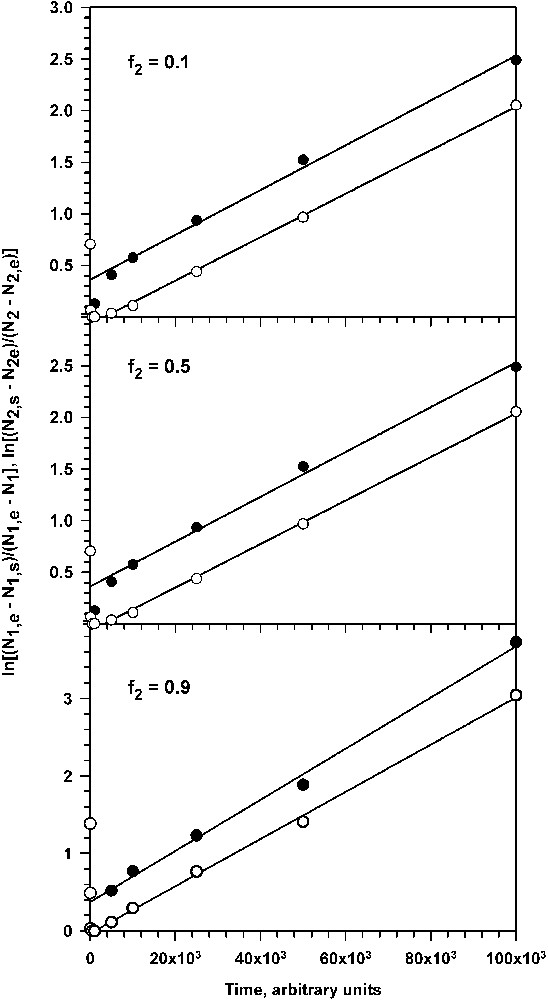
Kinetic plots for the second stage of particle deposition: (top) f2 = 0.1 (k = 3.05 × 10⁻⁵); (middle) f2 = 0.5 (k = 2.52 × 10⁻⁵), (bottom) f2 = 0.9 (k = 2.11 × 10⁻⁵). Values of k were determined from slopes of the straight-line segment of kinetic plots.
Plots in Fig. 4 reveal that indeed at the second stage of particle deposition the kinetic equations (12) and (16) describe quite well the changes in composition of adsorbed monolayer. At long time plots could be approximated with straight lines that are nearly parallel for small and large particles. Slopes of these plots equal to the rate parameter k (cf. formulae (12) and (13)) were slightly different for different fractions of small and large particles in bulk (f1, f2).
Fig. 5 shows the dependence of the rate parameter k on the fraction of large particles (f2). Straight line fitted to the points has a negative slope, as required by equation (13). Intercept of this line on the ordinate was 3.38 × 10⁻⁵, whereas value of the desorption rate constant used for computer simulations was 3.33 × 10⁻⁵.
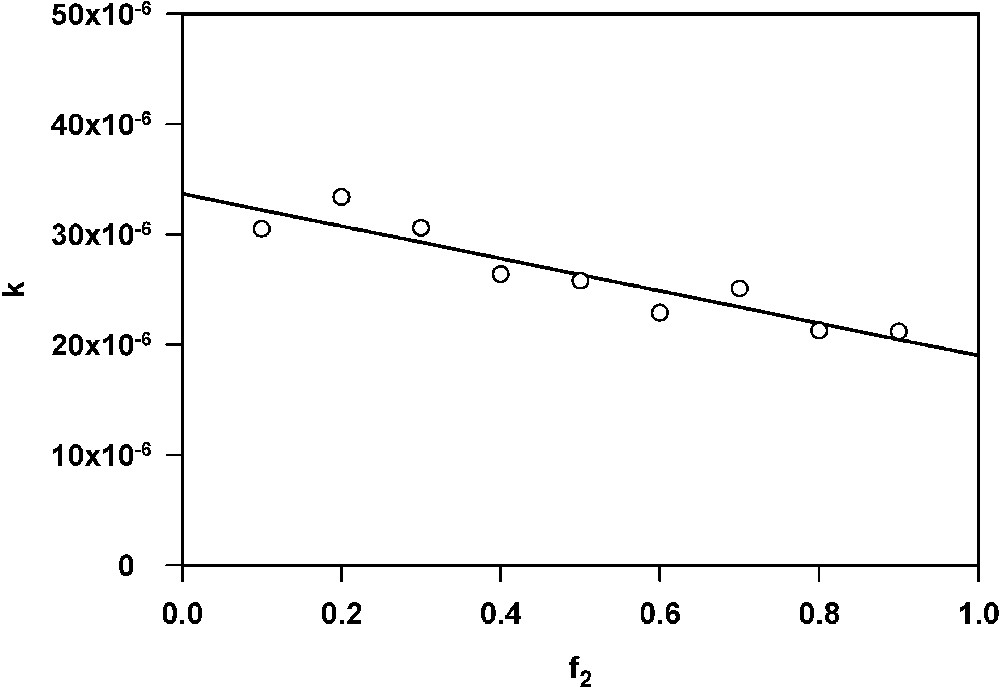
Dependence of k on f2. Intercept on the ordinate equals 3.38 × 10⁻⁵.
Computer experiments described above were performed for k′a(1)/k′d(1)=7.5⋅103 and k′a(2)/k′d(1)=3.0⋅104; however, we found a good agreement between the desorption rate constants used for simulations and determined using equations (12), (13) and (16) for all systems with ratios of k′a(1)/k′d(1) and k′a(2)/k′d(1) exceeding 1000.
Computer experiments were used also for the determination of the value of the ε parameter (ε = dN2/dN1, cf. equation (14)). Obtained data indicated that ε could be approximated with the ratio of projected surfaces of the large and small particles (π r22/π r12). For the ratio of the large and small particle diameters equal to 2, we found ε = 3.89 ± 0.06 (for r22/r12 = 4).
Analyses of computer simulation data indicated that in the real systems, the derived equations could be useful for determination of the rate constant of desorption of large particles on the basis of analysis of changes of surface concentrations of adsorbed particles.
Acknowledgements
This work was supported by Polish Committee for Scientific Research Grant No. 7 T09A 05820.
Vous devez vous connecter pour continuer.
S'authentifier