

1 Introduction
Research on the formation and scission of carbon–sulfur bonds is important for the petrochemical industry in the field of vulcanization and for the elucidation of materials that play indispensable roles in the origin of life and living organisms. Dinuclear molybdenum complexes have been reported to catalyze the formation and scission of carbon–sulfur bonds [1].
Incomplete cubane-type molybdenum and tungsten clusters are also targets of research relative to the formation and scission of carbon–sulfur bonds. The sulfur-bridged aqua cluster [Mo3(μ3-S)(μ-S)3(H2O)9]4+ reacts with acetylene to give the adduct [Mo3(μ3-S)(μ-S)(μ3-SCH=CHS)(H2O)9]4+. In addition, the reaction of tungsten clusters having W3(μ3-S)(μ-X)(μ-S)2 cores (X = O, S) with acetylene and its derivatives has also been reported (Scheme 1) [2–4]. Every adduct formation resulted in a large electronic spectral transformation, which indicates a large change in the electronic state of the M3(μ3-S)(μ-X)(μ-S)2 (M = Mo, W; X = O, S) core. These results indicate that the reactivity of the clusters towards acetylene or its derivatives varies considerably with changes in metals, bridging atoms, and/or ligands.
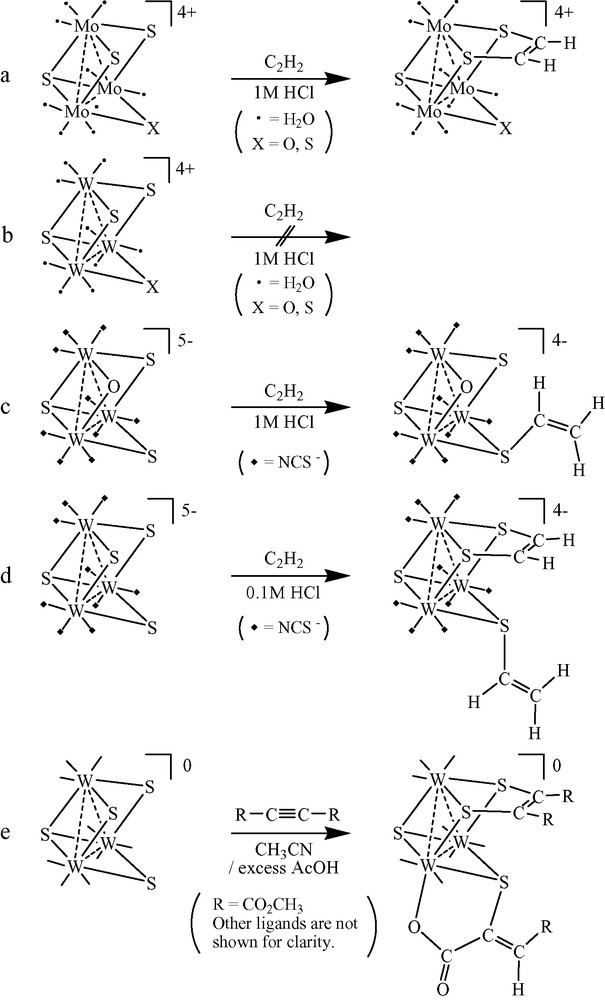
Reaction of sulfur-bridged clusters with acetylene. (a) [Mo3(μ3-S)(μ-X)(μ-S)2(H2O)9]4+ (X = O, S) (b) [W3(μ3-S)(μ-X)(μ-S)2(H2O)9]4+ (X = O, S) (c) [W3(μ3-S)(μ-O)(μ-S)2(NCS)9]5–, (d) [W3(μ3-S)(μ-S)3(NCS)9]5–, and (e) W3(μ3-S)(μ-S)3(dtp)3(μ-OAc)(CH3CN)].
The nitrilotriacetato molybdenum cluster, [Mo3(μ3-S)(μ-S)3(Hnta)3]2– (1), is stable in the pH 2–11 region, and three consecutive one-electron reduction processes of 1 have been reported together with a one-electron reduced mixed-valence cluster [5]. As for the aqua cluster [Mo3(μ3-S)(μ-S)3(H2O)9]4+, the hydrogen evolution prevented the measurement of the reduction potentials. We report here on the synthesis and characterization of adducts of acetylene and acetylenedicarboxylic acid (ADA) at sulfurs in the sulfur-bridged incomplete cubane-type molybdenum 1 in water. This is, to our knowledge, the first report on the electrochemistry of acetylene (or its derivatives) adducts of trinuclear clusters.
2 Experimental
2.1 Materials and reagents
All the chemicals were obtained from commercial sources and used as received. Cluster 1 was prepared according to the literature [6].
2.2 Synthesis
2.2.1 Synthesis of K2[Mo3(μ3-S)(μ-S)(μ3-SCH=CHS)(Hnta)3]·KCl·8 H2O (2′)
Raising the pH of a slurry of K2[Mo3(μ3-S)(μ-S)3(Hnta)3]·9 H2O (1′) (199.6 mg, 0.163 mmol) in water (5 ml) to ca. 7 by the addition of 4 M KOH turned the slurry into a solution. Acetylene was passed through the resultant solution for 10 min, which caused the solution to change from green to deep green. The pH of the solution was adjusted to 1.2 by the addition of 2 M HCl. The addition of KCl (74.6 mg, 1.0 mmol) and the filtration of the solution were followed by passing acetylene for another 10 min, and the solution was sealed. Storage of the solution in a refrigerator at 2 °C overnight resulted in green needle-like crystals of 2′ with a yield of 85.8 mg (40.3%). Anal. Found (Calc. for Mo3S4K3ClO26N3C20H39)%: C, 18.43 (18.39); H, 2.89 (3.01); N, 3.18 (3.22).
2.2.2 Synthesis of K[Mo3(μ3-S)(μ-SC(COOH)=CH(COOH))(μ3-SC(COOH)=C(COOH)S)(Hnta)3]·8 H2O (3′)
The same procedures that were used in the synthesis of 2′ were followed up to the addition of a small amount of 4 M KOH to the slurry of 1′ (50 mg, 40 μmol) in water (5 ml) to give a pH 7 solution. The addition of ADA (5.56 mg, 49 μmol) with stirring caused the solution to change from deep green to greenish brown. The pH of the solution was adjusted to 1.2 by the addition of 2 M HCl. Storage of the solution in a refrigerator at 2 °C overnight resulted in brown needle-like crystals of 3′ with a yield of 76.26 mg (46.38%). Anal. Found (Calc. for Mo3S4KO32N3C26H45)%: C, 22.30 (22.37); H, 3.28 (3.03); N, 3.20 (3.01).
2.3 Measurements of electronic spectra
Electronic spectra were measured using a Hitachi U-2000 double-beam spectrometer in a 10-mm quart cell sealed with Septa® rubber at room temperature in the 340–1100-nm region.
2.3.1 Reaction of 1′ with acetylene
The electronic spectrum of 1′ (5.0 mg, 4.0 μmol) in water (5 ml) was measured, and acetylene gas was passed through the solution for 5 min. The color of the solution changed from green to deep green. The electronic spectrum of the resultant solution was measured immediately.
2.3.2 Reaction of 1′ with ADA at pH 1.2
The electronic spectrum of 1′ (5.4 mg, 4.1 μmol) in water (5 ml) was measured, and ADA (1.20 mg, 10.5 μmol) was added to the solution. An immediate color change of the solution was observed from green to deep green. Two- and one-half hours after the addition of ADA, the absorption at 853 nm reached its maximum, and the pH was measured (pH 2.6). The pH of the solution was then adjusted to 1.2, and the electronic spectrum of the resultant solution was measured immediately and 6, 12, 18.5, 24.5, 30.5, 36.5, 42.4 and 65.5 h after pH adjustment to 1.2. The color of the resultant solution turned gradually from deep green to greenish brown.
2.3.3 Reaction of 1′ with ADA at pH 9
The reaction of 1′ with ADA was followed as described in Section 2.2.2, except that the pH of the reaction mixture was adjusted to nine just after the addition of ADA to the solution of 1′. The spectra of the solution were measured intermittently.
2.4 Measurements of 1H NMR spectra and electrochemistry
1H NMR spectra of samples in D2O were obtained at 20 °C with a Bruker ARX-400R spectrometer. 3-(Trimethylsilyl)-1-propanesulfonic acid, sodium salt (DSS) = 0.0 ppm. Cyclic voltammetry of the molybdenum clusters was performed either in a phthalic solution (0.5 mM, pH 4.1) or in a phosphate solution (0.5 mM, pH 7.0) with a BAS 100W electrochemical analyzer. The working electrode was a glassy carbon disc (φ = 3.0 mm). The reference and counter electrodes were Ag/AgCl (3 M NaCl) and a platinum wire, respectively. Supporting electrolyte was Na2SO4 (0.1 M). All the solutions were deoxygenated with a stream of argon prior to each run.
2.5 Structural determination of K2[Mo3(μ3-S)(μ-S)(μ3-SCH=CHS)(Hnta)3]·KCl·8 H2O (2′)
X-ray diffraction data were collected with a Rigaku CCD diffractometer and analyzed using the teXsan system. A single crystal of 2′ was mounted on the tip of a glass fiber and cooled to –160 °C. The dimensions were 0.20 × 0.10 × 0.01 mm. The structure was solved by the direct (SIR92) [7] and Patterson methods (DIRDIF94) [8], and all the remaining non-hydrogen atoms were located from difference maps. All hydrogen atoms were assigned to idealized positions (C–H 1.09 Å, HC=CH 1.08 Å) with thermal parameters that were 1.2 times the thermal parameters of the carbon atoms to which each was attached. All the calculations were performed using the teXsan crystallographic software package [9].
The crystal data and structure refinement parameters are listed in Table 1. All pertinent crystallographic information for the cluster, including bond distances and angles, atomic coordinates, and equivalent isotropic displacement parameters, is provided in the Supporting Information.
Crystallographic data for K2[Mo3(μ-S)(μ3-S)(μ3-SCH=CHS)(Hnta)3]·KCl·8 H2O (2′)
| Compound | 2′ |
| Formula | Mo3K3ClS4O26N3C20H39 |
| Formula weight | 1306.34 |
| Crystal color, habit | Green, plate |
| Crystal dimensions (mm) | 0.20 × 0.10 × 0.01 |
| Crystal system | Monoclinic |
| Space group | C2/c (No.15) |
| a (Å) | 22.953(3) |
| b (Å) | 21.044(2) |
| c (Å) | 18.542(2) |
| β (°) | 114.962(3) |
| V (Å3) | 8119(1) |
| Z | 8 |
| Diffractometer | Rigaku/MSC mercury CCD |
| R1a | 0.089 |
| R, Rwb | 0.156 (0.254) |
| Goodness of fit indicatorc | 1.03 |
| Dcalc (g/cm3) | 2.137 |
| μ (cm–1) | 15.86 |
| No. of measured reflections | 42858 |
| No. of unique reflections | 9102 |
| (Rint = 0.087) | |
| No. of observed reflections | 9102 (all data) |
| No. of variables | 541 |
| Data: parameter ratio | 16.82 |
| Temperature (°C) | –180.0 |
a R1 = Σ||Fo| – |Fc||/Σ|Fo| for I > 2σ(I).
b R = Σ(Fo2 – Fc2)/ΣFo2, Rw(Fo2) = [Σw(Fo2 – Fc2)2/Σw(Fo2)2]1/2 where w = σc2(Fo2)–1 = [σc2(Fo2) + (p(Max(Fo2, 0) + 2Fc2)/3)2]–1, P = 0.090.
c Goodness of fit indicator = [Σw(Fo2 – Fc2)2/(Nobservations – Nvariables)]1/2.
3 Results and discussion
3.1 Synthesis of clusters 2′ and 3′
Hnta clusters 1′, 2′, and 3′ are difficult to dissolve in acidic water but not in neutral water because of the dissociation of some of the three –COOH groups in each cluster. At strong acidity, e.g. 1 M HCl, a dissociation of Hnta ligands occurs. Accordingly, for the synthesis of 2′ and 3′, we first raised the pH to ca. 7 with KOH to dissolve 1′, adjusted the pH to 1.2 with HCl after the adduct formation, and attained moderate yields for both clusters. Without the addition of KCl, the yield of 2′ was lower (ca. 14%). The formation of the double salt, 2′, from K2[Mo3(μ3-S)(μ-S)(μ3-SCH=CHS)(Hnta)3] (K22) and KCl probably reduced the solubility of K22.
3.2 Electronic spectral change on the formation of clusters 2 and 3
The spectral change on passing acetylene through the solution of 1 indicated the formation of 2, which had a large peak in the near infrared region, as shown in Fig. 1 (λmax/nm, ε/M–1cm–1), 458sh (974), 654 (764), 890 (1889)). The resultant spectrum changed very slightly in the air. The spectral change was more complicated when the reaction of 1 with ADA proceeded to give 3. The absorption peak at 853 nm of the reaction mixture (pH 2.6) increased gradually for two- and one-half hours, and then the spectral change became small. Addition of hydrochloric acid, however, to adjust pH to 1.2 resulted in a large spectral change, and, finally, the spectrum approached that of 3, with the peak at 853 nm gradually disappearing. The spectral change is shown in Fig. 2. The reaction of 1 with ADA at pH 9 was much slower. The absorption peak at 853 nm reached its maximum 11 h after the mixing, and the peak height remained unchanged. If acid is added at this point, the peak height starts to decrease, indicating the formation of 3. When dissociation constants of ADA (pKa1 = 1.74, pKa2 = 4.38) are taken into consideration, the reactivity of dissociated ADA toward the μ-S of 1 is lower than that of the undissociated species.

Electronic spectra of 1′ (---) and 2′ (——).
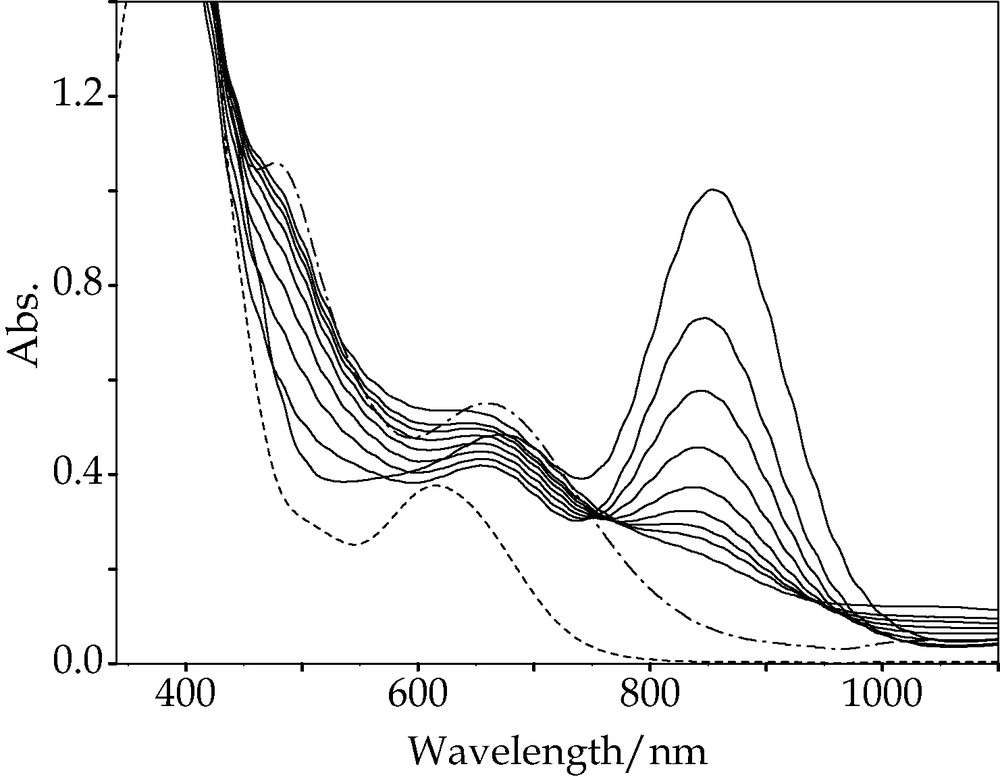
Electronic spectral changes in reaction of 1 with ADA immediately and 6, 12, 18.5, 24.5, 30.5, 36.5, 42.4 and 65.5 h after pH adjustment to 1.2. 1′ (---), 3′ (–·–).
3.3 X-ray structure of 2′
The X-ray structural analysis of 2′ clearly revealed the formation of the two carbon–sulfur bonds, as shown in Fig. 3. The interatomic distances and angles are listed in Tables 2 and 3, respectively. Some of the dimensions of the cluster anion are clearly different from those of 1 in Na2[Mo3S4(Hnta)3]·5H2O (1″) [10].
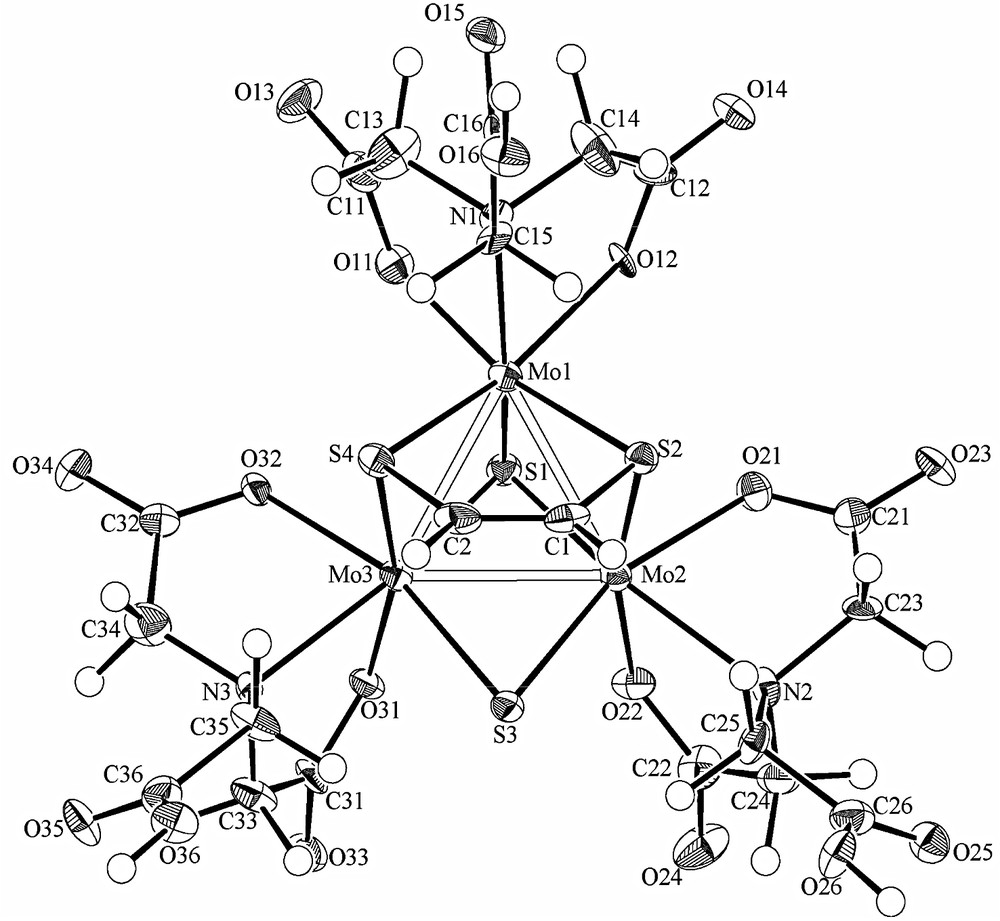
ORTEP drawing of the anion of 2′.
Bond lengths in K2[Mo3(μ-S)(μ3-S)(μ3-SCH=CHS)(Hnta)3]·KCl·8H2O (2′)
| Atom | Atom | Length (Å) | Atom | Atom | Length (Å) |
| Mo1 | Mo2 | 2.763(1) | Mo1 | Mo3 | 2.749(1) |
| Mo2 | Mo3 | 2.667(1) | Mo1 | S1 | 2.317(3) |
| Mo1 | S2 | 2.376(3) | Mo1 | S4 | 2.359(3) |
| Mo2 | S1 | 2.341(3) | Mo2 | S2 | 2.444(3) |
| Mo2 | S3 | 2.319(3) | Mo3 | S1 | 2.347(3) |
| Mo3 | S3 | 2.317(3) | Mo3 | S4 | 2.424(3) |
| Mo1 | O11 | 2.124(7) | Mo1 | O12 | 2.133(7) |
| Mo2 | O21 | 2.118(7) | Mo2 | O22 | 2.092(8) |
| Mo3 | O31 | 2.111(7) | Mo3 | O32 | 2.120(7) |
| Mo1 | N1 | 2.344(9) | Mo2 | N2 | 2.333(8) |
| Mo3 | N3 | 2.327(8) | S2 | C1 | 1.80(1) |
| S4 | C2 | 1.81(1) | O11 | C11 | 1.28(1) |
| O13 | C11 | 1.25(1) | O12 | C12 | 1.29(1) |
| O14 | C12 | 1.23(1) | O15 | C16 | 1.22(1) |
| O16 | C16 | 1.33(1) | O21 | C21 | 1.30(1) |
| O23 | C21 | 1.23(1) | O22 | C22 | 1.28(1) |
| O24 | C22 | 1.25(1) | O25 | C26 | 1.21(1) |
| O26 | C26 | 1.34(1) | O31 | C31 | 1.29(1) |
| O33 | C31 | 1.22(1) | O32 | C32 | 1.28(1) |
| O34 | C32 | 1.25(1) | O35 | C36 | 1.24(1) |
| O36 | C36 | 1.27(1) | N1 | C13 | 1.50(1) |
| N1 | C14 | 1.47(1) | N1 | C15 | 1.50(1) |
| N2 | C23 | 1.50(1) | N2 | C24 | 1.50(1) |
| N2 | C25 | 1.50(1) | N3 | C33 | 1.52(1) |
| N3 | C34 | 1.46(1) | N3 | C35 | 1.52(1) |
| C1 | C2 | 1.33(2) | C11 | C13 | 1.52(2) |
| C12 | C14 | 1.52(2) | C15 | C16 | 1.50(1) |
| C21 | C23 | 1.49(2) | C22 | C24 | 1.50(2) |
| C25 | C26 | 1.54(1) | C31 | C33 | 1.52(2) |
| C32 | C34 | 1.51(2) | C35 | C36 | 1.53(2) |
Bond angles (°) in K2[Mo3(μ-S)(μ3-S)(μ3-SCH=CHS)(Hnta)3]·KCl·8 H2O (2′)
| Atom | Atom | Atom | Angle (°) | Atom | Atom | Atom | Angle (°) |
| Mo2 | Mo1 | Mo3 | 57.87(3) | Mo1 | Mo2 | Mo3 | 60.79(3) |
| Mo1 | Mo3 | Mo2 | 61.33(3) | S1 | Mo1 | S2 | 109.36(9) |
| S1 | Mo1 | S4 | 109.77(10) | S2 | Mo1 | S4 | 85.74(9) |
| S1 | Mo2 | S2 | 106.30(9) | S1 | Mo2 | S3 | 109.06(10) |
| S2 | Mo2 | S3 | 92.80(10) | S1 | Mo3 | S3 | 108.92(9) |
| S1 | Mo3 | S4 | 106.58(9) | S3 | Mo3 | S4 | 92.37(10) |
| Mo1 | S1 | Mo2 | 72.78(8) | Mo1 | S1 | Mo3 | 72.23(8) |
| Mo2 | S1 | Mo3 | 69.35(8) | Mo1 | S2 | Mo2 | 69.93(7) |
| Mo2 | S3 | Mo3 | 70.22(8) | Mo1 | S4 | Mo3 | 70.15(8) |
| Mo1 | S2 | C1 | 105.2(4) | Mo1 | S4 | C2 | 104.9(4) |
| Mo2 | S2 | C1 | 110.0(4) | Mo3 | S4 | C2 | 110.8(4) |
| S2 | C1 | C2 | 121.4(9) | S4 | C2 | C1 | 122.1(9) |
| O11 | Mo1 | O12 | 81.3(3) | O11 | Mo1 | N1 | 76.1(3) |
| O12 | Mo1 | N1 | 75.9(3) | O21 | Mo2 | O22 | 83.8(3) |
| O21 | Mo2 | N2 | 74.9(3) | O22 | Mo2 | N2 | 77.7(3) |
| O31 | Mo3 | O32 | 82.6(3) | O31 | Mo3 | N3 | 76.4(3) |
| O32 | Mo3 | N3 | 76.6(3) |
Elongation of all six Mo-μ-S distances was observed on the adduct formation. The four Mo-μ-S′ distances (S′: at the bridging sulfur atoms the adduct formation occurred) are in the range of 2.359(3)–2.444(3) Å, and the two Mo-μ-S distances are in the range of 2.317(3)–2.319(3) Å, while the six Mo-μ-S distances of 1″ are in the range of 2.272(2)–2.309(2) Å. On the other hand, little change was observed in three Mo-μ3-S distances on the adduct formation: 2.317(3)–2.347(3) Å in 2′ and 2.330(2)–2.338(2) Å in 1″. The carbon–carbon distance (C1–C2, 1.33(2) Å) was closer to that of ethylene (1.339 Å) than to that of acetylene (1.203 Å), and the bond angles at about C1 and C2 are close to 120° (S2–C1–C2, 121.4(9)°; S2–C2–C1, 122.1(9)°). The C–S bonds (C1–S2, 1.80(1) Å; C2–S4, 1.81(1) Å) are close to those in the aqua cluster [Mo3(μ3-S)(μ-O)(μ3-SCH=CHS)(H2O)9]4+ [2].
3.4 1H NMR spectra of clusters 2′ and 3′
1H NMR spectra of 2′ and 3′ in D2O are shown in Fig. 4. The signal of 2′ at 6.28 (2H, s) ppm is assignable to the μ3-SCH=CHS moiety. The very weak signal of 2′ at 2.30 (s) ppm is assignable to free acetylene. The dissociation of acetylene is also perceived through the slow decrease of the peak at 890 nm in the electronic spectrum of 2′.
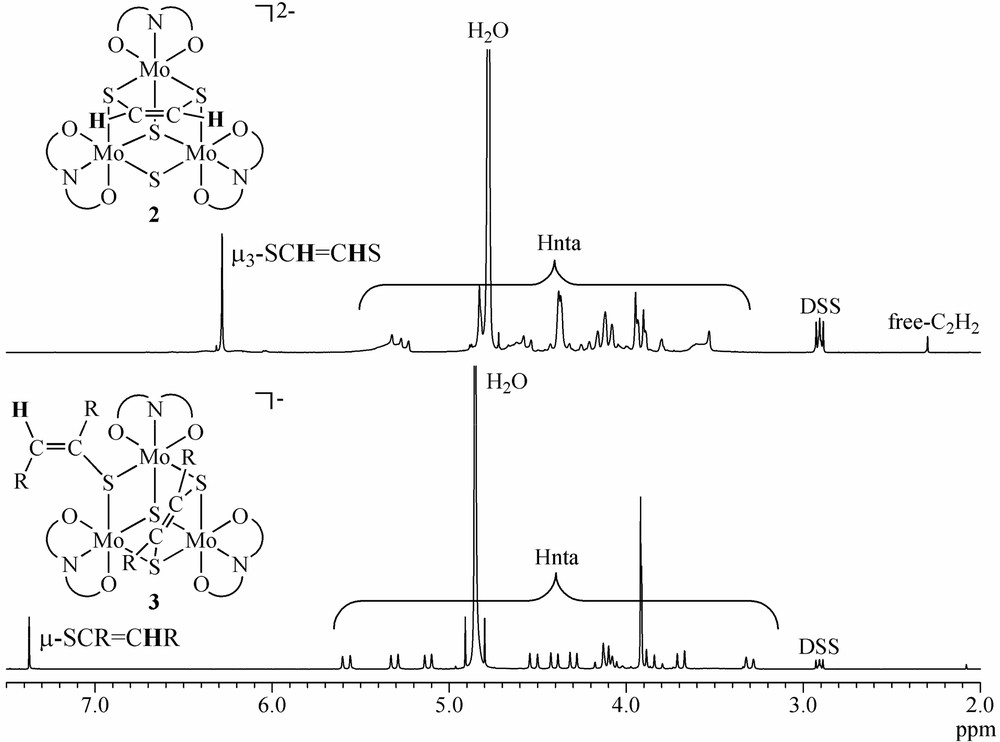
1H NMR spectra of 2′ and 3′ (D2O, 25 °C, 400 MHz).
The signal of 3′ at 7.37 (1H, s) ppm is assignable to the μ-SCR=CRH moiety, which confirms the proton addition (see formation mechanism). The conformation of the moiety in 3′, which is depicted in the inserted structure, was suggested by that of [W3(μ3-S)(μ3-SCR=CRS)(μ-SCR=CRH)(NCS)9]4– [4]. The signals in the 3.0–6.0 region are due to methylenic protons of Hnta’s of 2′ and 3′.
3.5 Mechanism for the formation of cluster 3
We propose the following reaction mechanism for the formation of 3, as shown in Scheme 2. The reaction of 1 with ADA gives 1a having two C–S bonds and shows an absorption peak at 853 nm. Lowering the pH causes the scission of one of the C–S bonds to give 1b, and the addition of another ADA to 1b gives the final product 3. This mechanism is similar to that for the formation of the acetylene adduct of the tungsten cluster, [W3(μ3-S)(μ3-SCH=CHS)(μ-SCH=CH2)(NCS)9]4–, obtained from the reaction of [W3(μ3-S)(μ-S)3(NCS)9]5– with acetylene via two intermediates, [W3(μ3-S)(μ-S)(μ3-SCH=CHS)(NCS)9]5– having two C–S bonds and [W3(μ3-S)(μ-S)2(μ-SCH=CH2)(NCS)9]4– having one C–S bond [4]. The C–S bonds in [Mo3(μ3-S)(μ3-SCH=CHS)(μ-X)(H2O)9]4+ (X = O, S) formed by the reaction of molybdenum aqua clusters [Mo3(μ3-S)(μ-X)(μ-S)3(H2O)9]4+ (X = O, S) resist the attack of the H+: exchanges of the aqua ligands for Hnta ones and the acetylene for ADA seem to make the C–S bonds more sensitive to H+. We were unable to isolate 1a as a solid sample.
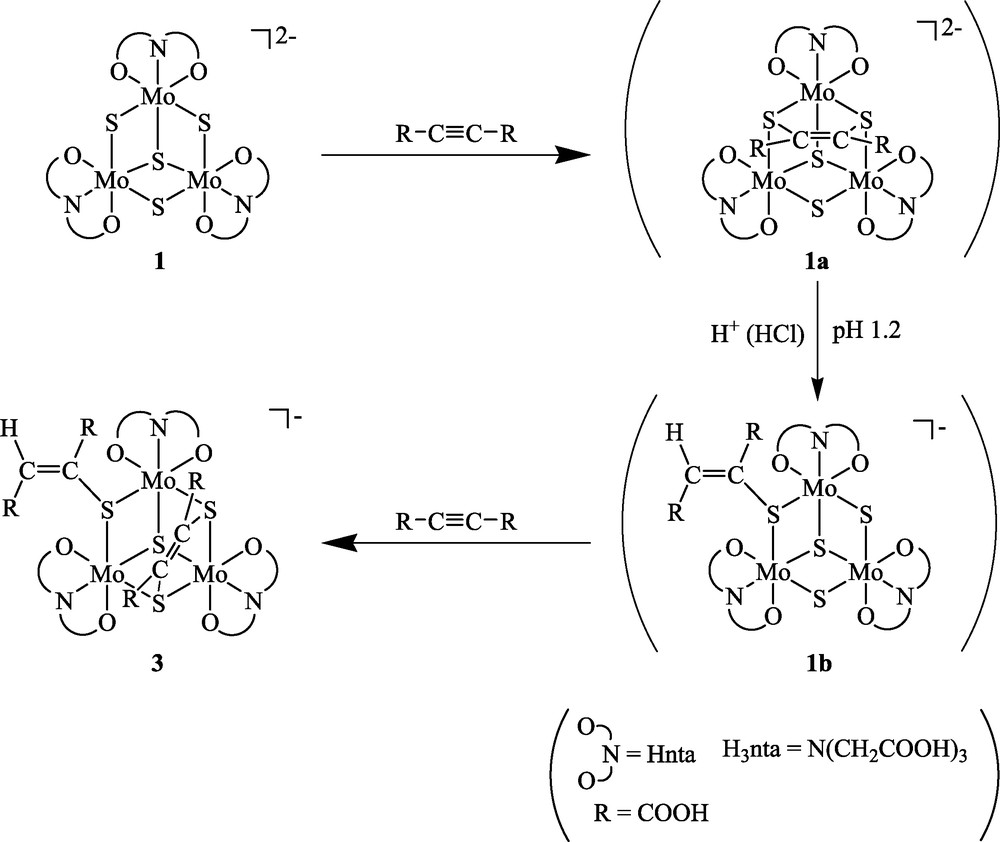
Reaction mechanism of 1 with ADA.
3.6 Electrochemistry of clusters 2 and 3
As shown in Fig. 5, a one-electron reduction (E1/2 = –0.68 V vs. Ag/AgCl) of 2 in a phthalate buffer solution at pH 4 was observed, and the potential was close to the first reduction potential of 1 [5]. The second and third reduction processes were not observed due to the hydrogen generation. Both reduction processes were assumed to undergo more negative potentials than those of 1. This suggests that an adduction of acetylene to 1 has little influence on the reduction potential. Further, cluster 2 showed a one-electron oxidation at E1/2 = +0.26 V, whereas no oxidation of 1 was observed. For the anodic process of 2, the ratios between the current of the reverse peak and that of the forward peak, ipr/ipf, were 0.66 (the dotted line) and 0.52 (the solid line) at the scan rate v = 100 mV s–1 and 0.95 at the scan rate v = 500 mV s–1. Therefore, the electro-generated 2+ is supposed to be unstable on the voltammetric timescale, and the anodic processes observed in the region greater than +0.5 V may be attributed to those of the oxidized products of the subsequent chemical reaction. In addition, the E1/2 values obtained from cyclic voltammograms of 2 in pH 4 (a phthalate buffer solution) and pH 7 (a phosphate buffer solution) were not different from each other, and no protons participated in these redox reactions. In addition, in the basic solutions (pH > 7), the solution changed from deep green to colorless in 6 h. As a result, cluster 2 was unstable, and it was difficult to measure more negative potential regions in the basic solutions to avoid the hydrogen evolution.
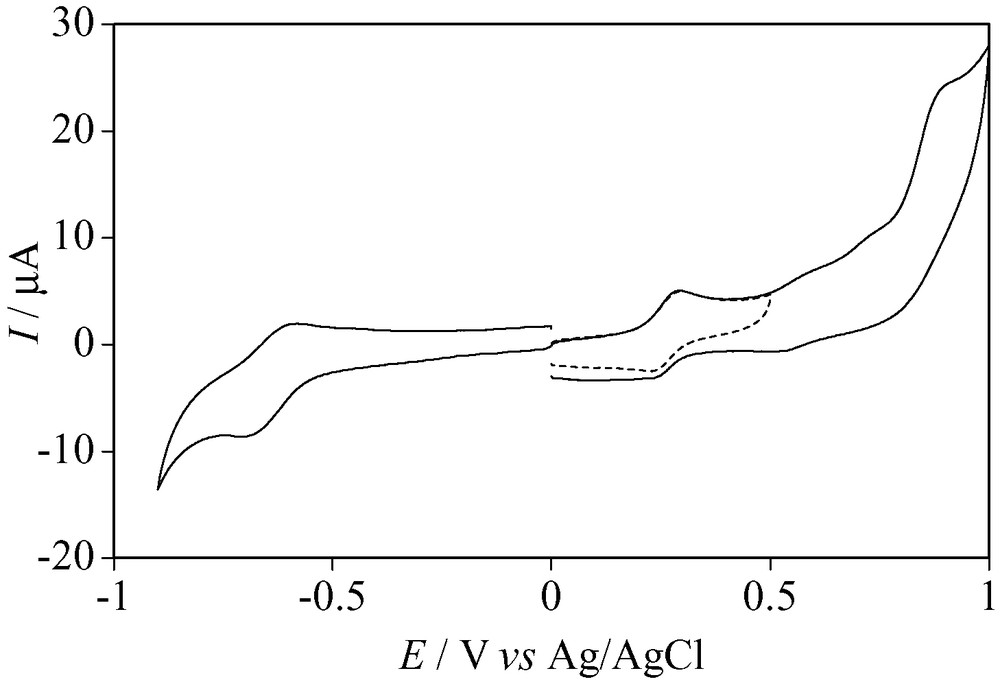
Cyclic voltammograms of 2′ at pH 4. Scan rate 100 mV s–1.
Switching potential: dotted line E = 0.50 V.
It has been reported that incomplete cubane-type sulfur-bridged trinuclear molybdenum and tungsten clusters [M3S4(Hnta)3]2– (M = Mo, W) containing only Hnta ligands have no anodic processes, while [Mo3S4(Cp′)3]+ [11] and [Mo3S4(CN)9]5– [12] containing 1-methyl cyclopentadienyl (Cp′) or CN– ligands show anodic processes at E1/2 = +1.22 V (+1.43 V) and + 0.25 V (+0.46 V vs. Fc/Fc+) vs. Ag/AgCl in aprotic media, respectively. Both ligands in these clusters have no redox active site, and the anodic processes are suggested to occur in the metal centers.
In the case of acetylene adduct 2, which has a partial dithiolene moiety, the anodic process is assumed to take place either in the ligand sites, as observed in dithiolene complexes [13], or in the metal center, with the oxidation number changing from Mo3(IV, IV, IV) to Mo3(IV, IV, V). Usually, an oxidation reaction of a dithiolene moiety in a complex proceeds via two consecutive one-electron oxidation processes from ene-1,2-dithiolate via 1,2-dithione monoanion to 1,2-dithione (Scheme 3): the two-electron oxidation product of complex [NiII(S2C2Me)2]2–, for instance, is [NiII (S2C2Me)2] with two ene-1,2-dithiolate ligands. The oxidation potentials between the complexes without redox active ligands vary according to the ligands. The oxidation potential of [Mo3S4(CN)9]5– is close to that of 2, and the reduction potential is 1.0 V more negative (E1/2 = –1.70 V vs. Ag/AgCl) than that of cluster 2. The difference in these redox potentials suggests that the electronic structure of [Mo3S4(CN)9]5– is quite different from that of 2. [Mo3S4(Cp′)3]+, whose reduction potential is close to that of 2 (E1/2 = –0.78 V vs. Ag/AgCl), is assumed to have a similar electronic structure and an oxidation potential that is more positive than that in cluster 2. These results suggest that the oxidation of 2 occurs not at the molybdenum center but, rather, at the dithiolene moiety. No redox reaction processes of 3 at pH 4 and 7 were observed from the cyclic voltammetry measurements. The broad curves observed suggest that cluster 3 may be easy to adsorb on the electrode surface.
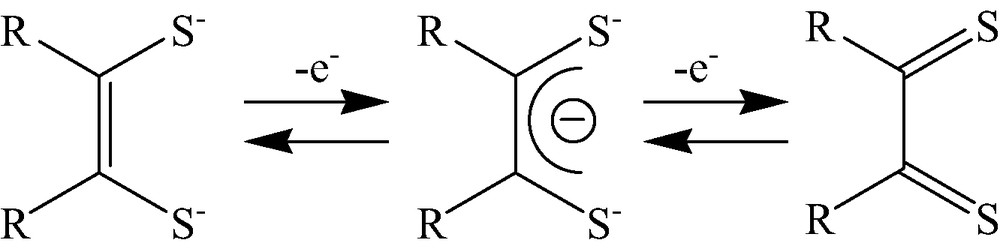
Redox sequence of 1,2-dithiolene, 1,2-dithiolene monoanion, ene-1,2-dithiolene.
4 Supplementary material
Crystallographic data of 2′ (CCDC No. 244413) and experimental details of the synthesis and characterization (NMR and UV/Vis) of 2′ and 3′.
Acknowledgments
This work was partly supported by a Grant-in-Aid for Scientific Research on Priority Areas (No. 14044110) ‘Exploitation of Multi-Element Cyclic Molecules’ and by a Special Grant for Cooperative Research administered by the Japan Private School Promotion Foundation. We thank the Research Instruments Center, Okayama University of Science, for permitting the use of instruments, and Ms. Rika Kyan for the preparative work.