

1 Introduction
Urea or perhydrotriphenylene (PHTP) based intergrowth inclusion compounds belong to the very interesting family of nanotubular composite materials [1]. For peculiar linear guest molecules, the urea builds a hexagonal array of linear parallel one-dimensional channels encapsulating the guest molecules. Hexagonal urea can host numerous molecules such as n-alkanes, dibromo-alkanes [2], dioctanoyl peroxide [3], mono or dicarboxylic acids [4] etc. An important property of urea based inclusion compounds lies in the reduced channel accessible diameter ~ 5–5.5 Å, which almost fits the guest molecule cross-sectional diameter (~4 Å for n-alkane), leading to an ultraconfinement perpendicular to the channel axis. The interest of such compounds concerns not only fundamental physics (incommensurate compounds, physical properties of low-dimensional and strongly correlated systems, polymer translocation through a membrane…), but also applications when the guest molecules are functionalized (non linear optical properties, 1D conductivity…) [5].
Most of these compounds are incommensurate along c, and strongly disordered. Therefore, although X-ray or coherent neutron diffraction give meaningful informations on the host organization or host–guest modulation, these techniques cannot in general quantify the guest organization in the (a,b) plane because all the information is spread in diffuse scattering which mixes both host and guest responses. In contrast, solid-state NMR is particularly suited to measure the guest orientation, because it can directly select the nucleus of interest by its Larmor frequency and chemical shift, giving a high selectivity not provided by X-ray scattering. Moreover, the high orientational sensitivity of the interactions probed by NMR, as well as its high versatility [6], make high resolution solid-state NMR a complementary powerful tool to X-ray or coherent neutron diffraction methods. In particular for organic compounds, deuterium 2H NMR directly probes the C–D bond orientation and dynamics through the dynamical averaging of the quadrupolar interaction carried by the covalent bond. Single crystal solid-state NMR also offers the unique opportunity to measure the intrinsic orientational disorder [7] from the information contained in spectra acquired at different magnetic field orientations.
Nonadecane/urea C19H40/CO(NH2)2 is a model compound for phase transitions in a superspace due to the incommensurability along the c axis. The urea host displays a structural instability at 153 K from a mean hexagonal to an orthorhombic mean structure. This transition should induce three symmetry-broken domains which are related by a threefold axis collinear to the channel c axis. In fact, high-resolution X-ray [8] or neutron scattering experiments [9] evidence six equiprobable domains, with a split angle ± δ with respect to the ideal C3 directions (Fig. 1). This splitting was interpreted as a way to minimize intergrowth domain walls energy cost [8]. From the host structure, it was proposed that the guests adopt a herringbone arrangement within each domain. Subsequently, the spectra obtained from single-crystal 2H NMR at different orientations were interpreted assuming a model of the superimposed contribution of six equiprobable orthorhombic domains with an herringbonelike arrangement of the n-alkane chains, and a Gaussian angular distribution within each domains [10]. In contrast to diffraction results, 2H NMR was able to measure the mean chain orientation with respect to the crystallographic axes, and the residual disorder. But the interpretation of the NMR results was still dependent on the picture of the low temperature phase generated by diffraction studies. However, the incommensurability of nonadecane/urea compounds renders the interpretation of the diffraction results highly controversial, and the data deserve a closer look to seek whether other guest orientational distribution could explain the observed spectra. Therefore, it is of importance to dispose of a method to reconstruct orientational distributions which requires the minimum structural knowledge about the compound under study. The interest of such a method for urea intergrowth compounds would be, as far as possible, to characterize the guest framework independently of any hypothesis concerning the precise host/guest structure.
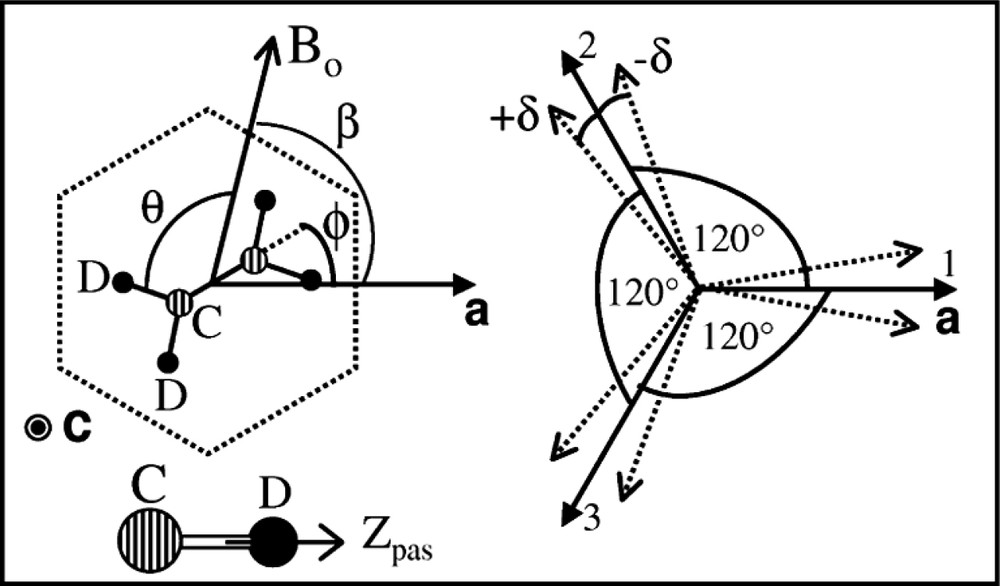
(Left) Schematic local mean structure (dotted line) of a single crystal of urea/alkane inclusion compounds in the (a,b) plane, and definition of some angles used in the text. The linear channels are all parallel to the main axis c. The sample is rotated with a goniometer probe around c with Bo ⊥ c. All the angles are measured with respect to the reference a cristallographic axis. For CD aliphatic bonds, quadrupolar asymmetry parameter is very close to zero (η ≈ 0) and the EFG principal axis zpas is along the C–D bond.(Right) Schematic relative orientation of the orthorhombic domains with respect to the reference a axis. When no domain splitting is present δ = 0, the domains are related by a threefold C3 axis (dark arrows). After splitting, the angles are n 2 π/3 ± δ (dotted arrows).
The object of this article is to propose a model-independent method, based on Tikhonov regularized inverse schemes with non negativity constraints, to reconstruct the alkane orientational intrinsic disorder distribution. In fact, the reconstruction of orientational probability densities is an ill-posed problem, whose result dramatically depends on the noise and imperfections, leading to strong numerical instabilities. The main idea of regularization consists in adding new constraints which restrict the ensemble of acceptable solutions [11]: for instance a large amount of regularization is already introduced by restricting the ensemble of solutions to positive functions, the only physically significant functions for probability densities. These numerical procedure were proved powerful and efficient in NMR [12–18].
We recently showed that these methods lead the orientational probability density of a rotationally disordered systems around a known axis from a set of single crystal 1D-spectra at different magnetic field orientations [19]. Therefore, once a reference axis of the mean host structure is known, the distribution of the alkane orientations with respect to this reference axis can in principle be reconstructed by performing single crystal NMR at different orientations. In this paper, this framework is further developed and applied to the selectively deuterated compound C19D40/urea-H4. After a presentation of the basic theory of 2H NMR and Inverse Method with regularization and positivity constraints, the sensitivity of the reconstruction procedure is tested with respect to the correlation between the unknown natural linewidth and the estimated angular intrinsic disorder. The orientational probability of the C–D bonds in the low temperature phase of nonadecane/urea at 90 K is then obtained by this model-independent procedure.
2 Theory
2.1 Deuterium NMR
A deuteron 2H (spin I = 1) has an electric quadrupole moment Q which interacts with the electric field gradient Vαβ = ∂Eα/∂xβ (EFG) at the nucleus, and the NMR spectrum consists of a doublet νL ± νq of two symmetric lines with respect to the Larmor frequency νL. For aliphatic C–D bonds, the approximation of axially symmetric EFG tensor is usually valid (asymmetry parameter η = 0 is zero), because the EFG is principally imposed by the covalent bonding. Thus, the quadrupolar splitting νq [20] reads
| (1) |
Angle θ is the angle between the static magnetic field Bo and the principal axis zPAS of the deuteron EFG tensor. The factor Δ = 3 e2 q Q/4 h is the splitting parameter with eq = Vzz. Since the principal axis zPAS corresponding to the largest EFG principal value Vzz is parallel to the C–D bond (Fig. 1), 2H NMR probes the relative orientation of the C–D bond under consideration with respect to the static magnetic field, as well as its dynamics.
If the orientation of the principal axis zPAS is static on the NMR timescale (that is the typical orientational correlation time τc should verify Δτc >> 1), the resulting spectrum is the superposition of the different natural lineshapes Gσ(ν) which take into account of the homogeneous broadening (librations, dipolar interactions…). In the following, we assume a Gaussian lineshape for simplicity, Gσ(ν) ~ exp [–1/2(ν/σ)2] with σ the dispersion. The shape of the resulting spectrum results directly from the orientational probability density w of the C–D bonds.
2.2 Inverse methods with regularization and positivity constraint
For nonadecane/urea C19D40/CO(NH2)2, the chain orientation is mainly probed by the deuterons belonging to CD2 groups, which are in the (a,b) plane (Fig. 1). Assuming an ideal tetrahedral geometry, the angle of a CD bond with respect to the projection of the C–C bond in plane (a,b) is ~ ±54.7°. When the static magnetic field Bo is in the same plane, the behavior of the normalized quadrupolar frequencies ν/Δ (Eq. (1)) as a function of the angle between the chain and Bo is plotted in Fig. 2. As can be seen, the correspondence between frequency and angle is highly degenerate (up to four different angles may give the same frequency). Therefore, although a single spectrum contains all the information on the orientational distribution, this strong frequency overlap makes the direct extraction of the distribution function w impossible. The solution to the problem is to reconstruct the probability density w of the C–D bonds from the knowledge of spectra Se(ν, βs) recorded at different magnetic field orientations βs, since it provides an overdetermined system. However, this is in general an ill-posed problem, whose result is known to dramatically depend on the noise and imperfections, leading to strong numerical instabilities, and additional information on the probability density are usually needed to restrict the allowed solution space.
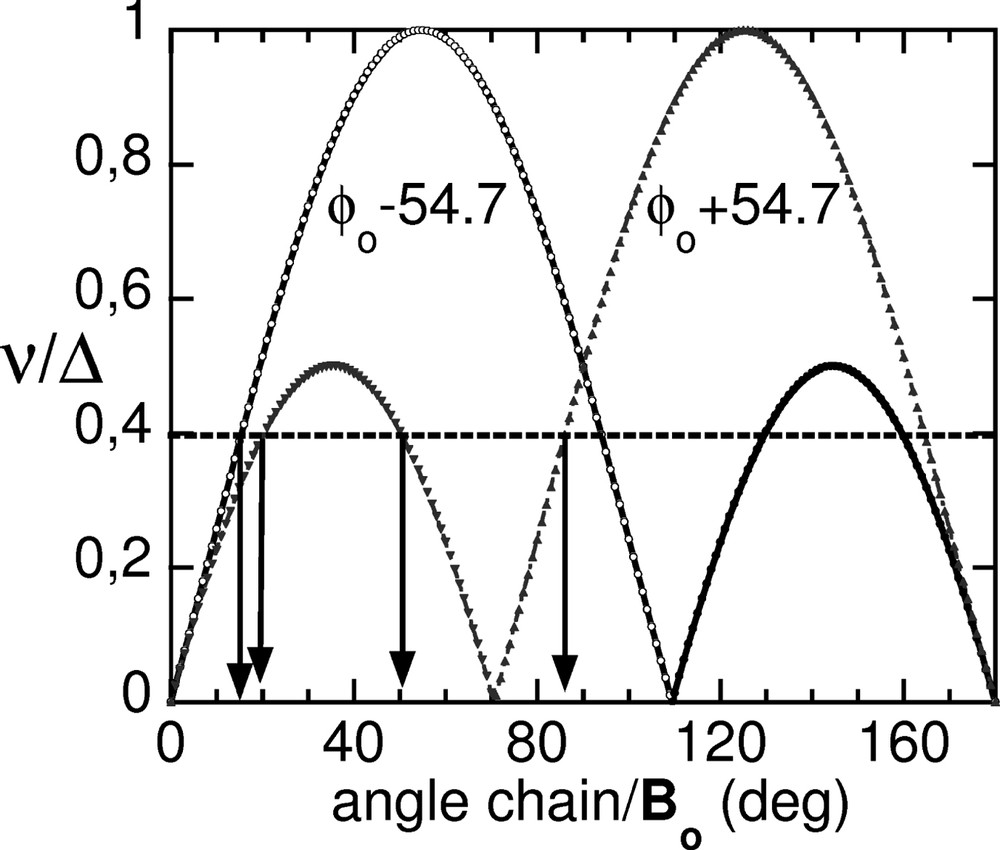
Normalized frequencies ν/Δ of the deuterons of a CD2 group as a function of the orientation of the chain (as measured by the projection of the C–C bond in the (a,b) plane) with respect to the static magnetic field. An ideal tetrahedral geometry was assumed. Only positive frequencies are shown for clarity.
Tikhonov regularization was already used to reconstruct axially symmetric disorders [13,16] which only depend on the polar angle. The method presented in this paper is a generalization to two-dimensional disorders in tubular structures which depend on azimuthal angle. Indeed, we showed recently [19] that a set of experimental spectra Se(ν, βs) acquired at different static magnetic field orientations βs, combined with an inverse method using Tikhonov regularization and positivity constraint leads to the orientationnal probability density of the C–D with a good reliability. Both approaches use a priori knowledge on the symmetry of the orientation distribution (axially symmetric or two-dimensional disorder). From the experimental point of view, it simplifies the problem since rotations around only one well chosen axis is necessary to reconstruct the distribution. Moreover, it is adapted to classical goniometer probes which provide only one rotation axis. Nevertheless, the method could be in principle generalized to a 3D disorder provided (i) enough orientational information can be acquired by rotation around different crystallographic axes, (ii) the computational time is not too prohibitive. This general problem is under consideration. In this article, the two-dimensional approach developed in [19] is adapted to the system under current interest.
The minimization problem can be transformed to a linear least-square problem by discretization of the unknown probability density x = {w(φr)} where φr = (r – 1) Δφ, Δφ being the angular resolution in reconstructing the orientational probability density. A good tradeoff between computational time, resolution and noise sensitivity was found to be Δφ = 2°. When Tikhonov regularization is used, the following merit-functional is minimized with respect to the unknown vector x
| (2) |
The first term corresponds to the usual least-square problem which constraints the stack of the reconstructed spectra Smod = M(α) x to fit the stack Se of all the experimental spectra Se(ν, βs) acquired at different orientations βs. α represents the other experimental parameters, such as the natural linewidth σ, the quadrupolar interaction Δ, and the pulse sequence non uniform excitation. The second term introduces linear additional constraints through linear operator D. In the following, the second derivative operator is used, which insures that the mean square of curvature w″(φ) of the probability density is not too large. The Lagrange parameter λ controls the degree of smoothing achieved. The necessary condition that the probability density w should be non-negative was realized by using a Non-Negative Least-Square (NNLS) procedure [14]. The optimum Lagrange parameter λ was chosen using the L-curve method [21]. The main time consuming step consists in generating the matrices M(α). All programs were written in the MATLAB language.
3 Results and discussion
The NMR experimental data and set-up were already presented [10], and are summarized here for consistency. The single crystals of selectively deuterated inclusion compound C19D40/(CO)(NH2)2 were grown following conventional procedure, with a fully deuterated alkane of commercial origin (Eurisotop). The orientation of the urea host frame was determined by neutron diffraction at the Laboratoire Léon-Brillouin in Saclay (France) to obtain a reliable orientation of the crystal as a whole. All 2H NMR experiments were performed with a Bruker ASX300 spectrometer at 46.07 MHz with a homemade variable temperature goniometer probe. The error in the angle of rotation of the sample around the coil axis was estimated to be within ±1°. The probe was inserted in an Oxford cryostat cooled by nitrogen, and the temperature was regulated with an Oxford Temperature unit, with a stability within 0.2 K. The spectra were acquired with a solid-echo sequence.
Fig. 3 presents single crystal 2H NMR typical spectra of nonadecane urea at 90 K for both orientations Bo || c and Bo ⊥ c. When Bo || c, a single well defined line at ≈ 62 kHz and second moment of 1.5 kHz is measured. In the geometry Bo ⊥ c, the spectra become orientation dependent. Since the different lines are not well defined and quite broad, we expect that an orientational intrinsic disorder of the chain orientation can explain the observed lineshapes.
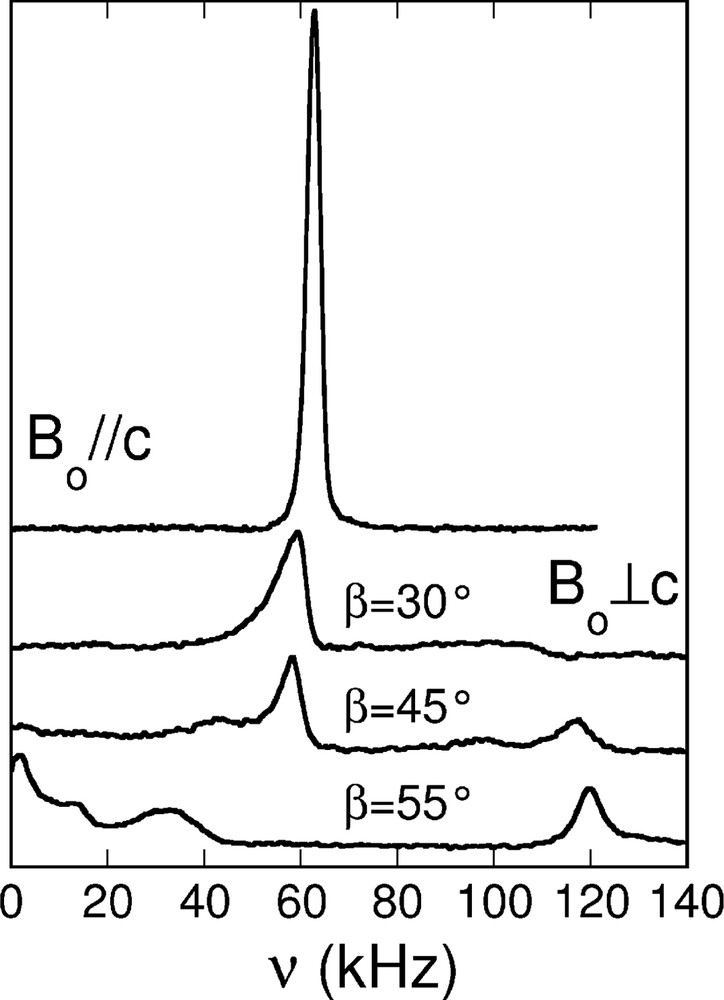
Experimental 2H NMR spectra 90 K of a single crystal of selectively deuterated nonadecane in hydrogenated urea-h4, for different crystal orientations (Bo ⊥ or || c). When Bo ⊥ c, the number above each spectrum represents angle β = ∠Bo,a in degrees. All spectra are normalized to one. Since the spectra are symmetric, only the positive part is shown.
For nonadecane/urea inclusion compounds, it was proved that the spectra show a periodicity of 2π/6 by rotation, and that the deuterons are static on the NMR timescale: (i) the quadrupolar interaction is Δ = 120–125 kHz, and corresponds to usual static value for aliphatic C–D bonds in such systems. ; (ii) since the maximum splitting is attained for Bo ⊥ c and reduced by a factor of 2 as compared to the Bo || c configuration, it can be deduced that the c channel axis is still a principal axis of the deuterium EFG, and that the C–D bonds are perpendicular to the channel axis [10]. It is thus reasonable to assume rigid all-trans n-alkane chains with C–D bonds in the (a,b) plane at 90 K.
The origin of the chain orientational disorder in the low temperature phase is at least twofold. First, for a given domain, it depends on the relative orientation of the chains with respect to the mean domain orientation. This disorder may be within each channel (different chain orientations as a function of c) and/or in different channels. The second contribution comes from the disorientation of the domains with respect to ideal C3 symmetry, for instance by the splitting into subdomains. Since NMR performs an ensemble average over all chains and domains, the origin of the disorder cannot be determined, but its magnitude can be quantified. In Ref. [10], the chain orientation and angular dispersion were deduced from a model of domains and herringbonelike chain arrangement in the low temperature phase because X-ray and coherent neutron diffraction experiments resolved six equiprobable orthorhombic domains, with a splitting of δ = ±1° at 90 K [8,9]. Assuming that the residual chain orientational disorder is a Gaussian distribution of mean orientation φo and angular dispersion ρ, the expected spectra were modelized by 12 quadrupolar doublets because each CD2 group creates two quadrupolar doublets per domain:
| (3) |
In the following, we present a model-independent reconstruction of the orientational probability density of the C–D bonds in the (a,b) plane using the inverse method regularized by a Tiknonov procedure and a non negative least-square fitting presented in the previous section. It will be the object of a future work to present a detailed study of all the potentiality of the method.
The reconstruction of the C–D distribution w mainly depends on two parameters, the quadrupolar interaction Δ and the natural linewidth σ. The first parameter, Δ, is already known from both independent powder or single crystal experiments [22–24], but not the natural linewidth σ. In the reconstruction of the orientational probability density, an important question arose concerning the correlation between the input natural linewidth σ and the resulting angular dispersion ρ. Indeed, quantifying to what extend an over or underestimation of σ modifies the estimation of the dispersion ρ of the residual intrinsic orientational disorder becomes increasingly important for small disorder.
We therefore performed the minimization procedure of the merit-function dλ(x, σ) Eq. (2) at different σ values which are physically acceptable, typically between 0.5 and 4 kHz, and studied the behavior of the least-square error (LSE) E(σ) = ||Se – M(σ)x(σ)|| as a function of σ. The advantage of using this pedestrian method as compared to a direct minimization of dλ(x, σ) with respect to both x and σ is twofold. First, it simplifies the implementation of the minimization procedure to routine linear least-square methods which have a fast and well understood convergence. Moreover, it saves computational time since, once the different M(σ) matrices are computed, the minimization can be performed on different data without extra computational time. Second, the behavior of the LSE gives a direct visualization of the sensitivity of the method to the input parameters. Obviously, the drawback of this approach is that it is limited to only a few (in practice three or four) parameters.
Fig. 4 presents the behavior of the least-square error E(σ) = ||Se – M(σ)x|| as a function of σ for the experimental data acquired with nonadecane/urea. The LSE presents a well defined minimum for σ ≈ 1.2–1.5 kHz. Such values were also found robust to slight modifications in the filter function which corrects the pulse sequence non uniform excitation. Therefore, the LSE minimum gives an estimation of the natural linewidth σ.
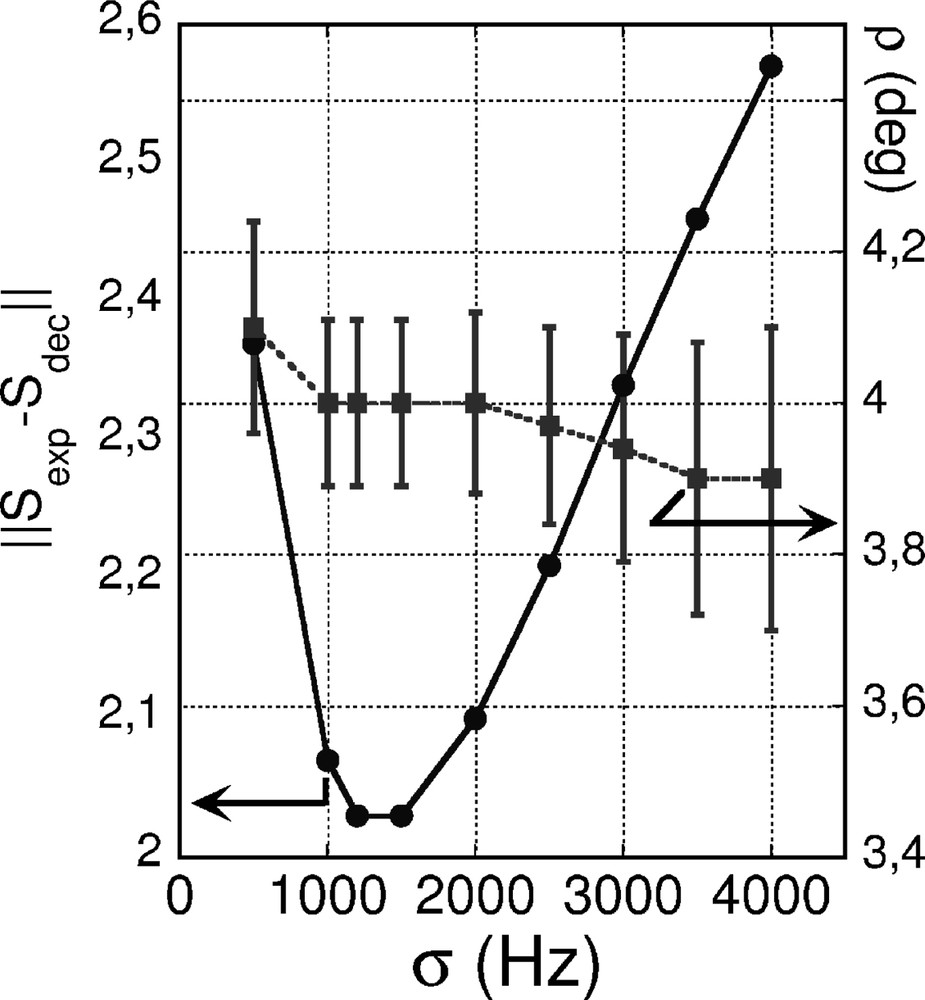
Least-square error (left scale) and intrinsic angular dispersion ρ (right scale) as a function of the natural linewidth σ used for the inversion of the CD orientational probability density. Black circles, left scale: least-square error (||Se – Mw||). Black squares, right scale: corresponding intrinsic angular dispersion ρ in degrees. The error bars represent the statistical error calculated from the least-square fitting procedure of the resulting probability density wσ with the sum of two Gaussians of equal weight and dispersion ρ.
The corresponding normalized orientational probability densities w of the C–D bonds are all bimodal within each 2 π/6 sectors, showing that only one chain orientation per domain characterizes the system at this temperature. When σ does not corresponds to the minimum of E(σ), the two lobes of the distribution are slightly asymmetric, whereas they are symmetric at the minimum. Nevertheless, the least-square fits of the different wσ with the sum of two Gaussians of equal weight and dispersion ρ were always good. These fits give the residual intrinsic angular dispersion ρ as a function of σ. As indicated by the second plot included in Fig. 4, the residual intrinsic angular dispersion ρ is a slight decreasing function of σ whereas the statistical error, calculated from the least-square fit, increases. Typically, ρ ~ 4.1 – 3.9° when σ increases from 0.5 to 4 kHz. Within the error bars, it indicates that ρ is almost not correlated to the input natural linewidth σ and a value of ρ ≈ 4° ± 0.5 can be considered as reliable. This value is consistent with the value of ρ ≈ 3° obtained from the model of splitted domains (Eq. (3)), but we should stress that our method is model-independent.
The final orientational probability density of the C–D in nonadecane/urea at 90 K, obtained at the minimum of the LSE, is presented in Fig. 5 in a polar plot. The probability density has twelve lobes. In contrast to the reconstructed probability densities which do not correspond to the LSE minimum, the lobes are here perfectly symmetric. Since the C–D/C–D angle is ~109.4°, we can deduce the mean chain orientation, which points towards the corner of the hexagon representing the mean low temperature framework. The origin of this residual intrinsic angular dispersion cannot be more characterized by NMR due to the ensemble average over chain and domain orientations. However, since the domains are split by δ ≈ ±1° (at 90 K) with respect to the mean orthohexagonal direction, we expect the true angular distribution within each domain to be smaller than 4°.
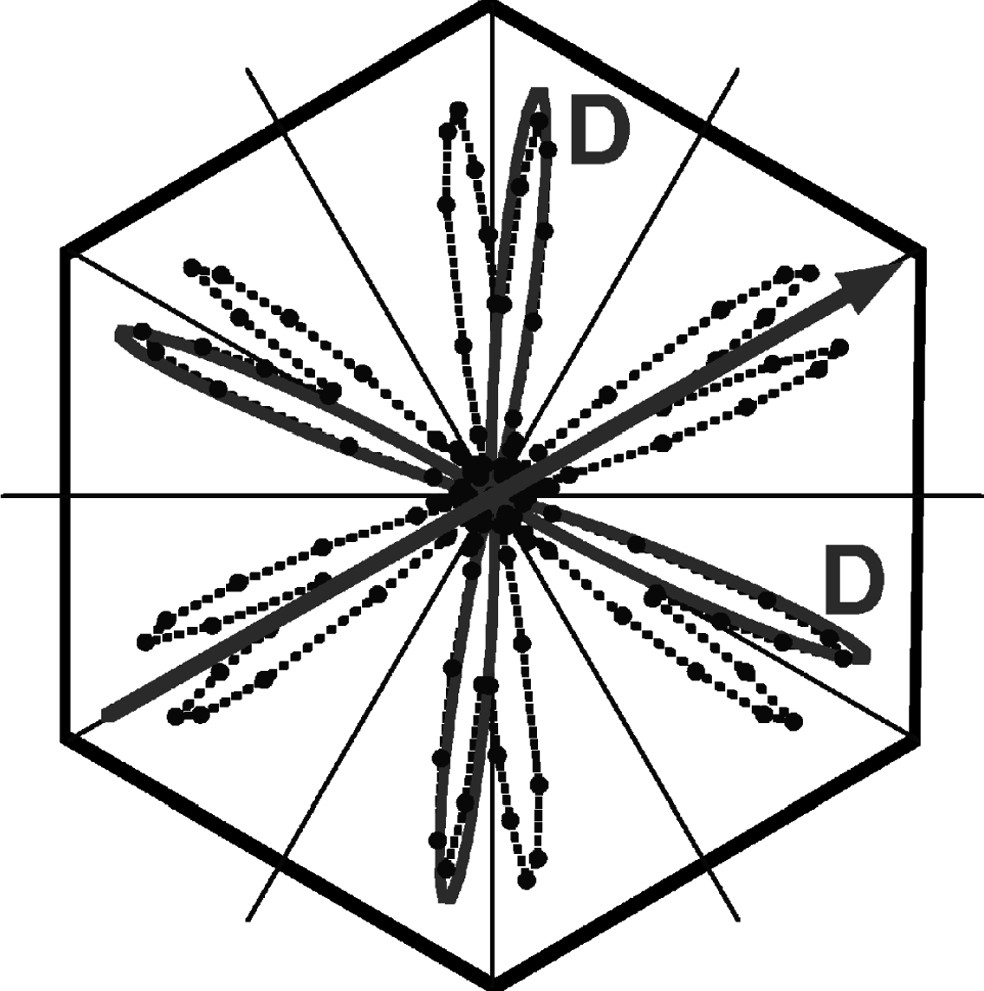
Optimum orientational probability densities w of the nonadecane C–D bonds, for nonadecane/urea-h4 at 90 K, obtained by inversion with Tikhonov regularization and NNLS procedure (σ = 1.5 kHz, angular resolution Δφ = 2°); The solid gray lines represents a least-square fit of the reconstructed probability densities by the sum of two Gaussians of equal weight and angular dispersion ρ = 4°, for a given CD2 group. The arrow indicate the mean chain orientation corresponding to the CD2 mean orientation.
It also worth mentioning that the main approximation underlying the orientational deconvolution method proposed above concerns the invariance of the natural linewidth σ as a function of orientation. In principle, this parameter may depend on the magnetic field orientation, although we expect this dependence to be small in a C6 symmetric axial system (on average). Nevertheless, the fact that the estimation of the residual intrinsic disorder is almost not correlated to the input natural linewidth suggests that an orientational dependent real natural linewidth may only slightly affect the result. This problem will be the object of a future work, as well as a generalization to non axial disorders.
4 Conclusion
From the information contained in single crystal 2H NMR spectra acquired at different magnetic field orientations, we reconstructed the orientational probability density of the C–D bonds orientations of deuterated nonadecane molecules ultraconfined in urea parallel channels in the low temperature phase of nonadecane/urea at 90 K. The reconstruction method is based on linear least-square fitting with Tikhonov regularized procedures and non negative constraints. In particular, a careful study of the behavior of the least-square merit-function shows that the result is almost not correlated to the estimation of the natural linewidth. The results are fully consistent with a previous study, and confirm that the mean chain orientation points towards the corner of the channels with an intrinsic angular disorder which could be quantified precisely. The originality of our approach comes from the fact that the method is model-independent, in contrast to previous studies. Because the method does not make any structural hypothesis concerning the ordering of the host/guest compound, the results are therefore independent from the controversial interpretation of diffraction results.
These results give another illustration that single crystal NMR combined with regularized inverse methods is a unique tool to determine intrinsic static orientational disorder in complex supramolecular architectures.
Acknowledgements
We are indebted to Y. Legrand for careful reading of the manuscript, to J.-C. Ameline for technical support, and to T. Breczewski for providing deuterated single crystals of high quality. We also thank B. Toudic for fruitful discussions.