

1 Introduction
The Atomic-Force Microscope (AFM) is a promising device for the investigation of materials surface properties at the nanoscale. Precise analysis of adhesive and mechanical properties, and in particular, of model polymer surfaces can be achieved with a nanometer probe. The purpose of this study is to dissociate the different contributions (chemical and mechanical) included in an AFM force-distance curve in order to establish relationships between interfacial tip-polymer interactions and surface viscoelastic properties of the polymer. Measurements of local adhesive forces between a silicon nitride tip (Si3N4) and model substrates are performed by using the AFM contact mode, at ambient temperature, in the air. Considering that the main technical uncertainties have been listed and minimized, surface force measurements are, in a first step, done on chemically modified silicon substrates (grafted with hydroxyl, amine, methyl and ester functional groups). In order to investigate the effects of mechanical or viscoelastic contributions, force measurements on model polymer networks, whose surfaces are chemically controlled with the same functional groups as before (silicon substrates) were achieved. The results show that the viscoelastic contribution is dominating in the adhesion force measurement. At the end of this study, new relationships are proposed between the local adhesion force and both the dissipation energy in the tip-polymer contact and the surface properties of the materials (thermodynamic work of adhesion). Moreover the dissipation function is related to Mc, the mass between crosslinks of the network.
2 The state of the art
It is important to mention recent works that have contributed to the understanding of adhesion mechanisms at a local scale. Burns and al. [1] have demonstrated the influence of adhesion on sliding and on friction forces on chemically modified surfaces. Jones and al. [2] have studied the effects of relative humidity, roughness and surface treatment on adhesive properties of glass-glass contact. Rabinovich [3] has considered the influence of roughness at the nanometer scale. But none of these studies has been devoted to the contact between a local probe and a chemically modified polymer surface. The main reason is the difficulty of quantitative interpretation of the results obtained on viscoelastic materials [4,5]. However, Basire and Fretigny [6] have done important work that allow them to determine static and dynamic modulus of polymers even if the Dupre energy they found appears to be rather small (10 mJ.m2). Nysten and Cuenot [7,8] have conducted oscillatory experiments of an AFM probe under electrostatic field. The resonant frequency of the probe is directly related to the mechanical properties of the studied material. Finally, Aimé and his team [9,10] have studied dissipative phenomena in the adhesive contact by using dynamic AFM. They propose an original model [11] for the determination of polymer viscosity on the basis of Non-Contact resonant AFM mode. Nevertheless none of these studies was done on chemically modified polymer surfaces in order to investigate the interplay between surface chemistry and mechanical properties at a local scale.
3 Materials
Si(100) silicon wafers (Mat Technology France) polished on one side were used as substrate for the adsorption of Self Assembly Monolayers (SAMs). In this paper, “as received silicon (Sias received)” refers to a silicon wafer previously cleaned with ethanol in an ultrasonic bath. That means that a contaminated layer still remains on the surface. Four organosilane grafts (supplied by ABCR Karlsruhe-Germany) were used for the elaboration of homogeneous model surfaces on the substrate. Two hydrophobic model surfaces were prepared by using hexadecyltrichlorosilane (C16H42O3Si or Si–CH3) and 1H,1H,2H,2H-perfluorodecylmethyldichlorosilane (C11H7Cl2F17Si or Si–CF3) and two hydrophilic model surfaces by using (6-aminohexyl)-aminopropyltrimethoxysilane (C12H30N2O3Si or Si-NH2) and 2(carbomethoxy)ethyltrichlorosilane (C4H7Cl3O2Si or Si–COOR). Polymers, namely polydimethylsiloxane (PDMS) were supplied by ABCR (Karlsruhe, Germany). All other chemicals used in chemical handling (cleaning, synthesis) were of reagent grade or better (supplied by Aldrich).
3.1 Preparation of oxidized silica surface
Before coating, the substrates must be chemically modified in order to get a hydrophilic surface (SiO2). The silicon surface is first cleaned with ethanol and dried with nitrogen before oxidation. Then, oxidized surfaces are obtained after cleaning the substrate in a warm Piranha (60 °C) solution (3:7 v/v 30% H2O2 and H2SO4 mixture) for about 30 minutes in order to keep a smooth surface, and then, thoroughly rinsed with deionized and twice distilled water. Just before being grafted with organosilane the wafers are dried with nitrogen. This treatment produces a high hydroxyl group density on the surface (SiOH groups), to which functional silanes will adsorb upon hydrolysis [12].
Silicon wafers covered with hydroxyl end-groups (Si–OH) were obtained with this method and immediately probed in order to avoid contamination of the surface by the environment due to the high reactivity of silanol groups. Typical time between the drying process and the first experiment is 10 min. Hundred measurements are done for a given surface. The time constant of an experiment is 0.1 s (10 Hz).
3.2 Grafting of functionalized SAMs on silicon wafer
Three different techniques are frequently used to obtain SAMs: Langmuir–Blodgett techniques, involving an air–water interface to transfer the assembled film to a solid substrate, solution adsorption of graft molecules onto the substrate, and vapour–phase molecular self-assembling technique [12], which uses vapour deposition of the film onto the substrate. The functionalized SAMs used in this study were prepared with the last technique slightly improved in the laboratory [13]. The lack of solvent prevents the SAMs from a possible incorporation and contamination of solvent molecules and defects. Moreover, a previous study [14] showed that the molecular films prepared with this method, are more homogeneous.
The silicon wafers are placed above a previously de-aired solution of 100 μl of organosilane - 3 ml of paraffin mixture. The vapour-phase deposition of the molecular film on the substrate is performed in a vacuum chamber (50 min at 5 × 10⁻³ Torr) at room temperature.
3.3 Cross-linking and functionalization of PDMS networks
PDMS samples were cross-linked under nitrogen in a glove box using tetrakis(dimethylsiloxy)silane as a cross-linker and a platinum-based catalyst. All the chemicals were supplied by ABCR (Karlsruhe, Germany). All the size and mechanical characteristics of the different PDMS are gathered in Table 1. Mc values represent the average molecular masses between crosslinks after crosslinking. Mc values are ranging betwwen 0.8 kg/mol and 34 kg/mol. Then, PDMS 0.8 k is the hardest substrate, whereas 34 k refers to the softest one. Mc values were determined by swelling experiments. Flory's law of rubber elasticity [15], which represents the reciprocal tensile modulus versus Mc, the mass between crosslinks, is satisfied for the synthetized networks as reported on Fig. 1. This proves that a good control of macroscopic mechanical properties is achieved. Moreover, the Young modulus is independent of the strain rate in the range of strain rate corresponding to those used during AFM experiments (at ambient temperature for all the networks). PDMS networks are then treated by water plasma and functionalization was done using the vapour deposition technique.
Size and mechanical properties of the cross-linked PDMS
| PDMS | Average mass between crosslinks Mc (g/mol) | Elasticity domain (%) | Deformation at break (%) | Young modulus (MPa) |
| 0.8 k | 800 | 40 | 196 | 2.24 |
| 8.5 k | 8500 | 46 | 210 | 0.64 |
| 13 k | 13000 | 47 | 250 | 0.30 |
| 23 k | 23000 | 50 | 245 | 0.19 |
| 34 k | 34000 | 52 | 250 | 0.13 |
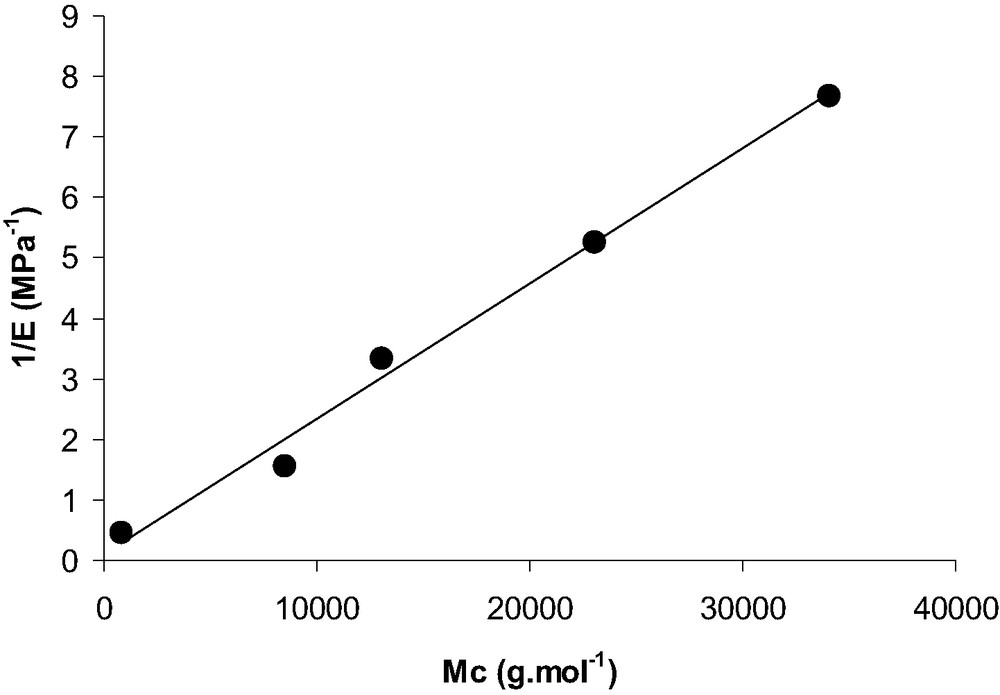
1/E = f(Mc) curve. E is the Young tensile modulus determined with a 1 mm/min strain rate and Mc is the average mass between crosslinks (in g/mol).
3.4 Characterization of the SAMs
Fig. 2 represents, as an example, AFM topographic and phase contrast images of the Si-CH3 wafer. Tapping mode images confirm that no aggregates were formed and show a complete homogeneous recovery of the grafts. Average roughnesses are ranging between 0.1 nm (Si-OH) and 0.3 nm (Si–CH3), whatever the grafted substrate. On PDMS substrates, average roughness is equal to 0.5 nm whatever the grafted molecules. These values confirm that the grafts are well ordered and packed at nanometer scale.
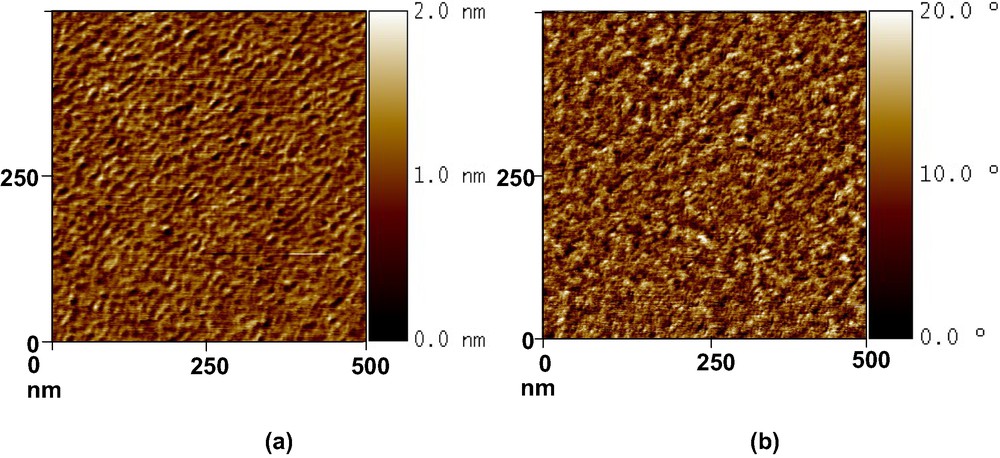
Topographic (a) and phase contrast (b) images (500 nm × 500 nm) of a CH3-grafted silicon wafer.
Contact angle measurements with water droplets, surface energy (determined by wettability) and ellipsometric results obtained on wafer and PDMS grafted substrates are gathered in Table 2.
Water contact angles, surfaces energies and thicknesses of SAM on silicon wafers and PDMS substrates
| Substrates | Contact angle of water (°) | Surface energy (mJ/m2) | Experimental SAM thickness (Å) | Theoretical SAM thickness (Å) |
| Si–CF3 | 106 ± 2 | 21 ± 1 | 12 ± 1 | 14 |
| Si–CH3 | 103 ± 2 | 22 ± 1 | 21 ± 1 | 22.5 |
| Siasreceived | 78 ± 2 | 32 ± 1 | — | — |
| Si–COOR | 71 ± 2 | 43 ± 1 | 5 ± 1 | 6 |
| Si–NH2 | 57 ± 2 | 53 ± 1 | 9 ± 2 | 15 |
| Si–OH | 6 ± 2 | 76 ± 1 | — | — |
| PDMS | 104 ± 4 | 28 ± 1 | — | — |
| PDMS–CH3 | 108 ± 4 | 22 ± 1 | 22 ± 2 | 22.5 |
| PDMS-NH2 | 50 ± 4 | 53 ± 1 | 10 ± 3 | 15 |
Contact angle measurements (Table 2) show that grafting is effective and values obtained correspond to espected one [16]. Same comments are valid for surface energy values. Thicknesses of organic SAM films were determined by ellipsometry (Sopra ES4 M ellipsometer) measurements by fitting the refractive index and the thickness of the organic film. Experimental values are in good agreement (Table 2) with the estimated theoretical values [17–19]. Values reported in the literature correspond to untilted grafts relative to the surface plane. In fact the graft molecules are tilted with a characteristic angle between the long-molecular axis and the surface normal [20]. This angle explains the difference between experimental and theoretical values. Nevertheless ellipsometric results confirm that only a monolayer is formed whatevever the substrate and the grafted molecule.
All the AFM imaging, ellipsometric and contact angle measurements performed on the SAMs show that homogeneous and well packed grafting is obtained both on the silicon wafers and PDMS.
4 Results and discussion
4.1 Force–distance curve measurements and AFM calibration
4.1.1 Force–distance curve features
Force measurements with AFM, in the contact mode, consist in detecting the deflection of a spring (or cantilever) bearing a nitride silicon tip at its end, when interacting with the sample surface. The deflection of the cantilever is detected by an optical device (four quadrants of photodiodes) while the tip is vertically moved forward and backward thanks to a piezoelectric ceramic (or actuator). Thus, provided that the spring constant of the cantilever is known, one can obtain a deflection–distance (DD) curve and then a force–distance (FD) curve, by using Hooke's law. The DD curves were performed in the air with an available commercial apparatus (Nanoscope IIIa D3000, Digital Instruments). A schematic representation of a DD curve obtained when probing a hard surface is reported in Fig. 3.
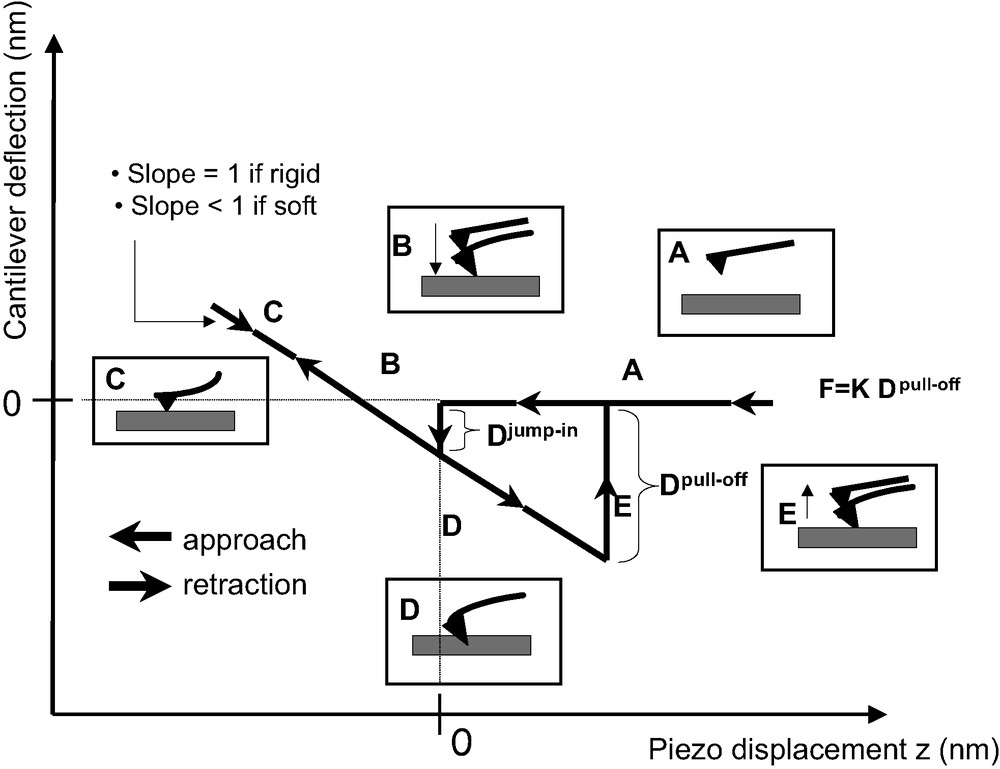
Schematic representation of a DD curve. The slope of the ‘contact zone’ is equal to unity when considering the contact between the tip and a rigid surface, whereas it is lower than 1 when considering the contact between the tip and a soft material (polymer).
4.1.2 Description of the DD curve (contact mode)
In zone A, the cantilever is far from the surface and stays in a state of equilibrium (no interaction with the surface). The cantilever deflection is zero. During the approach toward (or withdrawal from) the surface, the tip interacts with the sample and a jump in (or jump-off) contact occurs (zones B (for loading) and F (for unloading)). These instabilities take place because the cantilever becomes mechanically unstable. Usually, for underfomable surfaces, because of mechanical instabilities, jump-in contact is not significant to determine, quantitatively, attractive Van der Waals forces. When in contact, the cantilever deflection is equal to the piezoelectric ceramic displacement provided no indentation of the substrate occurs (zones C (for loading) and D (for unloading)). An underfomable reference sample (cleaned silicon wafer) is used to scale the DD curve in deflection by fixing to unity the slope value of the contact line.
4.1.3 AFM calibration
One of the fundamental points to obtain reproducible, quantitative and reliable data is the calibration procedure, which should be rigorous and systematic for all measurements.
4.1.3.1 Determination of the spring constant of the cantilever
To determine the spring constant of the cantilever, a non-destructive method, based on the use of reference rectangular cantilevers [21] was used. The cantilevers used in this study, were triangular shaped cantilevers (supplied by Nanosensor-Germany) and have effective spring constant equal to 0.30 ± 0.03 N m−1 (the value specified by the supplier is 0.58 N m−1!). Cantilevers having the same spring constant were choosen for this study.
4.1.3.2 Non-linearity of the quadrant of photodiodes
The non-linearity of the optical detector is the consequence of a non-homogeneous spreading of the laser spot on the detector. This non-linearity has been studied by reporting the slope of the contact line (zones C or D) of the DD curve (obtained on a hard surface and considering that there is no non-linearity at the middle of the photo detector) versus the tension (V) measured by the detector. The domain of linearity of the detector lies between ±2 V. If non-linearity is not taken into account, the error on the quantitative results can be significative, because the slope of the contact line determines the Y-scale.
4.1.3.3 Scan rate of the cantilever
The actuator shows hysteresis in its vertical displacement. This hysteresis can be studied by reporting the slope of the contact zones (zones C and D) versus the amplitude of the contact zone and the scan rate. During the experiments, the actuator is considered as thermally stable. We observed that a discrepancy appears for very low scan rates. For higher scan rates, the viscosity of the environment could be significant. A rate of about 6 μm.s−1 is a good compromise.
4.1.3.4 Systematic checking
In addition, checking regularly and randomly the adhesion force on a reference silicon wafer verifies contamination of the tip during the measurements. When the tip is contaminated, a new tip is used and characterized. In that way, selected tips have the same radius and the same spring constant in order to compare the experimental values. We mention that tip contamination occurs a few in comparison of the great number of DD experiments. Finally, the reported results are an average of about 100 DD curves for each substrate. Relative incertainty is equal to 8% in all cases [13].
4.2 Force–distance curves on rigid systems of controlled surface chemistry
The tip-sample pull-off force was first measured on chemically modified SAMs obtained on undeformable substrates (silicon wafers) and was compared with that for as received silicon wafer. Fig. 4 shows that AFM measurements in our conditions are sensitive to a chemical modification of the wafer surface by adsorption of SAM. When jump-off (or jump-in) contact occurs, the corresponding pull-off deflection (or pull-in) is measured. Pull-off deflection values (Dpull-off) increase in the following order:
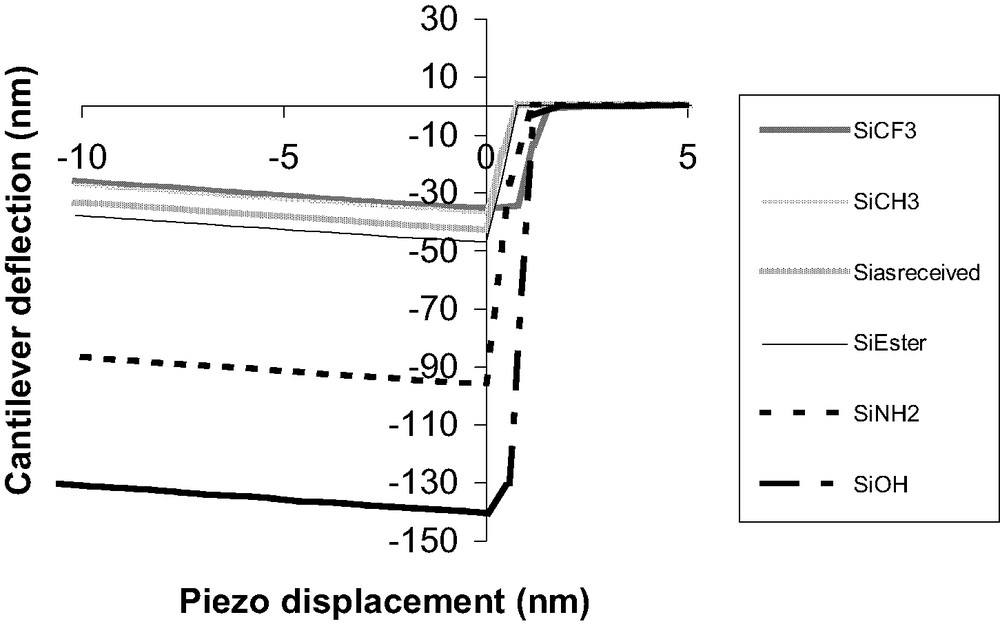
Experimental DD curves (retraction) on functionalized silicon wafers.
Dpull-off SiCF3 < Dpull-off SiCH3 < Dpull-off Siasreceived < Dpull-off SiCOOR < Dpull-off SiNH2 < Dpull-off SiOH
Knowing the pull-off deflection one can easily deduce the adhesion force, knowing the cantilever spring constant k:
| (1) |
The DMT theory [23], also establish a relationship between the adhesion force (F), the tip radius (R) and the thermodynamic work of adhesion (W0) :
| (2) |
On the basis of this relation one can deduce W0 from experimental adhesion forces. Fig. 5 shows that the thermodynamic work of adhesion, W0, is proportional to the surface energy deduced from classical wettability measurements.
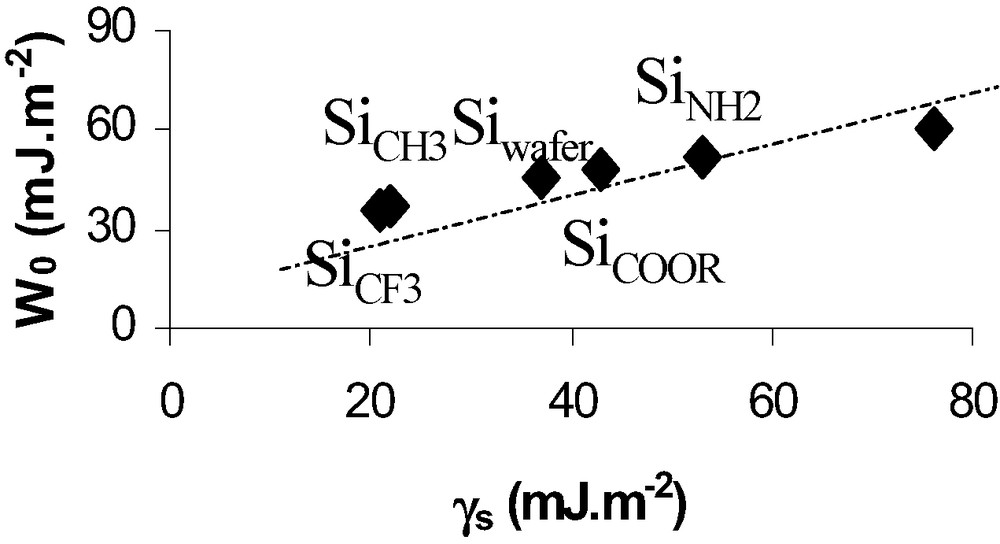
Thermodynamic work of adhesion deduced from AFM (DMT theory) versus surface energy of SAMs grafted wafers.
In the case of hydrophilic surfaces (Si–NH2, Si–OH), the AFM tip interacts with the water layer adsorbed on the surface and the measured adhesion force results from the adhesion between water adsorbed on the both surfaces (tip and sample) and from the adhesion force due to the Van der Waal force between the NH2 or OH sites existing at the grafted wafer surface. On the contrary, during wettability experiments the water droplet deposed on the surface does not feel the OH sites existing at the hydroxylated wafer surface.
For technical reasons, all the AFM measurements were done in the air at about 20 °C. Under these conditions, the influence of the capillary forces cannot be neglected. Indeed, all the experiments were done at a constant relative humidity of 30%. Many studies have reported the effect of humidity on the separation force. Xiao and al. [24] and Sedin and al. [25] have shown that a water meniscus cannot be formed between the tip and the surface if relative humidity is below 20%. He and co-workers [26] have observed a meniscus formation only in the case of hydrophilic contact but not for hydrophobic contact. These results are confirmed by Zhong and al. [27]. Salmeron [28], for an hydrophilic tip-Mica contact has observed that water capillary effects are significant if relative humidity is higher than 40%. As in our experiments the humidity is of 30% one can suspect the existence of a capillary bridge. On the theoretical point of view, the minimum thickness of the water capillary film is expressed as [29,30]:
| (3) |
As a consequence, the force measured by AFM includes the contribution of Van Der Waals and capillary forces. The total adhesion force is given by the following expression:
| (4) |
The capillary force depends on a meniscus formed between the two surfaces and is given by Israelachvili [16] and by Riedo and al. [31], in the case of sphere-plane contact, by:
| (5) |
Values of W0 (Fig. 5) were obtained after correction from capillary forces effects on Si–NH2 and Si–OH hydrophilic surfaces.
4.3 The specific case of force–distance measurements on polymers
A comparison between the DD curves obtained on a silicon substrate and on a PDMS substrate shows important differences probably due to the specific mechanical behavior of PDMS polymer chains (Fig. 6). First compared to silicon wafer, in the tip-polymer separation process, the jump-off contact occurs over a large piezo displacement scale and could correspond to a progressive dewetting of the tip by polymer chains during tip retraction. Second, the jump-off amplitude is higher than for silicon wafer. Finally, the loading and unloading slope in the DD representation is much lower than unity in the case of soft polymer systems. The beginning of the indentation is assumed to be at the minimum of the DD curve. Creep experiments have also been performed with the AFM. Considering the experimental contact time (texp < 0.1 s), the creep effect is neglected in our force curve measurements (Fig. 7).
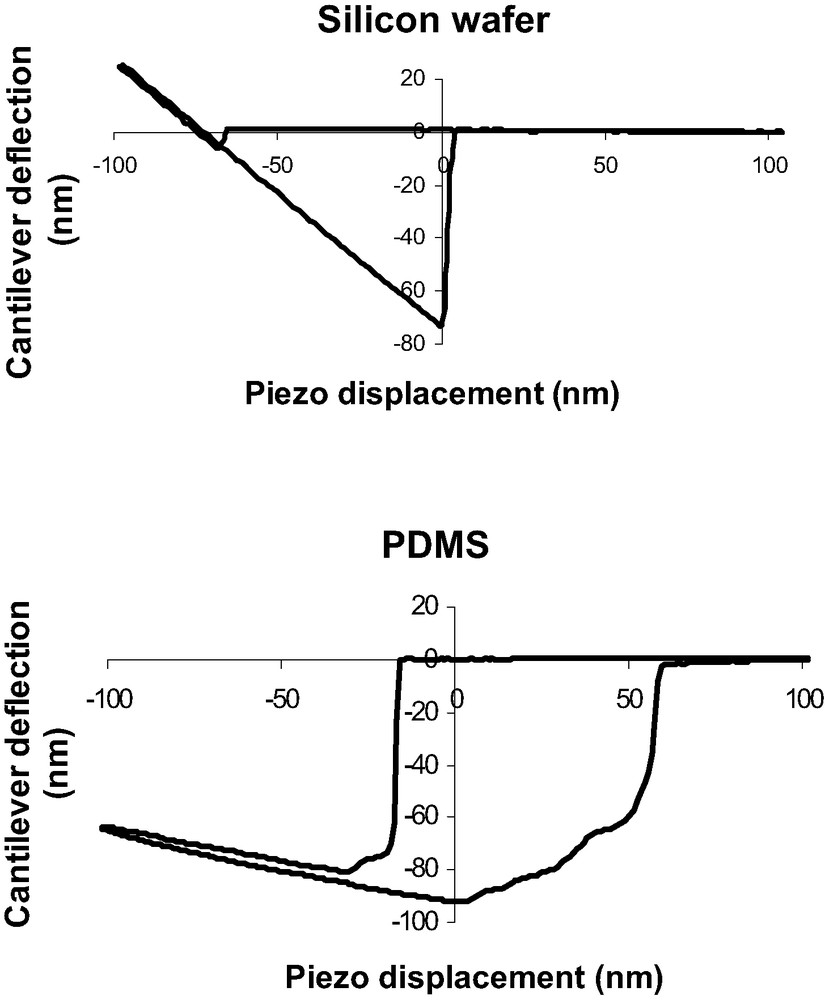
Comparison between a DD curve obtained on a silicon substrate (top) and a PDMS substrate (bottom).
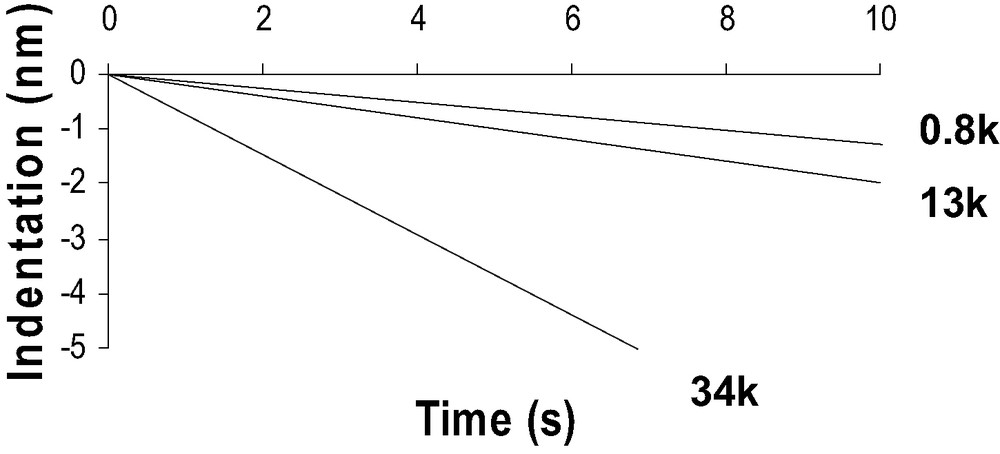
Creep experiments (Indentation (nm) vs time (s)) with the AFM (corrected from thermal drift) on the 0.8-k, 13-k and 34-k PDMS networks.
Nevertheless a crucial question concerns the beginning of indentation in the specific case of soft polymers. Indeed, for very low modulus materials, the jump-in contact deflection appears to be very important and somehow comparable to the jump-off contact (Fig. 6). Such an amplitude (60-80 nm) could not be only due to mechanical instability of the cantilever, estimated to be equal to 4–5 nm. In order to explain the important deflection when contact occurs, we propose the hypothesis of the formation of a nanoprotuberance at the PDMS surface. This protuberance comes into contact with the AFM tip and relaxes till zero deformation of the surface. This relaxation induce a high deflexion of the tip. Aime and al. [33] have proposed such a model that takes into account the polymer viscoelasticity. As our PDMS present very low modulus and high eleasticity we have used and adapted a model based on linear elasticity [34]. Detailed information could be find in [13]. Briefly, at a given time t, the AFM tip is at a distance d(t) from the polymer surface. The tip-surface interaction force is F(t). This force produces the formation of a nanoprotuberance of height h(t). At time t + Δt, the tip-sample distance is:
| (6) |
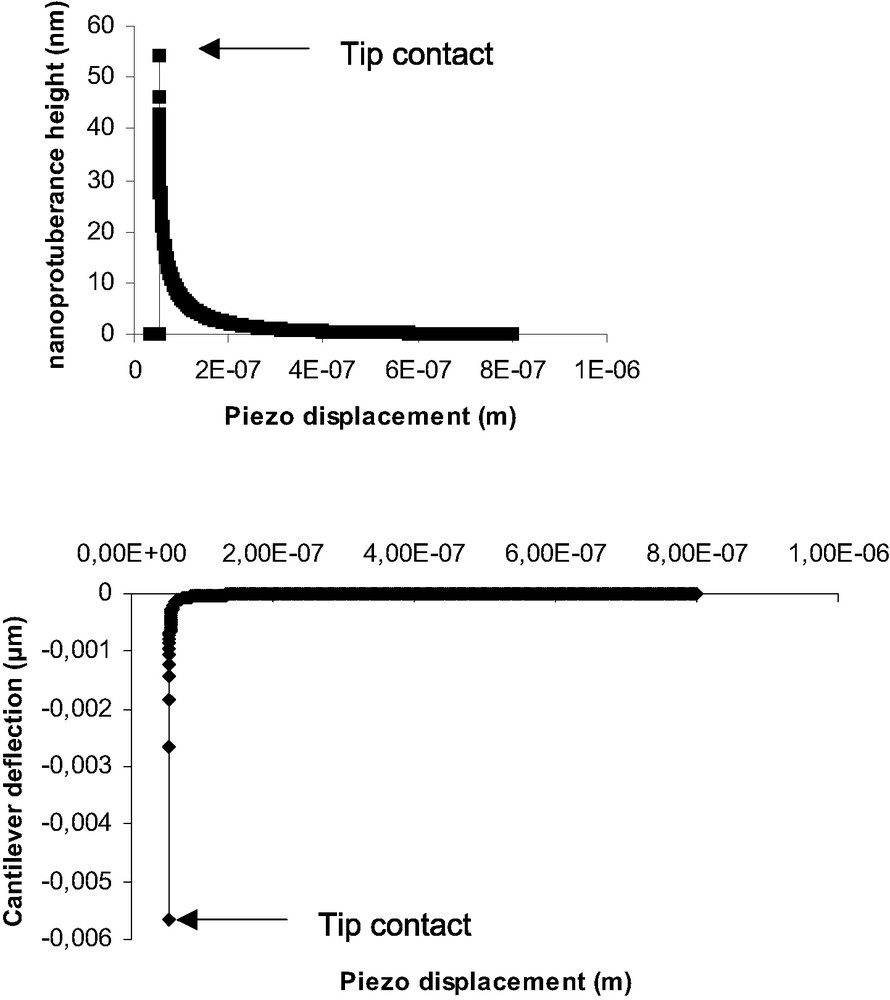
Simulation of nanoprotuberance height (top) and cantilever deflection (bottom) vs piezo displacement, at the beginning of the contact.
Nanoprotuberance heights (nm) obtained by simulation and jump-in contact amplitude (nm)
| PDMS | Nanoprotuberance height (simulation) (nm) | Jump-in contact amplitude (average over 100 DD curves) (nm) |
| 0.8 k | 24 | 20–25 |
| 13k | 50 | 50–65 |
| 34 k | 73 | 70–85 |
4.3.1 Force–indentation measurements on polymers
Before monitoring DD curves on PDMS, the actuator and the cantilever were thermally stabilized. The laser spot position on the tip was also optimized. Indeed, Warmack and al. [35] have studied the effect of the laser beam position on the cantilever when the tip is subject to tangential forces. They show that, depending on the beam position, the contribution of the tangential forces is more or less important on the detected signal. The laser spot in contact with the tip was positioned in such a way that the effect of tangential forces were minimized. DD measurements were carried out on the basis of the above prerequisites so that force measurements could be liable and compared.
To deduce work of adhesion from our experimental values, it is necessary to have a good estimation of the radius of the tip. The MEB picture (Fig. 9) reveals that the tip shape can be represented as a pyramid ended by a sphere. Average tip radius of the selected tips is estimated to be equal to 50 nm ± 5 nm on the basis of MEB pictures.
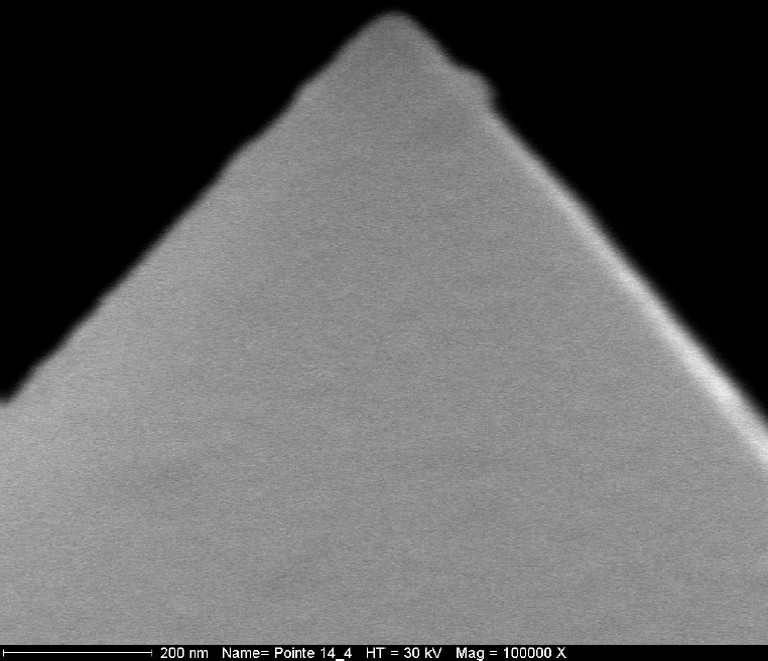
MEB photography of an AFM tip.
One had to ask now if the the cantilever is stiff enough to penetrate the PDMS networks. Considering the normal stiffness of the cantilever, it is possible to determine the maximum indentation depth (δmax), using the following relationship.
| (7) |
4.4 Force–indentation curves on systems of controlled surface chemistry and controlled mechanical properties
Force–indentation (F–I) curves (Fig. 10) are deduced from DD curves by assuming that for a given force, the indentation depth is the difference between the experimental deflection value (dsoft) and the one that should be observed if the material was underfomable (drigid) deduced from the slope of 1 for underfomable materials. All F–I curves obtained on PDMS and grafted PDMS have been performed at a 80-nm indentation depth, as discussed previously. We consider PDMS of different Young modulus grafted with identical molecules than silicon wafers (CH3 and NH2 SAMs). Fig. 10 clearly shows the influence of the network mechanical properties on F–I response when surface chemistry is constant (CH3 grafts). For low Mc value (0.8 k), loading and unloading are quite similar and rather no dissipation of energy is observed. On the contrary, when Mc increases (34 k) unloading is greatly different from loading and dissipation and adhesive contact occur.
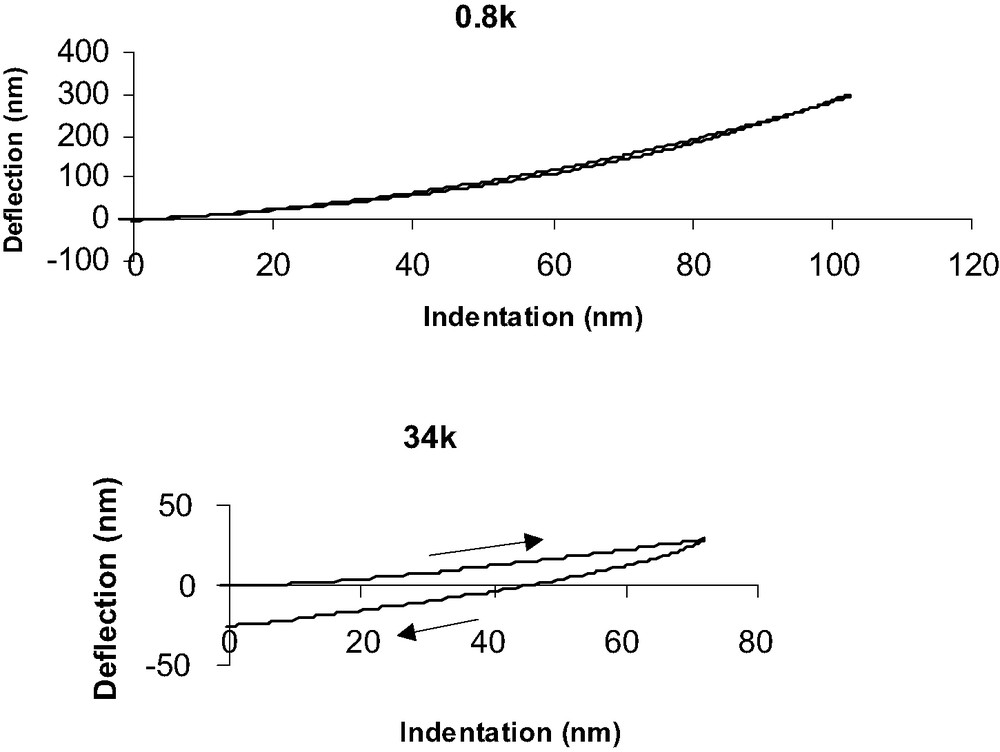
Deflection vs indentation curves for PDMS 0.8 k (top) and 34 k (bottom) samples.
The following ratios (where FadhPDMS and FadhSi represents the adhesion (or pull-off) force measured on respectively PDMS and silicon substrates and X represents the functionality of the grafting) were calculated for all the grafting and PDMS substrates (Table 4) and compared.
Ratio for CH3, NH2 and ungrafted substrates and for three PDMS of different mechanical properties
| PDMS | FPDMS/FSi ratio | FPDMS-CH3/FSi-CH3 ratio | FPDMS-NH2/FSi-NH2 ratio |
| 0.8 k | 1.1 ± 0.1 | 1.0 ± 0.1 | 1.2 ± 0.1 |
| 13 k | 1.8 ± 0.1 | 1.5 ± 0.1 | 1.5 ± 0.1 |
| 34 k | 2.0 ± 0.1 | 1.9 ± 0.1 | 2.6 ± 0.1 |
It appears that for a given PDMS substrate (for example, 0.8 k), the ratios do not depend on the surface chemistry, whereas for a given grafting, the ratios depend on the mechanical properties of the substrate, having the same value for all the grafts. Thus, for a given substrate:
| (8) |
However, for an undeformable substrate, the DMT theory [23] gives:
| (9) |
Then,
| (10) |
| (11) |
| (12) |
This relationship clearly expresses the respective part of the mechanical contribution from the chemical one in a force–indentation measurement with AFM. As C2 is a dimensional constant equal to (2 π R)−1, from eqs. (11) and (12) we propose that:
| (13) |
Average viscoelastic dissipation function (f) and calculated thermodynamic work of adhesion (W0)
| PDMS | Dissipation function f | Work of adhesion W0 (CH3 grafts) (mJ/m2) | Work of adhesion W0 (NH2 grafts) (mJ/m2) |
| 0.8 k | 1.1 ± 0.1 | 35 ± 4 | 107 ± 15 |
| 13 k | 1.6 ± 0.2 | 36 ± 4 | 105 ± 15 |
| 34 k | 2.2 ± 0.4 | 32 ± 4 | 106 ± 15 |
Assuming that the separation of the tip from the polymer sample could be described as a JKR process, it is also possible to determine W0, the thermodynamic work of adhesion. According to JKR formalism [36]:
| (14) |
| (15) |
| (16) |
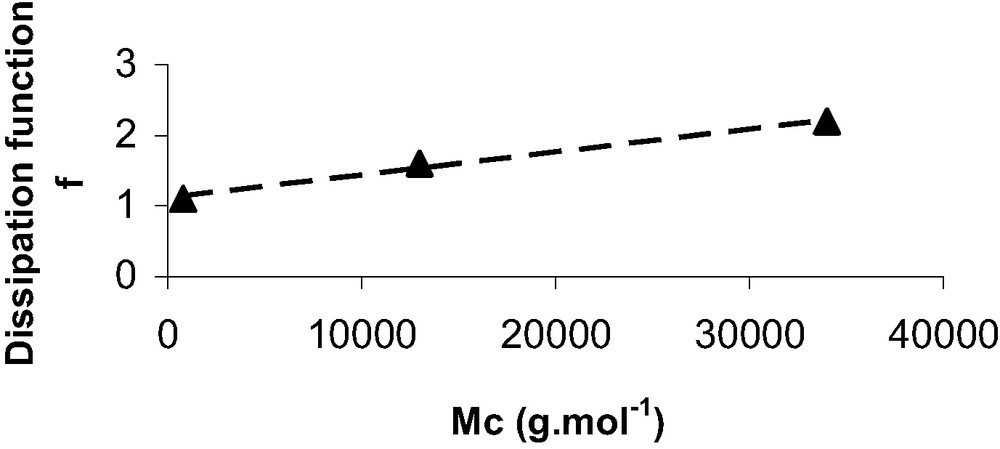
Dissipation function f versus Mc, the average mass between crosslinks.
5 Conclusions
The studied model systems allowed us to express the mechanical and chemical surface contributions in a force curve measurement and to establish a relationship, which is quite similar to the relationship of Gent and Schultz [38] at the nanoscale. From then on, a new relationship is proposed to determine thermodynamic surface properties of viscoelastic materials on the basis of AFM experiments.