

1 Introduction
The performance assessment of an underground geological nuclear waste disposal is one of the major issues of the nuclear fuel cycle. One of the main concerns related to the safe storage of nuclear waste in an underground repository is the migration of radiotoxic elements through the geosphere [1,2]. In this field, the interaction between solute and solid surfaces, which is mainly governed by sorption/desorption processes, is a crucial point. The precipitation/solubility phenomena of the radionuclides have to be taken into account, as well. Therefore, a detailed knowledge of the mineral–water interface is of fundamental interest since the corresponding interfacial reactions play a significant role in the geochemical regulation of metals. They are, however, inherently complex and require to quantify several physico-chemical parameters to build a predictable model. These phenomena depend mainly on parameters such as the pH, the redox potential, the ionic strength of the aqueous medium, the concentration and speciation of the radionuclides of interest (taking into account the solid precipitates), the specific surface area and the density of functional surface groups of the substrate. Different approaches of the sorption processes are usually used: empirical models using a partition factor (Kd), mechanistic models such as macroscopic ion exchange or microscopic surface complexation [3–12]. Nevertheless, using only these models, the experimental data simulations do not give unambiguous results. Indeed, these determinations without any experimental validation could yield, for instance, to the choice of arbitrary surface complexes. Consequently, the precise determination of the corresponding thermodynamic constants is not an easy task and an accurate understanding, at a microscopic scale, of the mechanisms involved is imperative before any modeling. Therefore, it is necessary to relate the expected surface complexes to the structure of the surface coordination complexes. Up to now, most of the published works present a thermodynamic or a structural point of view, but only a few have used structural results as an experimental constraint in the modeling procedure [13–17].
We present, in this review, the necessity of a combined use of four structural techniques, which allows one to investigate the sorption mechanisms at a molecular scale and thus identify the species involved in the retention processes: laser-induced fluorescence spectroscopy (LIFS), X-ray photoelectron spectroscopy (XPS), surface second-harmonic generation (SSHG) and grazing X-ray absorption spectroscopy (GI-XAS). In addition to the experimental investigations, ab initio calculations were also performed. Sorption of the uranyl ion onto montmorillonite and rutile titania will be considered as illustrative purpose to present the applied methodology, since under environmental conditions, uranium typically occurs in the hexavalent form as the mobile aqueous uranyl ion (UO22+). Then, the sorption of this ion onto solid surfaces has been widely studied because this process has a significant effect on transport properties [3,10–12,18–20].
Although the characteristics of clay materials such as low permeability, high sorption capacity and plasticity make them an effective barrier against radionuclides' migration [21], only few works were devoted to the microscopic study of uranium sorption on clay minerals, especially in acidic pH ranges [18–23]. Montmorillonite is a clay mineral formed by two-dimensional sheets of tetrahedral SiO4 alternating with sheets of octahedral Al(O,OH)6 [24]. Its retention capacities for fission products or actinides are acknowledged [22,25–31]. The existence of both exchange and edge sites' surface complexes on montmorillonite were already experimentally demonstrated using molecular spectroscopic probes [22,23,25,32,33]. Because montmorillonite presents several types of sorption sites, uranyl sorption mechanisms on this mineral are expected to be complex. However, based on its alumino-silicate structure, this clay can be viewed as an assemblage of “basic structural units”, which could be represented as “Al-edge site” and “Si-edge site”. Consequently, the investigation of the U(VI) sorption mechanisms onto both alumina and silica solids and the comparison of the obtained results with those obtained for the U(VI)/montmorillonite system have allowed one to clearly identify the sorbed uranyl species on montmorillonite.
The rutile titanium dioxide was considered under both powdered and single crystal forms. Due to its high chemical stability over a wide range of pH values, this solid is an interesting mineral model. Moreover, an average repartition of the different crystallographic orientations of rutile powders has been established, with the TiO2(110) orientation as the main one [34–36]. The aim of the study was to account for the powder retention properties from a molecular study of the different crystallographic planes of titania. Moreover, despite its very particular properties, sorption processes of very few actinides were studied considering this oxide. Then, the structural investigation of the interactions between the hexavalent uranium ion and TiO2 surface appeared particularly pertinent. Finally, to provide support to the experimental investigations, theoretical calculations were performed. As an example, the interactions between uranyl ions and the TiO2(110) single crystal face, using periodic density functional calculations (DFT), are presented. This theoretical modeling allowed one to get information as nature of the sorption sites and relative energy stabilities of the different surface complexes. These results were directly correlated to the experimental ones in order to better understand sorption processes of radionuclides on mineral surfaces.
Finally, the surface complexation modeling of the U(VI) retention data onto both substrates (montmorillonite and titania) which were completed using the obtained structural constraints, will be presented, in this review. The determined sorption constants thus appear more reliable as they take into account several constraints obtained from independent spectroscopic techniques. Moreover, the validity of the sorption constants values can thus be tested, as well, by considering sorption edges obtained for a wide range of experimental conditions and, especially, for low cation concentrations where spectroscopic techniques are not sensitive enough.
2 Summary of substrate characteristics
Prior to the sorption experiments, the Na–montmorillonite (Wyoming bentonite, marketed under the name Volclay) was first treated to remove the soluble phases (such as calcite) and to condition the clay as homoionic [16]. Nevertheless, a low percentage of silicated phases was still present (lower than 10% in weight: quartz, albite/orthose) as observed by Electron Probe MicroAnalysis [16].
The specific surface area of the clay was found to be 35 m2/g determined by N2-BET analysis [16], and the cation exchange capacity (CEC) was 63 meq/100 g [37]. Reference oxide compounds (a silica gel and a γ-alumina), purchased from Merck, were used without further purification. The N2-BET specific surface areas of alumina and silica were determined and found to be 140 and 380 m2/g, respectively [38,39].
The titanium dioxide single crystals (Cerac) were used without any further treatment. Each crystal was 10 × 10 mm and 1 mm thick with two polished faces and the (110), (111) and (001) crystallographic orientations were considered. The rutile powder (Cerac) was thoroughly washed with deionized water until the pH and the conductivity of the supernatant kept constant. The corresponding specific surface (N2-BET method) was found to be 4.9 m2/g [40].
Uranium(VI) stock solutions were prepared by dissolving a known amount of UO2(NO3)2·6H2O (Merck) in an acidified NaClO4 solution (pH = 1). The stock solution concentrations were between 10−3 and 10−2 M [16,40]. The exact uranyl concentrations were measured by α-liquid scintillation counting using a TRI-CARB spectrometer supplied by Packard (Camberra Co., Meriden, CT) and the Alphaex™ scintillation cocktail according to a protocol described in the literature [41].
3 Results and discussion
3.1 Surface sites' identification and surface acidity constants
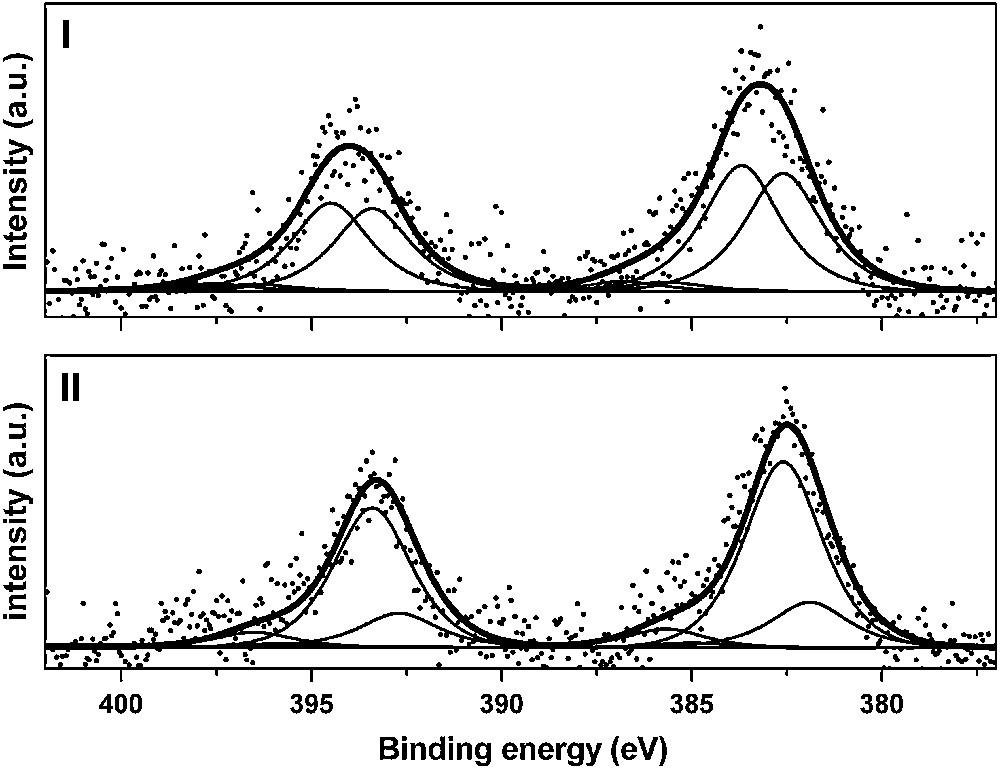
As underlined before, rutile is mainly composed of the (110) crystallographic orientation. As shown in Fig. 1, three types of surface oxygen atoms can be expected to react with uranyl ion: three-fold coordinated oxygen (referred to as surface oxygen in the text and denoted Os), two-fold coordinated (referred to as bridging oxygen and denoted Ob) and single-fold ones (referred to as top oxygen and denoted Ot). The first step of this study was to investigate the hydrated surface in order to clearly identify the surface groups. To reach that goal, titanium dioxide has been considered under both powder and single crystal forms. First, O1s XPS spectra were collected in a direction normal to the (110) single crystal face (Fig. 2(I)). In such experimental conditions, three components were clearly observed: 529.7, 531.0 and 532.2 eV. The main contribution was attributed to the bulk oxygen atoms (529.7 eV). When the sample was tilted, a fourth component, located at 533.5 eV, was also observed (Fig. 2(II)). The relative intensities of the 531.0, 532.2 and 533.5 eV contributions were strongly promoted by the crystal rotation, which led to assign these components to surface species [40]. The two first ones, located at 531.0 and 532.2 eV, were observed either for the photoelectrons' collection along the normal of the sample or at grazing angle of detection. According to the literature [42–44], they were addressed to the two-fold and to single-fold oxygen atoms, respectively. The weakest contribution (533.5 eV) was attributed to the oxygen of molecular physi-sorbed water (noted Ow). Thus, it was concluded that three kinds of oxygen atoms exist on the TiO2(110) surface: three-fold surface oxygen atoms (Os) almost identical to bulk ones (529.7 eV), two-fold ones (531.0 eV, noted Ob) and single-fold ones (532.2 eV, noted Ot). This interpretation was consistent with the number of titanium atoms surrounding the oxygen surface species: the lower the number of titanium atoms, the higher the binding energy. For the powder, four contributions to the O1s signal were observed located at 529.6, 531.0, 532.2 and 533.2 eV, respectively, in perfect agreement with the results obtained for the single crystal [40]. The (110) crystallographic face appeared thus well adapted as a model for the powder surface properties.
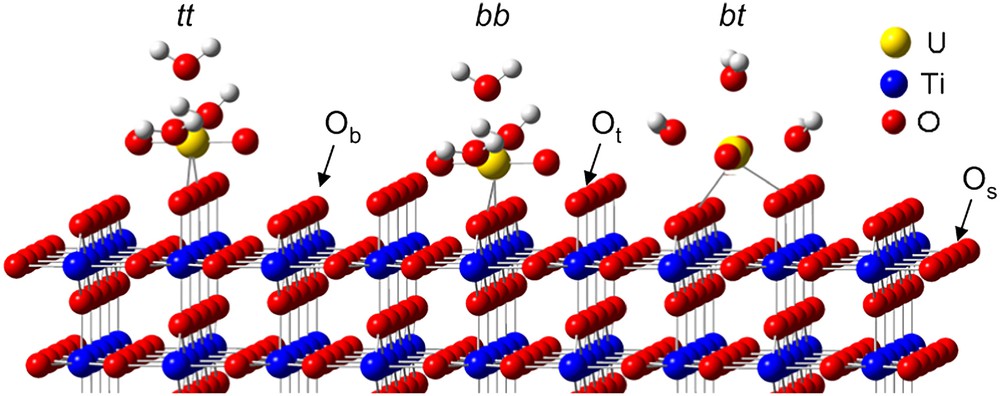
(110) crystallographic face. Os, Ob and Ot denote three-fold, two-fold and single-fold surface oxygen atoms, respectively. The three possible bidentate uranyl surface complexes are also represented: tt for top–top complex, bb for the bridging–bridging complex and bt for the bridging–top one.
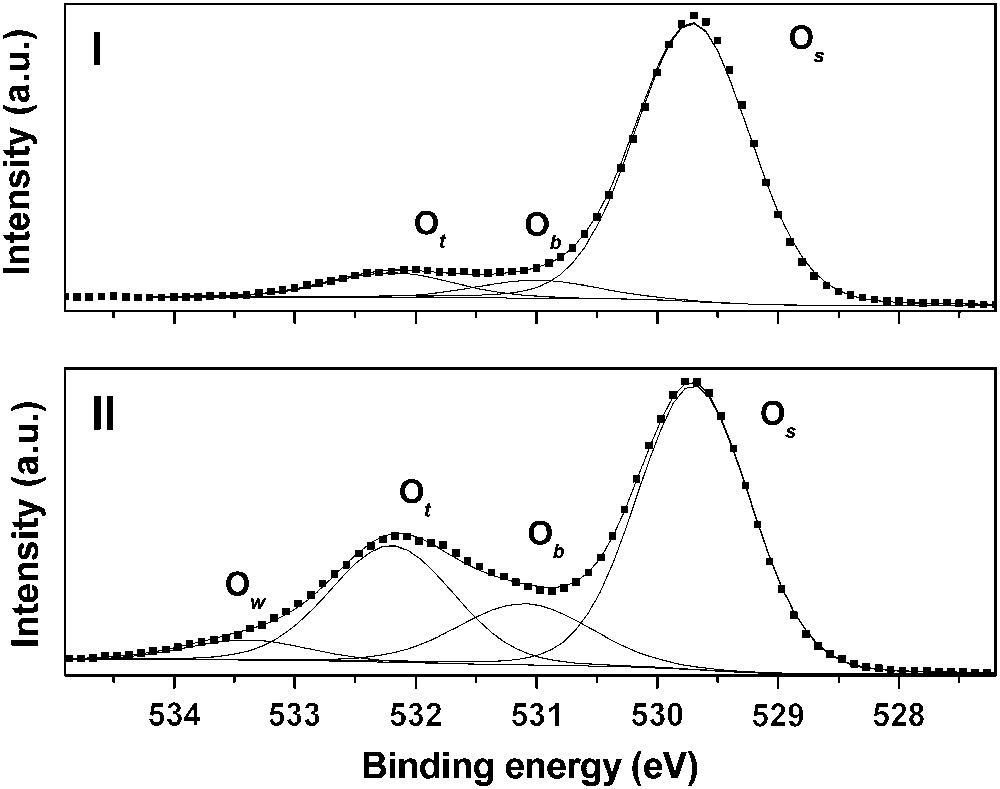
O1s XPS spectrum of the rutile (110) crystallographic face: (I) collection along a direction normal to the surface of the crystal and (II) tilted (70°) sample. Os refers to three-fold coordinated oxygen atoms, Ob denotes two-fold oxygens, Ot denotes single-fold ones and Ow refers to molecular physisorbed water.
The surface sites being identified, the next step was to calculate the surface acidity constants using a crystallographic model. The MUSIC model based on the Pauling bond valence concept has been developed by Hiemstra et al. and has been widely described in the literature [45–48]. It is a correction of the basic Pauling bond valence concept in order to take into account the metal–oxygen distances' distribution in solids (actual bond valence concept). According to Brown and Altermatt [49], a well known empirical expression can be used to determine the actual bond valence, which allows one to calculate the surface acidity constants for each crystallographic planes. Moreover, it has been established that the rutile powder is mainly composed of three types of crystallographic orientations: (110) for 60%, (100) and (101) for 20% each [35,36]. Then, the crystallographic repartition being known for the powder, the surface acidity constants being determined previously [47], using the MUSIC model, it was possible to fit the potentiometric titration curves with a very restricted number of adjustable parameters. The fit of the titration curves was performed considering the constant capacitance model included in the FITEQL code, an iterative non-linear least squares optimization program [50,51]. All the titration curves (various ionic strengths) were successfully fitted considering the same inner-capacitance value (1.5 F/m2), the experimental repartition of the crystallographic orientations together with the crystallographic density of surface sites (5.2, 7.4 and 7.8 sites/nm2 for (110), (100) and (101), respectively) and the calculated acidity constant (MUSIC approach).
3.2 Identification of the U(VI) surface complexes
3.2.1 Clay mineral
3.2.1.1 U(VI)/Na–montmorillonite
The reported uranyl sorption edges on Na–montmorillonite are presented in Fig. 3. It was shown that below pH 4, the U(VI) sorption rate slowly increased and the amount of sorbed uranium depended on both the ionic strength and the cation concentration [16]. The greater the ionic strength (or metal concentration), the lower the sorbed amount. This behavior has been demonstrated as typical of an interaction between the uranyl ions and the permanently negative charged sites, called exchange sites [10,52], involving the formation of outer-sphere complexes. For greater pH values (from 4 to 6), the sorption rate increased rapidly and the uranyl sorption rate reached 100%.
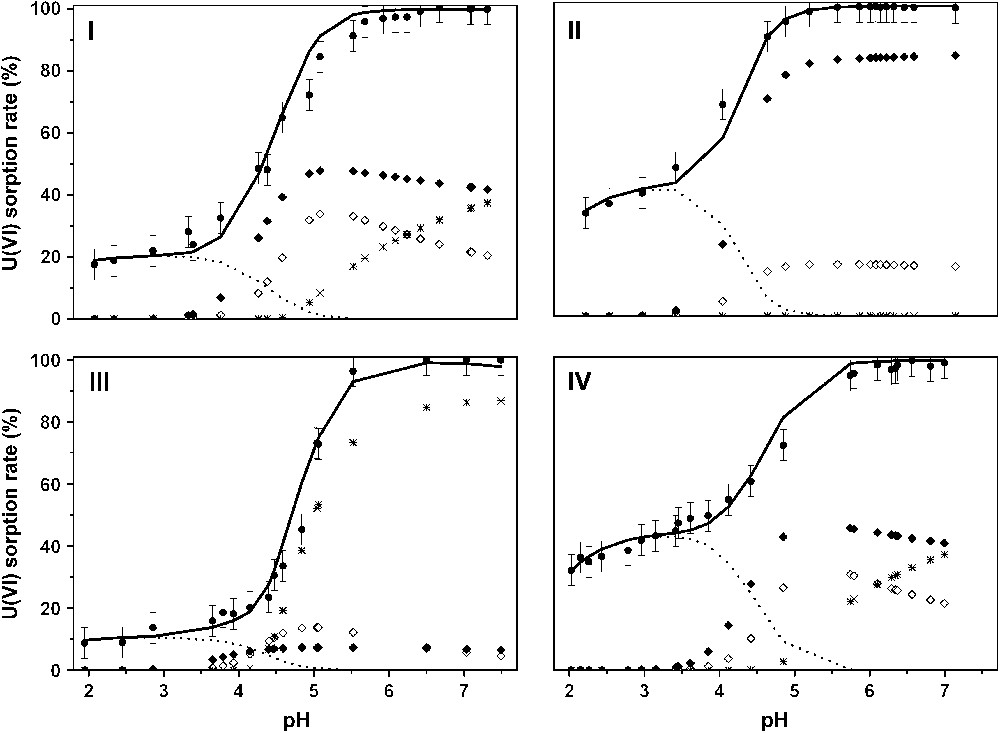
U(VI)/montmorillonite sorption edges and calculated surface complexes' repartition versus pH: (I) [U(VI)] = 10−4 M, I = 0.5 M; (II) [U(VI)] = 10−4 M, I = 0.1 M; (III) [U(VI)] = 10−3 M, I = 0.5 M; (IV) [U(VI)] = 10−6 M, I = 0.1 M. Experimental points (dots), calculated curve (straight), (dotted line), (full diamonds), (open diamonds) and (crosses).
Representative emission spectra of the uranyl ion sorbed on the Na–montmorillonite prepared in NaClO4 solution at different pH values are presented in Fig. 4. It was shown that both the ionic strength and the pH values have a strong influence on the shape of the emission spectra. Moreover, for pH values lower than 5, the most intense emission band was located at 522 nm and the corresponding lifetimes were determined to be 10 ± 2, 55 ± 6 and 190 ± 20 μs. Additionally, experiments conducted for pH value lower than 3 and 0.05 M as ionic strength (in these conditions, ion exchange process became dominant) showed that only the decay time at 10 μs was measured (Table 1). When the pH value was increased (from 5 to 8), the main fluorescence band shifted towards greater wavelengths: 526 nm. In the same time, a new lifetime (400 ± 30 μs) was measured while the decay time at 10 μs disappeared. Under these pH conditions (top of the sorption edge), three decay times were necessary to properly fit the decay curves: 55, 190 and 400 μs (Table 1), indicating that different environments for the sorbed uranyl ion exist on the clay.
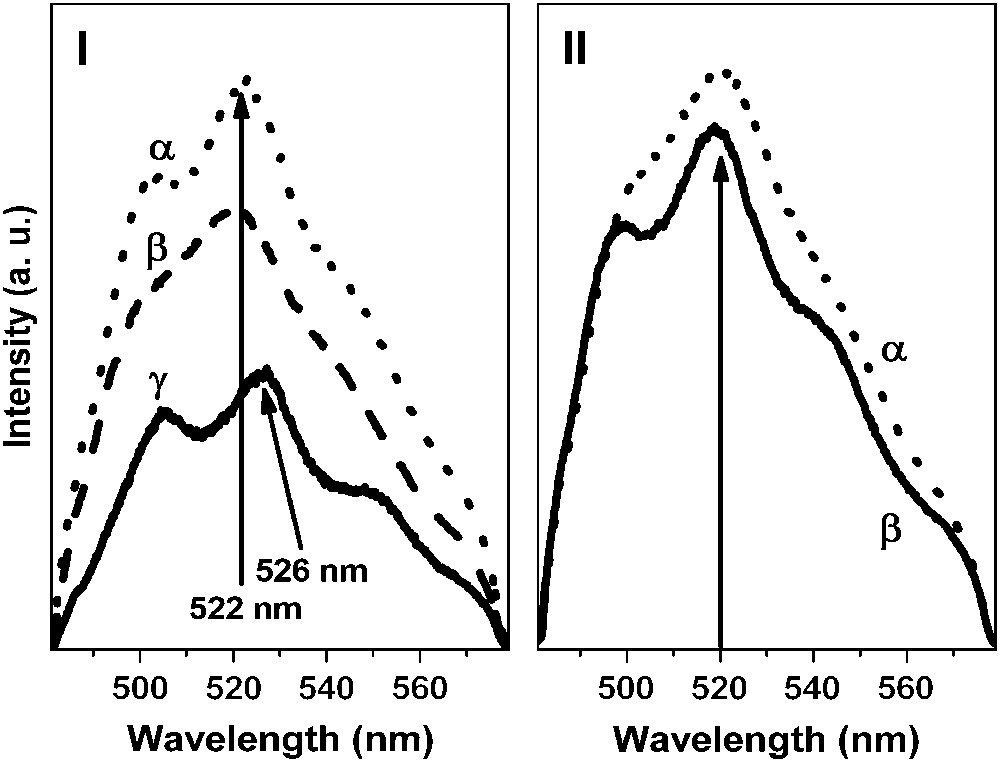
Fluorescence spectra of U(VI) sorbed onto Na–montmorillonite versus pH and ionic strength. I: I = 0.5 M, [U(VI)] = 10−4 M: pH = 4.2 (α), pH = 5.1 (β) and pH = 8.0 (γ). II: [U(VI)] = 10−4 M, pH = 5.1: I = 0.5 M (α) and I = 0.05 M (β).
Spectroscopic characteristics versus pH of U(VI) species sorbed onto the Na–montmorillonite
| pH value | U 4f7/2 binding energy (eV) | Lifetimes (μs) | |||||
| pH < 3 | 383.7 | 10 | |||||
| 4 < pH < 5 | 383.7 | 382.6 | 10 | 55 | 190 | ||
| pH > 5 | 382.6 | 381.9 | 55 | 190 | 400 |
In order to check and corroborate these first results, XPS analysis was carried out on the same samples [16]. When the ionic strength of the suspension was maintained at 0.05 mol/L and the pH kept to 4, the corresponding U 4f7/2 XPS spectrum (Fig. 5(I)) was fitted with two components: 383.7 ± 0.3 and 382.6 ± 0.3 eV (FWHM = 2.3 eV). For samples prepared at pH higher than 5 (Fig. 5(II)), two components were also necessary to fit the U 4f7/2 peak: 382.6 ± 0.3 and 381.9 ± 0.3 eV (FWHM = 2.3 eV). The component located at 382.6 eV was not dependent on the pH values (above 4). The highest binding energy (383.7 eV) was observed for low pH values and vanished for higher pH while a low binding energy (381.9 eV) appeared for pH greater than 5.
U 4f XPS spectra (experimental and fit) of U(VI) sorbed onto Na–montmorillonite: [U(VI)] = 10−4 M, I = 0.1 M. (I) pH = 4.2 and (II) pH = 5.9.
Thus, the results obtained from both spectroscopic techniques were perfectly correlated and showed that the interactions between U(VI) aqueous species and the montmorillonite clay depended on the pH value (Table 1). To have a deeper understanding of the reaction involved in the sorption mechanisms, the U(VI) sorption onto both alumina and silica (seen as the “basic structural units” of the clay) was carried out [16].
3.2.1.2 Reference systems: U(VI)/alumina and U(VI)/silica
Whatever the pH values, the emission spectra obtained for U(VI) sorbed on γ-alumina (not shown here) were found to be quite identical (maxima at 497, 518 and 540 nm) but the associated fluorescence lifetimes depended, however, on the pH values: for pH values lower than 5, only one species (τ1 = 45 ± 5 μs) was observed, while for pH values higher than 6, two uranyl lifetimes were measured: τ1 = 45 ± 5 and τ2 = 120 ± 10 μs. The longer value, τ2, was interpreted as the sorption of a hydrolyzed and/or polynuclear species, present in the suspension as calculated using Chess2.5 [53]. The uranyl sorbed species observed at pH values lower than 5 (45 μs) was also identified by a single U 4f7/2 binding energy located at 381.8 ± 0.3 eV, whereas for higher pH values the second component located at 380.2 ± 0.3 eV was associated to the second species (τ2). This behavior (U(VI)/alumina complexes depending on the pH value) had been previously reported in the literature [22].
All spectroscopic results were compared with the U(VI) speciation, leading to address the uranyl species characterized by the τ1 and 381.8 eV values to the free UO22+ ion sorbed on the aluminol sites (Table 2) and the second species (τ2 and 380.2 eV) was suspected to arise from the interaction of aluminol surface sites and a hydrolyzed species, the (UO2)3(OH)5+ complex for instance (Table 2), in agreement with other published works [22].
Spectroscopic characteristics of U(VI) species sorbed onto silica and alumina surfaces and corresponding attribution
| Lifetime (μs)/binding energy (eV) | Attribution of U(VI) sorbed species |
| 120/380.2 | (UO2)x(OH)y(2x−y)+ on Al2O3 |
| 45/381.8 | UO22+ on Al2O3 |
| 400/381.8 | (UO2)x(OH)y(2x−y)+ on SiO2 |
| 65/382.2 | UO2H3SiO4+ on SiO2 |
| 180/383.3 | UO22+ on SiO2 |
The LIFS study was completed for samples prepared between pH 3.5 and 8.0. The emission bands (not shown here) for pH values around 4 (498, 518 and 541 nm) were found to be red shifted when the sorption pH value was increased (506, 528 and 552 nm for pH ranging from 6 to 8). In addition, when the sorption pH value was lower than 5, two fluorescence lifetimes were identified at 65 ± 6 and 180 ± 20 μs. Finally, above pH 6, two lifetimes were needed to fit the fluorescence decays: 180 μs was still observed and a new value (400 ± 30 μs) was observed, while the value at 65 μs disappeared. Between pH 5 and 6, these three fluorescence lifetime values were necessary to adjust the fluorescence decays. This behavior indicated the presence of several uranyl complexes on the silica surface depending on the pH value. Moreover, these results were corroborated to those obtained by Gabriel [54]: decay time values of 170 and 360 μs had been identified for uranyl ions' sorption (10−6 M) on another similar silica (Aerosil 200, Degussa).
For samples prepared around pH 4, the XPS spectrum was fitted with two components (U 4f7/2): 382.2 and 383.3 eV (FWHM at 2.3 eV). For a sample prepared at pH 6.4, the fit was completed considering two components as well: the first value was located at 383.3 eV, while the second one at 381.8 eV, was rather different than the binding energy at 382.2 eV. This result was interpreted as the formation of a new surface species. Consequently, the LIFS and XPS results (three sorbed uranyl species on silica, depending on the pH value) were in very good agreement.
The identification of three surface complexes was explained by taking into account the amount of dissolved silicates released by the silica ([Si]solution ∼ 2 × 10⁻³ M) [54,55]. According to the uranyl speciation, the two surface complexes (65 μs; 382.2 eV) and (180 μs; 383.3 eV) were tentatively attributed to the sorption of the main aqueous species, UO22+ and UO2H3SiO4+, onto silanol sites (Table 2). Moreover, as the 170 μs value was allocated to the SiO2UO2 surface species by Gabriel [54], the surface species (180 μs; 383.3 eV) was related to the sorption of UO22+ onto silica. Finally, the third lifetime value (400 μs), only observed for the higher pH values, was addressed to the sorption of hydrolyzed uranyl species such as (UO2)3(OH)5+ for instance [56], according to Sylwester et al. [22] who had shown, using XAS, the presence of U–U backscattering in the case of U(VI) sorbed onto silica at pH around 6.
3.2.1.3 Conclusion about U(VI) sorbed species on montmorillonite
The identification was realized by comparing the spectroscopic signals (LIFS and XPS) obtained for the Na–montmorillonite (Table 1) with those obtained for the reference solids (SiO2 and γ-alumina) (Table 2). It was verified that, for these three systems, no precipitate was formed at high pH values during the sorption process. The XPS measurements did not give any evidence for the presence of neither U(VI)-carbonate solids (C1s line) nor U(VI)-hydroxide such as schœpite, for instance [16].
- i) (10 μs; 383.7 eV): this species was only observed at low pH values and for montmorillonite. This value at 10 μs, which was close to the ones usually measured for the uranyl ions in solution (between 2 and 10 μs), was attributed to the uranyl species located in the exchange sites, where the metal ion is surrounded by water molecules as an outer-sphere complex [18]. Similar conclusion had also been reported for other cations [57]. Moreover, this interpretation was supported by the fact that the unusually high binding energy (383.7 eV) was not observed on the reference samples, which indicated that this energy corresponded to uranyl sorbed in the interlayer space of the clay, as supported by other studies performed with Eu(III) [17]. The spectroscopic parameters (10 μs; 383.7 eV) were then definitely attributed to the uranyl ion sorbed in the interlayer space.
- ii) (400 μs; 381.9 eV): this decay time value was observed with silica for pH > 6, as well and the binding energy was close to the one measured for the uranyl ion sorbed on silica (381.8 eV). Therefore, it was concluded that these spectroscopic parameters corresponded to the U(VI) species (postulated polynuclear one) sorbed onto “silanol” edge sites of montmorillonite.
- iii) (55 μs; 382.6 eV): these parameters were measured whatever the pH value of the suspension above 4. Moreover, 55 μs was found to be very close (within the uncertainties) to the values obtained for the sorption of UO22+ onto alumina (45 μs) and for the sorption of UO2H3SiO4+ onto silica (65 μs). As the quantity of the dissolved silicates arising from the dissolution of montmorillonite was around 1.5 × 10⁻⁴ M in the experimental conditions (ICP-AES measurements), the amount of UO2H3SiO4+ aqueous complex was less than 10%, in good agreement with the work of Wanner et al. [58]. Consequently, the complexation of U(VI) by silicates was negligible and therefore the (55 μs; 382.6 eV) parameters were attributed to the sorption of free uranyl ion onto “aluminol” edge sites.
- iv) (190 μs): this value, observed whatever the pH investigated (above 4), was very close to the one attributed to the sorption of free UO22+ onto silica (180 μs) and was attributed to the sorption of free uranyl ion onto “silanol” edge sites of the clay. This conclusion was supported by the work of Hennig et al. [26] and Dähn et al. [59] who had shown, using XAS, that “Al-edge site” sites were active towards cations' retention. However, as the binding energy at 383.6 eV was correlated to the lifetime at 10 μs, the binding energy located at 382.6 eV was interpreted as an average binding energy value correlated to both species characterized by the decay times 55 and 190 μs.
3.2.2 U(VI)/TiO2
Considering the crystallographic structure of rutile, the (110) face presents a surface oxygen density around 6 atoms/nm2. Then, for the powder, the mass-over-volume ratio being equal to 20 g/L ([U(VI)]ini. = 10−4 M) the maximum surface coverage was 20% of a monolayer. For the single crystals, an initial uranium concentration as low as 10−7 M was considered to have a similar surface coverage as for the powder. Moreover, higher uranyl concentrations (10−4 and 10−2 M) were also considered and in such cases the absence of U(VI) precipitation was checked by AFM measurements. No evidence for precipitation was found [40], in agreement with previously published results obtained using XAS [60]. To identify both sorption sites on the oxide and uranyl surface complexes, LIFS spectroscopy was performed for both single crystals and the powder [40].
3.2.2.1 Powder
The uranium retention by rutile surface was studied as a function of the pH of the suspension. Then, different samples corresponding to the whole sorption edge were analyzed (pH ranged from 1 to 5).
The shape of the uranyl emission spectra was found to be dramatically affected by the equilibrium pH value (not shown here). Two series of emission bands were clearly observed for all samples indicating the presence of two uranium environments on the surface. Moreover, the positions of the emission bands were unchanged whatever the pH value (from 3 to 5), leading to conclude that the nature of the uranium surface complexes did not depend on the uranyl speciation. The relative intensity of the second series, denoted B (498/519/542 nm), was found to increase as the sorbed amount increased. While series B presented a low intensity at low pH (relative to series A: 493/514/537 nm), the respective intensities of both series were quite similar for the highest sorbed amount. These observations were corroborated by the lifetime calculations. Whatever the equilibrium pH value, two decay times were needed to properly fit the decay curves (55 and 185 μs), which was another evidence for the presence of two uranium surface complexes. Additionally, time resolved experiments were carried out and it was shown that the shorter lifetime (55 μs) was correlated to series A while 185 μs was related to series B.
Thus, the following spectroscopic characteristics were proposed for the two uranium surface complexes: 493/514/537 nm, 55 μs for complex 1 and 498/519/542 nm, 185 μs for complex 2 [40].
In order to understand deeper the reaction mechanisms, complementary studies were carried out considering single crystals.
3.2.2.2 Rutile TiO2(110)
Investigations were carried out on three (110) single crystals on which uranium ions had been sorbed at different initial concentrations (10−7, 10−4 and 10−2 M) in order to check the effect of the surface coverage. Fluorescence spectra exhibited the same emission bands as the one observed for the powders (Fig. 6): 493/514/537 nm (series A) and 498/519/542 nm (series B). Nevertheless, while series A was the most intense one for the lower concentrations (Fig. 6β), series B became the more intense one for [U(VI)] = 10−2 M (Fig. 6α). This observation led to conclude that the same surface species were formed for both experimental conditions and that only their respective proportions were depending on the surface coverage [40]. In addition, two associated decay time values were found for both samples (55 and 185 μs), which support the existence of two uranyl surface complexes.
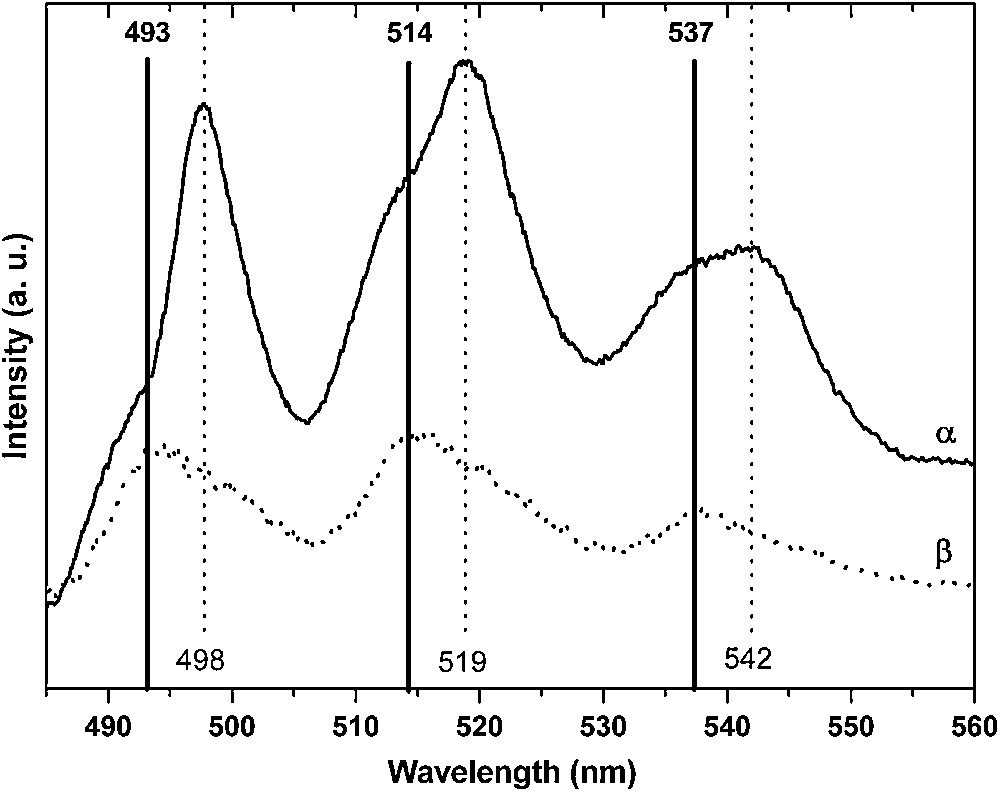
Uranyl emission spectra of U(VI) sorbed onto the (110) rutile face for [U(VI)] = 10−2 M (α) and [U(VI)] = 10−4 M (β).
3.2.2.3 Identification of the U(VI) sorption species on TiO2
The main assumption to interpret the sorption mechanisms was that only the existing uranium species in solution were expected to lead to the formation of surface complexes. In perchlorate medium, only the free uranyl species is present in solution until the pH 3.5 and remains the main one until pH 5. For the highest pH values considered, some hydroxylated species are present in solution such as UO2(OH)+, (UO2)2(OH)22+ and (UO2)3(OH)5+ [61–64]. Whatever the equilibrium pH value, the spectroscopic characteristics of the sorbed uranium surface complexes were the same indicating that their nature did not depend on the pH value (from 1 to 5). It was then concluded that the two observed surface complexes involved the reaction of free uranyl ion (UO22+) with two different surface sites. To identify the nature of both reactive surface sites, the results obtained for rutile powder and single crystals were compared.
EXAFS results had already been published about the U(VI)/TiO2(110) face and U(VI)/rutile powder, considering similar experimental conditions [60]. This study had shown that uranyl ion was sorbed as a bidentate inner-sphere complex (U–O = 2.31 Å for the (110) orientation and 2.33 Å for the powder). Then, from a crystallographic point of view, three kinds of surface sites were postulated: bridging–bridging site (noted bb), top–top site (noted tt) and a bridging–top one (noted bt), as shown in Fig. 1. Nevertheless, from the spectroscopic investigation performed for both powder and (110) rutile, it was clear that only two of these three sites were reactive towards the UO22+ ion.
The study of the rutile (111) brought further information to discriminate between the different expected surface sites. For this plane, the distance between two top oxygen atoms is 5.46 Å, thus, the formation of one uranyl bidentate surface complex with U–O distances equal to 2.3 Å was impossible. Then, only the sorption of uranyl ion onto bridging–bridging (bb) and bridging–top (bt) oxygen atoms was expected, assuming that the EXAFS results obtained for the (110) crystallographic orientation were still valid for the (111) one. To verify this assumption, LIFS experiments were performed on the U(VI)/TiO2(111) system. It was demonstrated the U(VI) surface complexes were the same (same spectroscopic parameters) for the (111) and (110) orientation, validating the use of EXAFS results obtained for the (110) crystallographic plane. Thus, the study of the (111) crystallographic plane allowed one to conclude about the nature of the reactive sites towards free uranyl ion sorption onto TiO2(110) and rutile powder: one surface site was composed of two bridging oxygen atoms while a second one involved one bridging oxygen and one top oxygen atom [40].
The spectroscopic investigation had also shown that one of these sites was more reactive than the second one for the lowest pH values. The last point was to determine which site was the more reactive one. Surface second-harmonic generation (SSHG) study on the U(VI)/TiO2(001) as a function of initial U(VI) concentration was considered to answer this question [65]. It was shown that, in agreement with GI-XAS experiments, the SSHG signal can be interpreted by considering two different sorption sites: the first one, the more reactive one, was composed by two bridging oxygen atoms (bb sites) while the second one, less reactive, was composed by one bridging and one top oxygen atom (bt sites). Some spectroscopic measurements were performed considering the U(VI)/TiO2(001) system. All the spectroscopic characteristics of the uranium(VI) surface complexes were found to be identical to the ones observed for the (110) crystallographic face. The U(VI) surface environment was found to be identical for (001) and (110) crystallographic faces, which justified the use of SSHG results obtained on (001) face to interpret the (110) results, as previously shown for cobalt on the same substrate [66].
The comparison of the results obtained for different U(VI)/rutile systems has allowed one to definitely conclude about the nature of the uranium surface complexes on the rutile powder as a function of the pH value [40]. For pH corresponding to the bottom of the sorption edge, free uranyl ion was found to react with strong surface sites, which involved two bridging oxygen atoms. Then, as the pH increased, another surface species was formed arising from the reaction between free uranyl ion and a weak surface site composed by one bridging and one top oxygen atom.
3.3 Theoretical investigation of the uranyl ions' interactions with TiO2(110)
The uranyl ion is known to be pentahydrated in aqueous solution while it sorbs as a bidentate complex with an inner-sphere mechanism on the TiO2 rutile (110) face with three water molecules to saturate its first hydration shell [60]. Calculations were first performed on the hydrated uranyl ion with several numbers of water molecules (up to six). Several structures with water molecules in the first and in the second hydration shell were considered [67]. For these calculations, the molecular systems were placed in a (10 Å)3 cell with a 2+ net charge. The pentahydrated structure was determined as the most stable one and the GGA optimized parameters [d(UO) = 1.78 Å, d(U–Owater) = 2.46 Å and θ(OUO) = 179.7°] [68] were in good agreement with experimental data (1.77 ± 0.02 Å, 2.42 ± 0.02 Å and 180°, respectively) and previous theoretical calculations (MP2: 1.77 Å, 2.46 Å, 180°, respectively) [69,70].
Then, the rutile bulk parameters were calculated. These first calculations were performed using different sets of k-points and energy cutoff in order to optimize them. The bulk rutile unit cell is tetragonal with a = b = 4.587 Å, c = 2.954 Å, internal parameter x = 0.305 and c/a = 0.644 [71]. The calculated parameters (a = b = 4.649 Å, c = 2.972 Å, internal parameter x = 0.304 and c/a = 0.640) were obtained with an optimized 5 × 5 × 5 k-point mesh and a 350 eV energy cutoff. They were in agreement with the experimental ones as well as with previous theoretical works [72]. These optimized bulk values were used to build starting surface geometries.
In order to optimize a good model to mimic the real TiO2(110) surface, the surface energies of different slab thickness were calculated (from 1 to 15 layers) of the dry TiO2 rutile (110) face (which means without terminal oxygen atoms). Surface energies were calculated using Eq. (1):
| (1) |
However, due to the solvent interaction (water molecules) at the interface, a new surface oxygen species was introduced on the top of each titanium atom (noted Ot in Fig. 1) as previously observed by XPS measurement. In addition, to simulate experimental low pH conditions, each reactive surface oxygen species was saturated with protons: all terminal (bridging) oxygen atoms were saturated with two (one) protons. The surface dimension of the supercell is equivalent to 13.2 × 8.9 Å2 (the total supercell contains up to 200 atoms calculated at the Γ point). On this large surface, the uranyl ion should not interact with its images (d(U–U)min = 8.9 Å) in agreement with EXAFS data where no uranium–uranium interactions were detected on the surface [60]. The first hydration sphere of the uranyl ion was saturated with three water molecules to keep its pentadentate equatorial structure. The three structures displayed in Fig. 1 were optimised: the bond lengths were compared to the EXAFS results and the relative uranyl sorption energies were calculated (Table 3). The sorbed uranyl ion has been found not linear contrary to the pentahydrated form as recently calculated by Moskaleva et al. [76] on alumina surface. This bending decreases the overlap between the uranium atom and the two axial oxygen atoms leading to a larger UO bond length: the more the uranyl ion was bended, the larger the UO distances were. The easy bending of the uranyl ion was certainly related to the low bending frequency calculated (between 100 and 180 cm−1 according to the exchange-correlation functional used) [69,70]. Such a lengthening was also partially due to the GGA formalism, which is known to slightly overestimate the distances. The local density approximation (LDA) leads to relatively shorter distances by up to 0.02 Å only. However, the GGA approximation provides more accurate energy than the LDA one for molecular species. The calculations have thus been consistently performed in GGA. Furthermore, the U–Owater distance overestimation (∼0.15 Å) was interpreted as a lack of the solvent effects. Finally, looking at the U–Osurface distances, the EXAFS average distance (obtained from the two U–Osurface bonds: 2.31 ± 0.02 Å), was found to be consistent with the calculated average distances of the bb and the bt structures (2.28 and 2.25 Å, respectively). Regarding the relative sorption energies of the uranyl ion, it appeared that the bb and the bt structures were the most stable ones. The third structure, the tt one, was 13.6 kJ/mol less stable than the bt one, which agreed with the previous experimental results: only two uranyl surface complexes were observed (on bb and bt sites) [68]. Finally, even if the two most stable surface complexes were close in energy, the uranyl sorption, on the bb site, corresponded to the most stable structure, which also agreed with the experimental data [40].
3.4 Surface complexation modeling
The spectroscopic results were used as experimental constraints for the thermodynamic modeling of the sorption edges (montmorillonite and titania) in order to calculate the thermodynamic constants associated to the sorption equilibria. A multisite surface complexation model was considered. The modeling was realized using the constant capacitance model included in the FITEQL3.2 code [51].
3.4.1 U(VI)/montmorillonite
As many XAS investigations had shown that uranyl was sorbed onto several mineral substrates as bidentate surface complexes [60,77–79] as well as for montmorillonite [26], the formation of monodentate surface complexes was excluded. The hydrolysis and aqueous complexation constants used to account for uranyl chemistry were those reported by Grenthe et al. [61,62] and Moll et al. [80] for uranyl complexation with silicic acid. The surface characteristics of the Na–montmorillonite had been described in the literature for experimental conditions close to the ones considered here (Table 4) and also by using the same surface complexation model (Constant Capacitance Model) [37,81]. The inner-layer capacitance value considered in the simulations (1 F/m2) was in the range of the empirical values commonly used for the oxide-like minerals [82]. This value was kept constant, which appeared as a reasonable assumption since the variation of the ionic strength for the sorption edges was only from 0.1 to 0.5 M. The best fits were obtained considering the following sorption equilibria [16]:
Acid–base surface reactions and associated constants for montmorillonite (at zero ionic strength)
| Acid–base equilibria | log K |
| −9.4 | |
| 7.9 | |
| −7.8 | |
| 1.0 |
The calculated constants, corrected to zero ionic strength (Davies equation), were found to be as follows:
The same set of surface complexation constants was able to successfully account for all the different sorption conditions, various ionic strengths and uranium concentrations (Fig. 3). Moreover, the surface species repartition diagrams (Fig. 3) were found to be in quite good agreement with the structural results: for example, three surface species at pH values ranging from 4 to 5.
3.4.2 U(VI)/TiO2
The U(VI)/titanium dioxide system was successfully fitted considering all the spectroscopic constraints and the surface acidity constants determined from the MUSIC approach [47]. The following equilibria were considered (Ti(1)O denotes top oxygen atoms, and Ti(2)O refers to bridging ones):
The intrinsic sorption constants for both experimentally identified surface species were found to be equal or close whatever the crystallographic face considered: log Kbb ≈ 3.5 for the sorption of uranyl ion onto bridging–bridging sites and bridging–top sites for both (110) and (100) crystallographic orientations; log Kbt ≈ 1.3 for the sorption of uranyl ion onto bridging–bridging sites and bridging–top sites for the (101) crystallographic orientation. Nevertheless, the surface species repartition calculated showed that the bridging–bridging U(VI) surface complexes were found to be the main ones for low pH values while for higher pH (above 4) the bridging–top complexes became the major ones.
4 Conclusion
An accurate description of the mechanisms involved at the solid/solution interface is of fundamental interest, especially in the field of radioactive wastes' storage. Indeed, sorption/desorption phenomena of radionuclides mainly govern their migration in the geosphere. Moreover, their quantification and qualification are of primary importance. Therefore, a molecular approach was developed in order to experimentally determine all the components involved in the radionuclides' retention process. Then, the coupling of complementary spectroscopic techniques such as laser-induced fluorescence, X-ray photoelectron spectroscopy, surface second-harmonic generation and X-ray absorption spectroscopy constitute very powerful tools to reach that goal. Additionally, quantum chemistry calculations have to be considered as well in order to provide support to the experimental results in order to get a deeper understanding of the nature of the bound between the sorbed metal ion and the mineral surface. Two examples were considered to illustrate this approach: a clay mineral, relevant for nuclear waste storage and a titanium dioxide as methodological solid.
The clay mineral under interest was the Na–montmorillonite. Nevertheless, since this material is rather complex because it presents several types of expected sorption sites, the use of reference solids (alumina and silica) seen as the “basic structural units” of the clay was necessary to unambiguously identify the U(VI) sorption mechanisms on this substrate. It was shown that for low pH values (under 4) the U(VI) retention involves the formation of an outer-sphere complex in the interlayer space of the clay. Moreover, for higher pH values, additional sorbed species were identified, involving the formation of inner-sphere surface complexes. It was shown that in this experimental conditions the U(VI) retention occurs via the sorption onto both “Al-edge site” and “Si-edge site” of the clay. Finally, the spectroscopic investigation has allowed as well to determine the U(VI) surface species repartition versus pH of the suspension. Then, the fitting of the macroscopic retention data was successfully completed on the basis of all the experimental constraints for a wide range of pH and ionic strength conditions, using a surface complexation model. This point is particularly interesting since it is possible to account for retention data obtained for very low metallic cation concentrations (10−7 M) where spectroscopic techniques are not sensitive enough. It is then possible to conclude that the mechanisms identified for rather high cation concentrations (10−4 to 10−3 M) are still valid at lower concentrations.
The second system considered, as illustrative purpose, was the U(VI)/TiO2. Rutile titanium dioxide is an interesting candidate as a methodological substrate, since it can be found under both powder and single crystal forms. Thus, it allows one to study the retention mechanisms on perfectly defined surfaces. Four spectroscopic techniques were carried out on this system. It was found that two kinds of surface oxygen atoms are active towards U(VI) retention on titania: two-fold (bridging) and single-fold (top) surface oxygen atoms. Moreover, it was clearly demonstrated that the U(VI) retention mainly involved the sorption of the cation, as a bidentate surface complex, on two bridging oxygen atoms for pH lower than 4 while the sorption of U(VI) onto one top and one bridging oxygen atom mainly account for the macroscopic retention data for higher pH values. Quantum chemistry calculations were performed to study the interaction between uranyl ion and the TiO2(110) face. The theoretical results are in perfect agreement with the experimental ones. Moreover, the MUSIC model was used to quantify the surface acidity constants of the substrate. Then, the modeling of the potentiometric titration curves was completed considering a surface complexation model. Finally, the macroscopic retention data were successfully modeled.
Thus, all the approaches, presented in this review, have allowed one to strongly reduce the number of adjustable parameters for the data fitting procedure and have led to quantify the sorption constants on the basis of experimental and theoretical constraints. The obtained values are then more reliable and can be safely used directly for geochemical transport codes.
Acknowledgments
The authors are very grateful to H. Catalette, C. Denauwer, C. Domain, M. Dossot, J.-J. Ehrhardt, B. Humbert, and G. Lagarde for their contribution to this work. Many thanks to all the students who have participated in the presented studies: S. Cremel, A. Kowal-Fouchard, H. Perron, and J. Vandenborre. Authors are also grateful to ANDRA and EDF for supporting the cited works.