

1 Introduction
Nuclear Magnetic Resonance Spectroscopy (MRS) is one of the most often used techniques to study the metabolism changes in different biological and chemical samples. NMR spectroscopy fulfils an important role through its ability to produce structural information and also to provide data on intermolecular dynamics. Current studies are concentrated on the analysis of limited sample volumes (of the order of the microlitre) – tissues, cell cultures, protein structures [1]. The field of NMR has developed a large array of experimental capabilities, but NMR sensitivity still lags significantly behind most other analytical methods by a factor of 100–1000, especially for many important mass-limited and concentration-limited samples. The observation of metabolites with short spin–spin relaxation decay becomes possible using short echo-time localization pulse-sequences. However, quantification of spectra is hampered by overlapping metabolite resonances and certainly by low signal-to-noise ratio (SNR) due to the limited size of the observed volume. Thus, the analysis of sample volumes of nanolitre order implies the development of NMR coils having dimensions of several micrometres [2,3] by microelectronics technology.
This paper presents the concept and the spectroscopic performances of a micro-NMR probe particularly suited to the analysis of such concentration-limited and mass-limited samples.
The originality of NMR microspectroscopy calls for a discussion of certain pertinent definitions and concepts to define the performance and design criteria essential to planning experimental strategies that maximize signal-to-noise ratio measurement. Consequently, in the first part we provide a brief overview of the figures of merit [4,5] which are important to determine the feasibility of our experiment using MR microprobes. Next, a comparison between the measured limits of detection by MR microspectroscopy and their estimated values based on analytical considerations will be described. The analytical estimation is based on several parameters like the nuclear precession frequency, the sample concentration and volume, the number of magnetically equivalent nuclei, which give rise to a particular resonance, the linewidth of the resonance and also the scan time, tscan. The limits of detection of the acquired spectroscopic data are quantified based on the prior knowledge of the signals which will be analyzed by the QUEST method [6]. Additionally, performance criteria will be established based on the described figures of merit being very useful in choosing a probe for a particular analysis.
1.1 MR probe miniaturization
Research carried out during the last decade showed the possibility to implement NMR instrumentation at small scale, especially with radiofrequency resonators, which can be used as NMR signal detectors. The actual tendency in the MR spectroscopy field is the analysis of limited mass and concentration samples; the main limitation is represented by the low signal-to-noise ratio. Conventional MR instruments used for small volume analysis give a small signal-to-noise ratio (SNR) because of their large dimensions compared to the sample size. The amplitude of the MR signal is maximized when the size of the detection RF coil matches the sample's size. Therefore, a micro-MR device designed for microsamples is required to improve the signal-to-noise ratio (SNR) and consequently to increase the sensitivity [7]. Considering, the need of examining by spectroscopy (or by NMR microimaging) small quantities of tissue, it is possible to create probes with working volume compatible with such limitations [2]. Thus, to analyze samples with volume of the order of the nanolitre, it is necessary to build, by microelectronics technology, antennas having dimensions of several micrometres [3]. At this scale, susceptibility effects may modify considerably the static magnetic field spatial distribution in the microantenna vicinity. This problem seems to be circumvented by deposition of suitable substrates (for example As–Ga) on circuits, or by the use of microcircuit supports for which the choice of materials (copper–chromium, copper–beryllium) should guarantee the magneto-compatibility of the whole device. In addition, the use of materials with large gap may offer stability in temperature and frequency and may guarantee good conditions of biocompatibility. In such situation, the use of the MESFET (metal, semi-conductor field effect transistor) technology is certainly possible [8]. The construction of such resonators must be supplemented by the installation of the preamplifier on the same substrate in order to optimize the signal-to-noise ratio [9], which may be more efficient and less space consuming than external preamplifier devices as proposed formerly by Magin and coworkers in their pioneering work [10]. This way requires investigations essentially based on the present state of the art of microelectronics and it can turn into profit from nano-techniques' design processes. On the biomedical scope, accurate metabolites variations' quantification associated with spatial localization of small resonators placed directly into a well-defined region of interest (ROI) appears essential.
1.2 Figures of merit for MR microspectroscopy
The investigation of mass-limited and concentration-limited samples by MRS requires several performance criteria in order to validate the feasibility of the experiment using MR microprobes. These criteria allow computing the approximate mass or concentration of sample needed to acquire a desired SNR for a specific peak acquired during a specific scan time. These figures of merit [4,5] are the concentration sensitivity Sc, the mass sensitivity Sm, the concentration limit of detection LODc, and the mass limit of detection LODm, respectively. The sensitivity refers to the probe behaviour once the sample is placed in its active volume. Actually the sensitivity is the slope of the calibration curve of SNR versus the amount of sample in the detection region, here termed as the active volume Vactive [10]. The concentration sensitivity is a figure of merit appropriate to compare the microcoils' performances using a sample of fixed concentration. It is defined as the ratio between the SNR and the concentration of the sample, Sc = SNR/C, where C is a chosen unit of concentration for the sample within the active volume of the microprobe [4]. Sc is a suited criterion of performance for a sample of fixed concentration. The mass sensitivity, Sm is defined as the ratio between the SNR and the amount of mass (or moles) of the sample in the active volume Vactive, Sm = SNR/mol, where the mol refers to the number of moles of sample in the probe active volume. Sm is more appropriate in comparing probe performance for a sample of fixed mass. Both Sc and Sm are relaying on the signal-to-noise ratio value, as we can easily notice from their analytical expressions. SNR is an important factor that determines the ability of the instrument to perform measurements on the sample in reasonable time. There are a multitude of factors which contribute to the signal strength as well as to the noise factor of the equivalent electronic system. Time-domain SNR can be calculated as follows:
| (1) |
| (2) |
| (3) |
| (4) |
| (5) |
The ratio between the analytically estimated SNR value and the measured one will represent the noise factor F. The noise factor F or the equivalent noise figure NF (dB) (F = 10NF/10, NF = 10 log (F)) is influenced for our system by several parameters: attenuation of the printed board PCB (APCB), attenuation of the cable from the board to the spectrometer (Acable) and from the conventional spectrometer preamplifier input. Neither the noise factor introduced by the PCB nor the noise factor coming from the electronic system is taken into account in the SNR analytical value.
The difference between the analytical SNR value and the one obtained by measure could be defined as an estimation of the noise figure NF (dB) coming from the PCB and other electronic losses additionally to the known noise figure coming from the cable and the spectrometer (NFcable ≅ 0.6 dB, NFspectrometer ≅ 1 dB).
Assuming the coil resistance as the principal noise source, a value for the theoretical noise Vn was found to be Vn = 14.66 × 10⁻¹⁰ V (Eq. (1)), with Rnoise = 1.27 , Δf = 4 kHz, tacq = 0.512 s.
An additional figure of merit is the limit of detection LOD, representing the minimum concentration and sample mass necessary to yield an SNR of 3 [4,5]. These limits of detection depend on the concentration of the sample in the active volume of the probe LODc, LODc = 3/Sc, where Sc is the concentration sensitivity, and on the amount of moles contained in the probe Vactive, LODm = 3/Sm, where Sm is the mass sensitivity. The analysis of mass-limited samples requires the accumulation of a number of acquisitions; in this case the MR microprobe gives rise to a significantly higher SNR for a given scan time, tscan. Consequently, these performance parameters can be more explicitly defined as time-normalized concentration sensitivity and time-normalized mass sensitivity:
| (6) |
| (7) |
The time-normalized limits of detection in terms of concentration and of mass become:
| (8) |
| (9) |
The figures of merit described here could be considered as important performance indicators for MR microprobes employed under different situations, such as the amount of sample and the concentration range for a given experiment.
2 Materials and methods
2.1 MR microcoil
The microcoil (needle: the most active part of the NMR device) extends with 40-μm-thick cooper tracks on 10-mm length. Tracks, realised jointly with the coil, convey the detected signal. The implantable part of the probe looks like a 9-mm-long, 550-μm-thick and 600-μm-wide needle (500 μm for coil diameter plus 50 μm on each side left for dicing). Notice that the needle is quite fragile [14].
A capacitive network must be associated with the microcoil to tune the antenna at the nucleus Larmor frequency of interest (200 MHz for 1H in a magnetic field of 4.7 T) and to match the impedance of the transmission channel (50-Ω cable). Considering size constraints for implantation, the adjustable capacitors are fixed on a printed circuit board (PCB) which remains out of the sample. The antenna is glued on the PCB circuit and electrical connections are realised by microbonding of 50-μm-diameter aluminium wires (Fig. 1a–c).
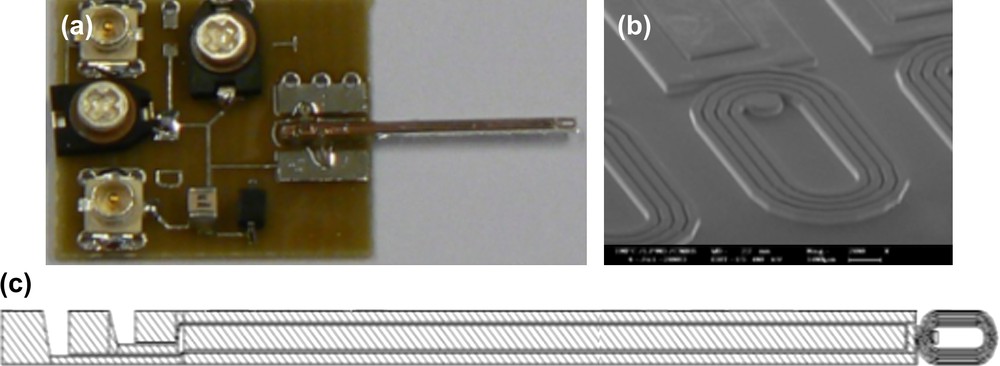
(a) First realisation of microcoil with tuning/matching circuit, (b) SEM view of needle coils and (c) needle coil scheme.
During experiments, the transmitted RF field is generated by a bird-cage Rapid Biomedical coil (inner diameter Φ = 6.9 cm, Ettlingen, Germany) producing a uniform field. The receiving microcoil must be detuned during excitation with a PIN diode also mounted on the PCB substrate [15]. This described circuit [14,16] is currently used to evaluate performances in vitro but must be still improved for in vivo applications since the equivalent series resistance of the coil depends on sample or intrinsic characteristics (conductivity and imaginary part of permittivity).
2.2 Localised 1H spectroscopy
The observation of metabolites with short spin–spin relaxation decays is possible using free induction decay or short echo-time pulse-sequences. However, quantification of spectra is hampered by overlapping metabolite resonances and certainly by low signal-to-noise ratio (SNR) due to the small size of the observed volume. Fitting of time or frequency-domain model function to such low-SNR in vivo data requires extensive prior knowledge. The method QUEST, which includes spectral estimation in the time domain, uses a basis-set of expected metabolites signals. A simulated basis-set of the theoretical metabolite signals can be quantum mechanically simulated according to the employed sequence [6]. The signals with low signal-to-noise ratio and the large amplitude of the water peak have to be removed. The water signal was suppressed by variable power RF pulses with optimized relaxation decays (VAPOR) [17]. Outer volume suppression (OVS) combined with a short echo-time PRESS was used for localization. The removal of residual water components was performed in a pre-processing step using the Hankel–Lanczos Singular Value Decomposition algorithm – HLSVD. 1H spectrum of a solution of cerebral metabolites has been acquired with a short echo-time PRESS sequence used for localization of the excitation close to the active part of the antenna. The phantom solution contains a mixture of three MR-observable 1H metabolites in human brain: choline [100 mM], N-acetylaspartate (NAA) [100 mM] and creatine [50 mM] [18]. Experiments were conducted on a 4.7-T Bruker magnet (Biospec System, 270 mT/m gradient set). The localization was made with a PRESS sequence (bandwidth 4 kHz, 4096 complex points, 256 averages, TR = 7000 ms, TE = 20 ms, scan time tscan = 30 min). Eddy current compensation and static magnetic field drift correction were applied during the acquisition.
2.3 Microcoil sensitivity
Knowing the coil RF field cartography in terms of uniformity and amplitude and its corresponding sensitivity distribution, the signal-to-noise ratio in the frequency domain can be analytically evaluated.
The active volume of the planar microcoil was determined by MRI measurements [16] using a MSME sequence (Fig. 2) (FOV = 2.2 cm, isotropic resolution 172 μm/pixel, slice thickness 0.5 mm, six slices).
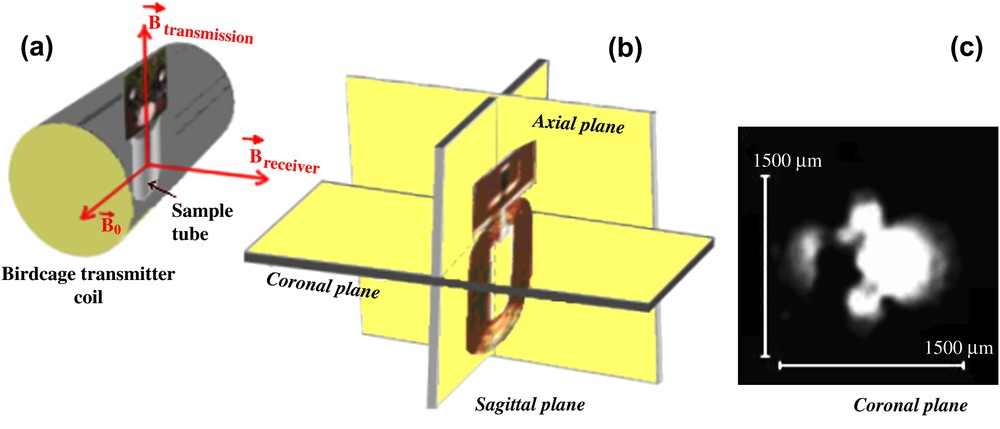
MR setup with the microcoil positioning in the sample tube (a) and the slice selection (b) for the microimaging part, coronal plane of the microcoil obtained with a MSME (Multi Slice/Multi Echo) sequence (c).
The active volume of the planar microcoil is determined from the MR signal intensity value in Fig. 2 if it is not less than 70% of the maximum observed intensity (threshold = 30%) (Vactive = spatial resolution (x, y) × slice thickness). Along the coil length (six slices of 0.5-mm thickness each) the MR signal intensity occurs in a volume having approximately Vactive = 2.07 μl. The signal intensity deceases from the coil centre to a distance close to d = 960 μm. The unitary magnetic field distribution B1 will also be calculated from the coil centre to the distance d = 960 μm.
The magnitude of the unitary field in the active volume was estimated from the magnetic field iso-lines from the sensitivity map of the microcoil (Fig. 3a) obtained using the Biot–Savart law (Matlab 7.0 software) as we have reported in our previous work [16]. A mean value for B1 of 1.34 mT/A was obtained (Fig. 3b).
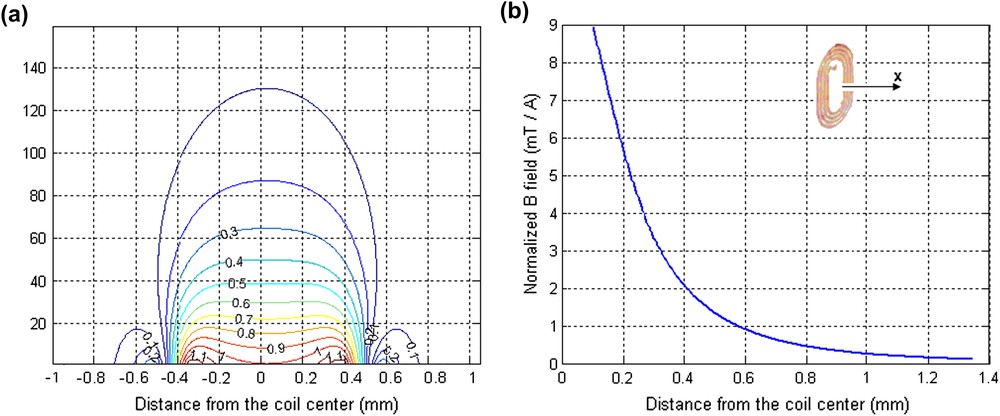
(a) Magnetic field B1 distribution produced in the xy plane by a unit current flowing through the microcoil. The value of the magnetic field was normalized to a value of 1.0 at the centre of the microcoil, (b) calculated unitary magnetic field B1 along the coil axis.
We can notice that for a given static magnetic field, volume and sample, the SNR value strongly depends on the unitary magnetic field B1.
3 Results
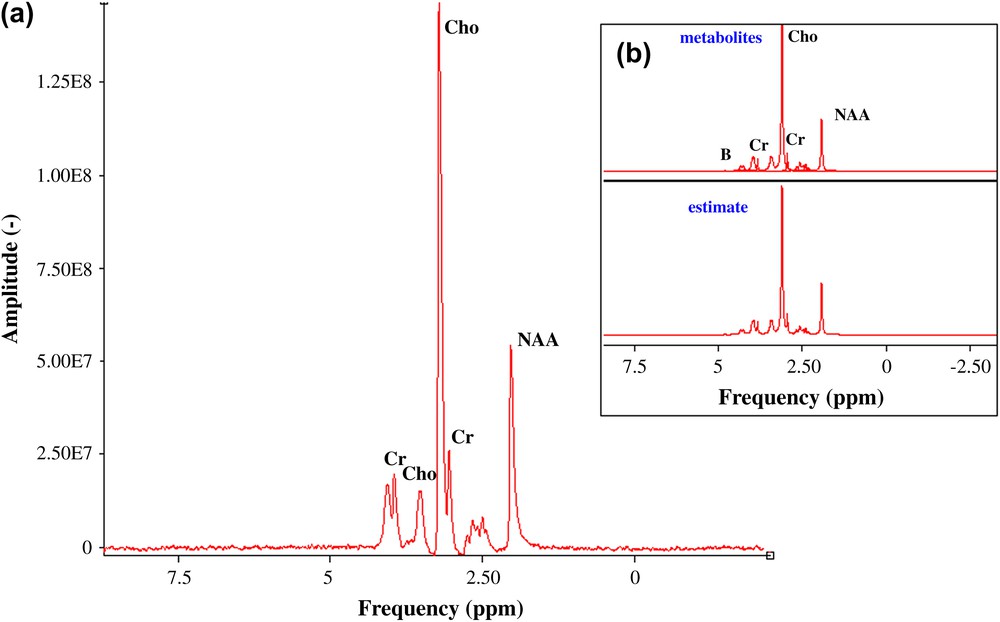
The limits of detection were calculated based on the SNR expression in the frequency domain according to the model described in Section 1. values were estimated from the measured linewidth of the acquired signals (Fig. 4) of choline and NAA: and , respectively.
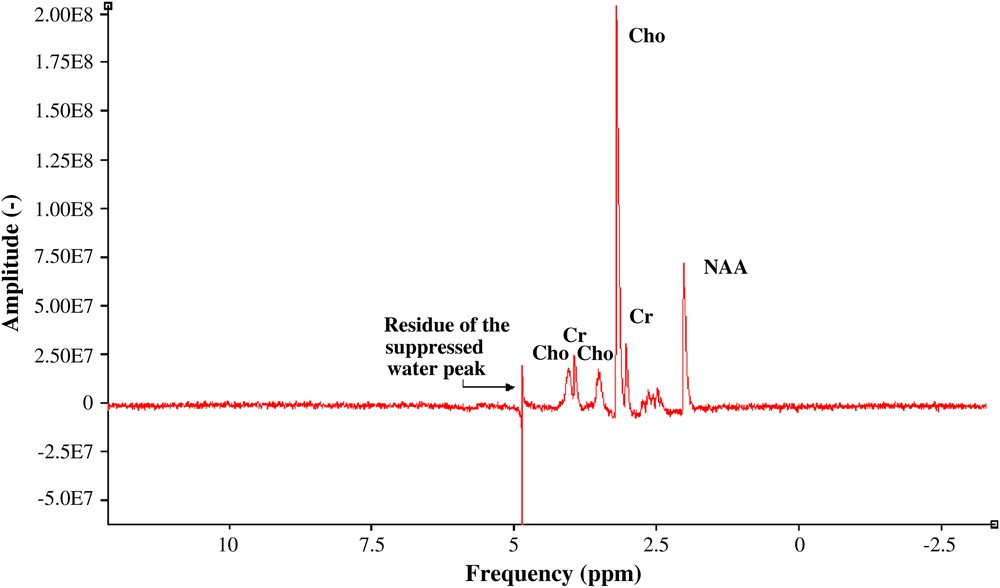
1H spectrum of three cerebral metabolites: choline, and NAA (50 mM), creatine (50 mM), pH = 7.0 ± 0.1, no pre-treatment was performed.
There are 13 non-exchangeable protons in Choline, nine from a trimethylamine group and four from two methylene groups. The nine protons of the trimethylamine group –(CH3)3 are magnetically equivalent and give rise to the prominent singlet at 3.19 ppm. For this group, the spin density is (neqCho = 9). NAA has seven protons that give NMR signals between 2.0 and 8.0 ppm. It typically provides the most prominent resonance, a singlet at 2.01 ppm, from the three protons of an N-acetyl CH3 group. In this case, the spin density is (neqNAA = 3). The net magnetization becomes and , respectively (Eq. (4)). The estimated SNR for the choline case is close to 52.1 and for the NAA close to 17.4 after 256 averages (Eq. (2)). This brings to a value close to 5.7 mM and a value close to 17.2 mM. These analytical results will be compared with the limits of detection obtained from the acquired data quantified using jMRUI (http://www. mrui.uab.es/mrui), and the ratio between their analytical and their measured values will be summarized afterwards. In the SNR measurement of both acquired signals (choline and NAA) using jMRUI, no pre-treatment was performed, in order to have a rigorous comparison of the limits of detection of the estimated and the acquired spectroscopic data. The ratio between them makes it possible to estimate the noise factor F (Eq. (2)) representing the signal-to-noise losses coming from different electronic stages to the spectrometer input.
The SNR values as well as the sensitivity and their corresponding limits of detection (non-normalized) for both analytical and acquired data are displayed in Table 1. The mass sensitivity and the mass limit of detection were calculated for both metabolites (Cho, NAA) of the phantom solution within the active volume measured by MR imaging (Fig. 2) Vactive = 2.07 μl of the microcoil () [5]. Actually Vactive represents the proportionality constant that relates mass limit of detection to the concentration limit of detection.
SNR and limits of detection for analytical and measured metabolite signals
| Métabolite mean ± SD | SNRestim | SNRmeas | Scestim (mM) | Scmeas (mM) | LODcestim (mM) | LODcmeas (mM) | LODmestim (10−9 mol) | LODmmeas (10−9 mol) |
| Choline | 52.1 | 20 ± 0.2 | 521 | 200 ± 2 | 5.7 | 15 ± 0.33 | 11.8 | 31.05 ± 0.7 |
| NAA | 17.4 | 7.1 ± 0.3 | 174 | 71 ± 3 | 17.2 | 42.2 ± 0.3 | 35.6 | 87.3 ± 0.6 |
The normalized sensitivities and their corresponding limits of detection were also calculated and are summarized in Table 2.
Comparison between the estimated values and measured ones, for the limits of detection of choline and NAA signals
| Metabolite | nScestim (mM) | nScmeas (mM) | nLODcestim (mM) | nLODcmeas (mM) | nLODmestim (10−8 mol) | nLODmmeas (10−8 mol) |
| Choline | 12.3 | 4.71 ± 0.04 | 241.8 | 636.3 ± 14 | 50.05 | 131.7 ± 30 |
| NAA | 4.1 | 1.7 ± 0.07 | 729.6 | 1790 ± 12 | 151 | 370.3 ± 25 |
A method to increase the SNR is the application of a weighting function of exponential decay (principle of adapted filtering), which causes line broadening (LB) of additional Lorentzian broadening. Maximum SNR is obtained with LB = LW. An LB of 10 Hz was performed on the acquired data [6] and the SNR for both metabolite signals are close to 68 (choline) and 23 (NAA) (Fig. 5). The following values for the concentration limits of detection have been obtained for the choline and the NAA case: and , respectively (Fig. 5). The mass limit of detection is: 9.1 × 10⁻⁹ mol (choline) and 29.6 × 10⁻⁹ mol (NAA).
(a) Acquired 1H spectrum, apodisation LB of 10 Hz, of three cerebral metabolites: choline, and NAA (100 mM), creatine (50 mM), pH = 7.0 ± 0.1, (b) QUEST quantification.
4 Discussions
We can notice that the acquired data measurements are below the analytical ones. The degradation of the measured SNR compared to its estimated SNR value accounts for a noise factor F ∼ 2.6 corresponding to a noise figure NF ∼ 4.1 dB. Actually the SNR degradation is due to additional noise coming from different sources: the detection of electronic losses like the printed circuit board (wire bounding, tuning/matching capacitors), cable attenuation and conventional spectrometer attenuation. Finally, our Bruker imaging system is not installed inside a Faraday cage for RF shielding and this could account for an additional SNR damage. All these parameters induce signal-to-noise losses and have to be taken into account in the estimated model (Eq. (2)).
The obtained values of the limits of detection show that the investigation of small volumes implies a poor concentration limit of detection . So, the smaller is the volume, the harder will be its detection. These results bring us to an important conclusion that a concentration-limited sample will yield a higher SNR in a probe with a higher active volume, a smaller volume implies a roughly estimation of the concentration limit of detection. A mass-limited sample is most effectively analyzed using a probe with the smallest active volume (largest Sm) [5]. Sc is particularly appropriate in comparing probe performances using a sample with a fixed concentration. In contrast to Sc, Sm is especially useful to compare probe performance for a sample of fixed mass. The normalized limit of detection is a useful figure of merit which can provide significant insight to assist in the validation of a micro-NMR probe with an optimal temporal resolution.
5 Conclusion
In this paper a 1H spectrum containing several cerebral metabolites acquired with a receiver planar microcoil is presented. The limit of detection for this microprobe is significantly improved compared with our previous work [16]. A comparison between the theoretical estimation and the acquired data limits of detection was achieved and shows that probe-induced perturbation reduces the performances of these microcoils. To improve the overall efficiency of the detection microprobe, the additional noise of 4.1 dB occurring from the parameters discussed above (PCB, magnetic field inhomogeneities, etc.) have to be minimized. However, the actual values for LODc in both choline and NAA cases of 4.4 and 13 mM are close to the concentrations found in the rat brain [19] where they are about 2 mM for the choline and about 8.5 mM for the NAA case. These preliminary results make it possible to validate the sensitivity performances of the microcoils used in MR spectroscopy and make it possible to largely open the biomedical applications' field based on experiments in small animals (rodents).