

1 Introduction
Longitudinal (T1) and transversal (T2) relaxation time values are mandatory for optimizing measurement protocols, for accurate quantification of proton Magnetic Resonance Spectroscopy (1H MRS) signals and for absolute quantification of brain metabolites [1–7]. Since the relaxation times of metabolite are greatly influenced by the microenvironment, and reflect mobility at the molecular level, they can also be used to gain a better understanding of the molecular organization of brain structure [1].
Error in T1 and T2 relaxation time estimates may lead to substantial errors in the metabolite concentration estimates. The accuracy of the relaxation time estimates depends on the accuracy of the quantitative separation of the spectral components and is affected by several factors. Indeed, the quantification of in vivo short echo-time 1H MRS spectra is difficult because of the strong overlaps of the metabolite, macromolecule and lipid resonances. Another difficulty is the low signal-to-noise ratio (SNR) of spectra due to low metabolite concentrations, to the small size of the volume of interest (VOI), and to the limited acquisition time. The evolution of spectral multiplets during the echo time due to spin–spin coupling with adjacent protons complicates also the estimation of the T2 relaxation times [2].
Both longitudinal and transverse relaxation times of brain metabolites should follow relaxation of water protons [1–4], experiencing similar longitudinal relaxation mechanisms: the T1 values should increase and the T2 values should decrease with increasing the static magnetic field B0 [1–4]. The increase of the T1 relaxation times is in good agreement with the Bloembergen–Purcell–Pound (BPP) theory of dipolar relaxation, but the decrease of the T2 relaxation times is in apparent contradiction with the BPP dipolar relaxation theory [8], which predicts field-independent T2 relaxation times for a wide range of rotation correlation times [4,8].
Although metabolite T1 and T2 relaxation times play an important role in 1H MRS, they have often been ignored in high-field studies, especially on animals. Few studies have reported the T1 and T2 relaxation times of metabolites in the human brain at low field strengths [1,2,5–7,9]. These studies have been mainly performed at a unique magnetic field and very few comparisons at several magnetic fields were reported [1,4,10]. We have to emphasize that it is difficult to compare relaxation time values from different studies because of possible differences in scanner manufacturer, sequence design, and strategies for acquiring and evaluating the spectra. It has also been shown that the measurements of the relaxation time values are greatly influenced by the pulse sequence [10].
In the present study, the in vitro and the in vivo relaxation times of the singlet resonances of the three major metabolites, N-acetylaspartate (NAA), creatine (Cr) and choline (Cho), in healthy rat brains were estimated under near-identical experimental conditions at 4.7 T and 7 T. The metabolite relaxation time estimates presented in this study will provide complementary information to the published studies.
2 Method
2.1 In vitro solutions
For the estimation of the in vitro relaxation times, three metabolite solutions, Cr, Cho, NAA, were dissolved separately in aqueous solutions buffered with phosphate at pH = 7.0 ± 0.1 (concentration of 50 mM, 37 °C) [11]. The metabolites were purchased from Sigma-Aldrich. Trimethylsilyl-propanesulfonic acid sodium salt and sodium formate were added as chemical shift references. Sodium azide was added to the solutions to avoid the solution degradations with time. The 1H MRS signals were acquired from VOIs of 5 mm3.
2.2 Animals
All the experiments were conducted according to the procedures approved by the Institutional Animal Care and Ethical Committee of our University. The animals were anesthetized by inhalation of isoflurane (Abbott Laboratories, Rungis, France) with 2.5% concentration in a mixture of 50% oxygen and 50% nitrous oxide. The body temperature was maintained at 37 °C with warm water circulation. A pressure sensor was used to monitor the respiratory cycle.
At both magnetic field strengths, healthy rats (Sprague–Dawley, 200–250 g, eight animals) were examined in the central region of the brain (left part of the brain, VOI = (3.5 mm)3).
2.3 Experimental conditions
All the experiments were performed at 7 T (gradient set of 12 cm diameter, 400 mT/m maximum amplitude) and at 4.7 T (gradient set of 10 cm diameter, 270 mT/m maximum amplitude) on two horizontal Biospec systems (BRUKER BioSpin MRI, Germany). At both magnetic fields, the in vitro signals were acquired using a transmit–receive bird-cage coil (72 mm inner diameter) and the in vivo signals were acquired using a bird-cage coil (72 mm inner diameter) for transmission and a surface coil (15 mm diameter) for reception.
The in vitro and the in vivo acquisitions were performed with near-identical acquisition parameters. A point resolved spectroscopy sequence (PRESS, bandwidth of 4 kHz, 4096 data points, 128 averages) combined with outer volume suppression was used. The water signal was suppressed using variable power RF pulses with optimized relaxation delays (VAPOR) [12]. All first- and second-order shim terms were adjusted using FASTMAP (fast, automatic shimming technique by mapping along projections) [13]. Shimming resulted in unsuppressed water spectral linewidths of 5–7 Hz at 4.7 T and 7–11 Hz at 7 T. The localization of the VOIs was based on T2-weighted RARE (rapid acquisition with relaxation enhancement) images (TR/TE = 8000/80 ms (4.7 T), TR/TE = 6500/65 ms (7 T), echo spacing 25.1 ms (4.7 T), echo spacing 20.3 ms (7 T), slice thickness 0.5 mm, RARE factor = 8, field of view = 30 × 30 mm, matrix = 256 × 192). The size of the VOIs was adjusted to fit the anatomical structure of the selected brain region and to minimize partial volume effects.
2.4 T1 measurements
For the in vitro T1 relaxation time estimations, four time-series of nine signals were acquired using increasing repetition times (TR = 2.8, 3, 4, 5, 6, 7, 8, 9, 10 s) with constant echo time (TE = 20 ms). Eight time-series of five signals were acquired using increasing repetition times (TR = 3, 4, 5, 6, 7 s) with constant echo-time (TE = 20 ms) for the in vivo T1 relaxation time estimations.
2.5 T2 measurements
For the in vitro T2 relaxation time estimations, four time-series of eight signals were acquired using increasing echo times (TE = 60, 100, 200, 300, 400, 500, 600, 700 ms; with constant TR = 4 s). Eight time-series of six signals were acquired using increasing echo times (TE = 20, 40, 60, 80, 100, 136 ms; with constant TR = 4 s) for the in vivo T2 relaxation time estimations.
2.6 Data processing
The in vitro and the in vivo MRS time-series signals were processed in the time-domain using the jMRUI software [14,15]. The removal of residual water components was performed using the Hankel–Lanczos singular value decomposition algorithm (HLSVD, 25 spectral components were used for modeling). The signals were then fitted using AMARES (advanced method for accurate, robust, and efficient spectral fitting) [16]. For each in vivo signal of the time-series, 14 Lorentzian spectral components were selected to fit the major contributions of the metabolites, the zero-order phase was estimated and the first-order phase was fixed to zero. The individual phases relative to the zero-order phase were fixed to zero. To minimize the influence of the large broad baseline components link to the macromolecule resonances, the first 20 data points of the in vivo signals were weighted with a quarter-sine wave. The accuracy of the amplitude estimates was assessed using the Cramér–Rao lower bounds (CRBs) [17].
The time evolutions of the amplitude estimates of the singlets of NAA (CH3 – 2.02 ppm), Cr (CH3 – 3.03 ppm) and Cho (N(CH3)3 – 3.22 ppm) were then fitted using a non-linear least squares algorithm based on a mono-exponential model function. For the in vivo spectra, the singlet at 3.03 ppm corresponds to the total creatine (creatine and phosphocreatine). The correlation coefficients reflecting the quality of the least squares fit vs the original data were computed.
2.7 Statistics
The in vitro and the in vivo metabolite T1 and T2 relaxation time values were compared pairwise for the two magnetic field strengths. Statistical significant changes were calculated with two-tailed Student's t-tests. A paired t-test was invoked for the two time point comparison of the in vitro T1 and T2 relaxation time values at the two field strengths. An unpaired t-test was used for the in vivo T1 and T2 relaxation time estimates' comparison at the two field strengths. In the statistical analysis, *p < 0.05 was considered significant, while **p < 0.01 and ***p < 0.001 were considered highly significant.
3 Results
The amplitudes of the three selected singlets (NAA, Cho, Cr) were successfully estimated using AMARES for all the time-series signals. The corresponding Cramér–Rao bounds were found below 10% of the amplitude estimates. A jMRUI window displaying the quantification results obtained for an in vivo rat brain signal acquired at 7 T is shown in Fig. 1.

AMARES quantification result window (jMRUI). From bottom to top, the original spectrum acquired in vivo at 7 T from the central region of the rat brain (left part of the brain, VOI = 3.5 mm3) using a PRESS sequence (TE = 20 ms); estimated spectrum using AMARES (14 Lorentzian spectral components in the fitting procedure); estimated NAA singlet (2.02 ppm); residue.
Figs. 2 and 3 display examples of the mono-exponential fittings of the in vitro and the in vivo Cr amplitude evolutions at 7 T, respectively. The correlation coefficients were found in the range of 0.89–0.99 for all the time-series signals at both field strengths.
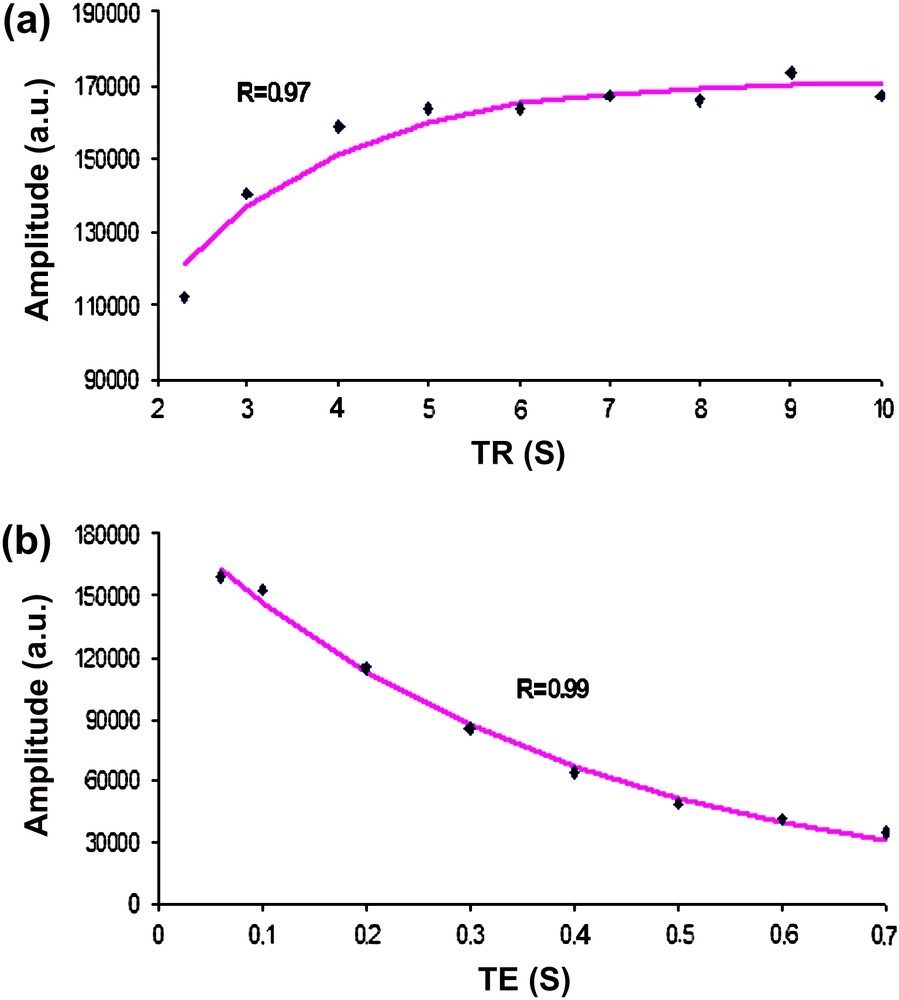
Mono-exponential fitting (line) of the in vitro amplitude evolutions of Cr at 7 T for the T1 and T2 estimations. The estimated amplitudes (dots) are drawn as a function of (a) the repetition times (TR) and (b) the echo times (TE). The correlation coefficients (R) are also displayed.
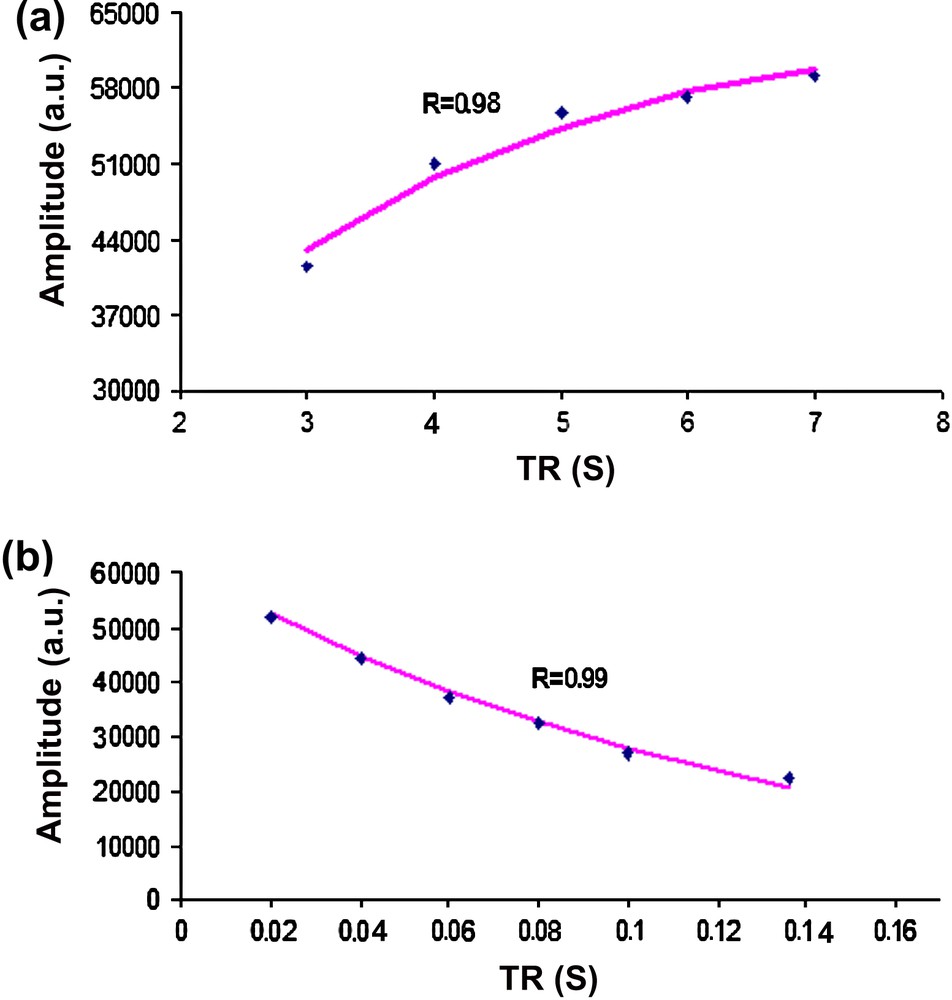
Mono-exponential fitting (line) of the in vivo amplitude evolutions of Cr at 7 T in the rat brain for the T1 and T2 estimations. The estimated amplitudes (dots) are drawn as a function of (a) the repetition times (TR) and (b) the echo times (TE). The correlation coefficients (R) are also displayed.
The mean values of the estimated T1 and T2 relaxation time values and the corresponding standard deviations (±1 SD, corresponding to 70% confidence interval) are computed and reported in Table 1.
The in vivo and the in vitro T1 and T2 relaxation time estimates at 4.7 and 7 T and the corresponding standard deviations for NAA, creatine and choline in healthy rat brains
| NAA | Creatine | Choline | |
| T1 ± sd (s) | |||
| 4.7 T | |||
| In vivo rat brain | 1.33 ± 0.21 | 1.59 ± 0.25 | 1.91 ± 0.25 |
| In vitro | 1.49 ± 0.02 | 2.11 ± 0.01 | 2.26 ± 0.05 |
| 7 T | |||
| In vivo rat brain | 2.10 ± 0.29 | 1.98 ± 0.30 | 2.16 ± 0.30 |
| In vitro | 1.72 ± 0.04 | 2.16 ± 0.10 | 2.36 ± 0.20 |
| T2 ± sd (ms) | |||
| 4.7 T | |||
| In vivo rat brain | 193 ± 25 | 238 ± 31 | 231 ± 30 |
| In vitro | 704 ± 42 | 762 ± 40 | 840 ± 10 |
| 7 T | |||
| In vivo rat brain | 143 ± 21 | 126 ± 16 | 124 ± 20 |
| In vitro | 427 ± 20 | 425 ± 52 | 400 ± 24 |
The in vitro and the in vivo metabolite T1 relaxation times showed a statistically significant increase with increasing magnetic field strength (**p < 0.01 for NAA and *p < 0.05 for Cr and Cho) (Table 1). The in vitro and the in vivo metabolite T2 relaxation times showed a statistically significant decrease with increasing magnetic field strength (***p < 0.001 for the in vitro values of the three metabolites; *p < 0.05, **p < 0.01, ***p < 0.001 for the in vivo values of Cho, NAA, Cr, respectively) (Table 1).
4 Discussions
Estimations of the in vitro and in vivo metabolite T1 and T2 relaxation times at two different magnetic fields were performed. Field-dependent variations in the T1 and T2 relaxation times were observed with high significance, since the measurements were performed on similar BRUKER systems with the same Biospec consoles using comparable RF probes, identical PRESS pulse sequence. The timings of our protocol (repetition times and echo times) were adapted in order to acquire enough measurements to reach good fits of the relaxation curves. The timings for the in vivo measurements were slightly different from the in vitro ones to cope with the duration of the animal anesthesia and the low in vivo SNR.
The increase of the T1 relaxation times with respect to the increase of the magnetic field strength was in good agreement with the Bloembergen–Purcell–Pound (BPP) theory of dipolar relaxation [8] and with the published values for different magnetic field strengths (Table 1) [1,2,4,7,18].
The decrease of the T2 relaxation times with respect to the increase of the magnetic field strength was in apparent contradiction with the BPP dipolar relaxation theory, which predicts field-independent T2 relaxation times for a wide range of rotation correlation times. The field-dependent reduction in apparent T2 relaxation time values can be caused by increased dynamic dephasing effects due to increased local (microscopic) susceptibility gradients [4,10]. The magnetic field inhomogeneity (macroscopic and microscopic), due to susceptibility differences between tissues (and air), increases linearly with the magnetic field strength. The molecules diffuse through these microscopic field gradients and lose phase coherence, resulting in shorter apparent T2 relaxation time values [4]. De Graaf et al. [4] have reported that the diffusion coefficients of metabolites are reflected in the decreases of metabolite T2 relaxation time values with increasing magnetic field strength. The estimated T2 relaxation times presented in this study, using the PRESS sequence, were different from the values reported in Ref. [4]. These differences can be attributed to the differences between the pulse sequences used for the measurements. For instance, Michaeli et al. [10] showed that the T2 values of the NAA and the Cr measured with Carr–Purcell type spin-echo sequence (such as CP-LASER) were significantly longer than those measured with the PRESS sequence. Moreover, the T2 values reported by Deelchand et al. [19], using the LASER sequence, were different from the published values measured at the same field strength. The authors have attributed these differences to the fact that the relaxation times depend on the pulse sequence used.
The in vivo relaxation times showed a decrease compared with the in vitro values. These expected differences were in agreement with the fact that the relaxation times of metabolite are influenced by the microenvironment [1]. Indeed, Brief et al. [5] have attributed these differences to the smaller microviscosity of the bulk water compared with that of cytoplasm. As the longitudinal relaxation times of brain metabolites exhibited an increase with increasing magnetic field strength, our in vitro T1 relaxation time estimates were in agreement with the values reported in the literature at lower field strength [5].
In this study, the reported standard deviations for the in vivo relaxation time values were higher than those in vitro. This difference was due to the presence of several factors that affect the reliable quantification of in vivo brain signals at short echo-time. Among these factors, the following can be mentioned: the strong overlapping of metabolite resonances; the low SNR due to the small size of the VOI, the limited acquisition time and the low metabolite concentrations; the presence of a broad, partially known background component originating mainly from macromolecules and lipids that overlap the metabolite peaks.
5 Conclusion
Field-dependent variations in the T1 and T2 relaxation times were observed with high significance, since the measurements were performed with minimal hardware and software differences. The longitudinal relaxation times increased with magnetic field strength and the transverse relaxation times decreased with increasing magnetic field strength. The variations of the in vivo metabolite relaxation time estimates with magnetic field strength were consistent with those of the in vitro solutions.
The metabolite relaxation time estimates presented in this study are useful for optimizing measurement protocols and to improve the quantification of 1H MRS signals, in order to perform T1 and T2 effect corrections for absolute quantification of brain metabolites.
Acknowledgements
The experiments at 7 T were performed by the authors on the ANIMAGE platform, Lyon, France.