

1 Introduction
The value of nuclear magnetic resonance spectroscopy (NMR) as a powerful analytical technique is due to: (i) its non-destructive character; (ii) the minimal amount of sample preparation required; (iii) the ability to measure different metabolites simultaneously in a mixture. These advantages make it possible to study a system in vivo so that the evolution of a range of metabolites can be followed in real time. Quantitative analysis by 1D 1H NMR is widely used in various fields such as pharmacy [1] and the food industry [2–4]. However, there are limitations to resolution when signal overlapping precludes identification and integration of the target molecule resonances: 2D NMR can be used to overcome these difficulties [5].
Tropane alkaloids are a class of naturally occurring compounds found in solanaceous plants that display anticholinergic and parasympatholytic activities and are used in a variety of medicinal applications [6,7]. As part of a wider programme studying the metabolism of tropane alkaloids, we are investigating their degradation in the bacterium Pseudomonas AT3. This strain of Pseudomonas has been isolated from the rhizosphere soil of Atropa belladonna and is capable of growing on a range of tropane alkaloids as sole carbon and/or nitrogen source [8–10]. In this study, cultures of Pseudomonas AT3 were incubated with tropinone and its degradation (Fig. 1) was observed in vivo by 1H NMR. The acquisition parameters were optimised in order to quantify the metabolism of tropinone directly by NMR.
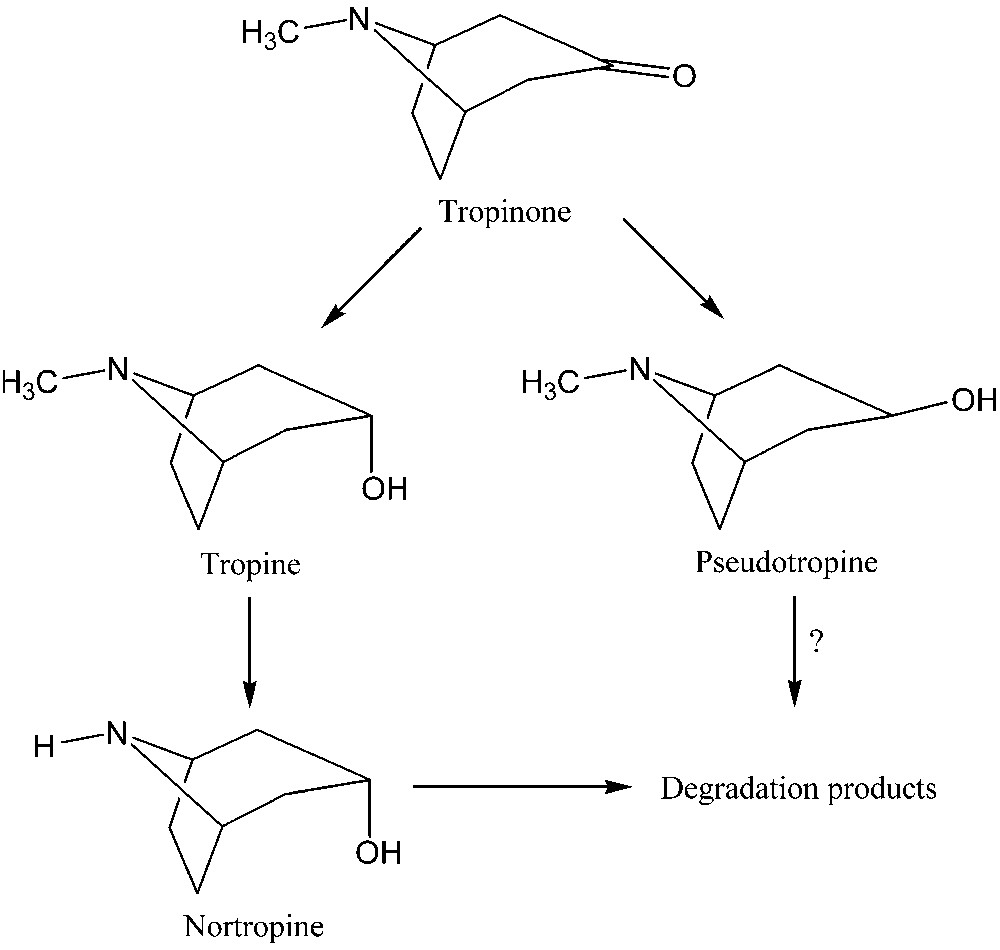
Metabolism of tropinone in Pseudomonas AT3.
2 Experimental
2.1 Chemicals
Tropinone (99% purity) and tropine (>97% purity) were purchased from Sigma-Aldrich (www.sigmaaldrich.com). Pseudotropine was synthesised by Prof. B. Dräger (Institut für pharmazeutische Biologie, Martin Luther University, Halle, Germany) [11]. Trimethylsilylpropionic-[2,2,3,3,-2H4] acid (TSP) was purchased from Euriso-top SA (www.eurisotop.fr).
2.2 Standard solutions
NMR calibration was done with different standard aqueous solutions containing tropinone, tropine and pseudotropine in concentrations between 0.5 and 10 mM and with the pH adjusted to 7.1. All solutions, when not stated otherwise, contained 2.36 mM TSP as reference compound and 10% D2O as lock compound.
2.3 Bacterial cultures
Pseudomonas strain AT3 was obtained from Dr P.W. Trudgill (Department of Biochemistry, University of Wales, Aberystwyth, UK). The bacteria were stored at −80 °C in a sterile defined mineral salt medium at pH 7.1 [9] containing 15% glycerol. Bacterial culture was initiated by resuspending frozen culture in sterile medium with 7.2 mM tropinone, added by filter sterilisation, as the sole carbon and nitrogen source. The cultures were incubated at 30 °C on a gyratory shaker at 200 rpm in the dark. Bacterial culture growth was followed by measuring optical dispersion (OD) at 550 and 580 nm. For in vivo experiments, the bacterial cells from a pre-culture were harvested by centrifugation and the pellet was resuspended in fresh medium.
2.4 NMR samples
An airlift system was used as shown in Fig. 2. The airlift was made from an 8-cm length of a 5-mm o.d. NMR tube centred with silicone spacers in an 8-mm screw cap NMR tube. The system was filled under sterile conditions with 3.3 mL of either a standard solution or a bacterial suspension. The sample was aerated and circulated by a stream of water-saturated air. The air was passed through a 0.2-μm filter connected with Tygon tubing to a syringe needle going through the septum in the NMR tube cap. The needle was connected to a capillary tube through which air was bubbled into the top of the 5-mm tube at a rate of 3.5 mL/min. The exhaust air was vented through another syringe needle.
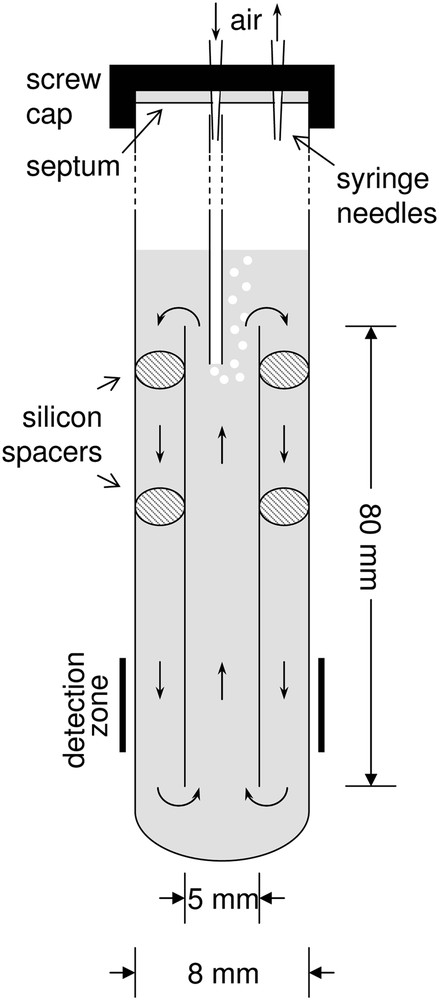
Schematic cross-section of the airlift system used in the NMR experiments.
The bacterial suspension contained 2.36 mM TSP as reference compound and 10% D2O for field lock. The pH of the medium was adjusted to 7.1. After taking reference spectra, tropinone was added to the bacterial suspension to a final concentration of 5.5 mM.
2.5 NMR experiments
NMR spectra were acquired on a Bruker Avance 300 WB spectrometer with an 8-mm broadband inverse detection (BBI) probe-head. The temperature was kept constant at 303 K. Standard conditions for 1D 1H spectra were 3.0 s water pre-saturation, a 90° pulse and 1.366 s acquisition time. Longitudinal relaxation time constants T1 were measured with an inversion recovery sequence employing a 2.63 s relaxation delay, a inversion pulse [12] and 18 variable recovery delays ranging from 0.01 to 15 s. The water resonance was saturated all the time except during the 1.366 s acquisition delay. Data were curve-fitted using SigmaPlot2001. 2D TOCSY spectra were recorded with 2048 points for a spectral width of 2997.60 Hz in the direct dimension giving a resolution of 1.46 Hz, and 192 points for a spectral width of 1920.83 Hz in the indirect dimension, giving a spectral resolution of 10.00 Hz. The sequence started with 0.32 s of water pre-saturation. The spinlock during the mixing time was generated by an MLEV17 sequence with γB1/2π = 11.9 kHz. A 2.5-ms trim pulse preceded the 0.342-s acquisition period. The sequence was phase-sensitive using the TPPI scheme. For in vivo experiments, 1D spectra (4 dummy scans, 128 scans, 9 min and 41 s total duration) and 2D spectra (16 dummy scans, 8 scans per increment, 15 ms mixing time, 20 min and 2 s total duration) were alternated for a total duration of 24 h.
3 Results and discussion
3.1 In vivo NMR sample conditions
The metabolism of TSP by Pseudomonas was first tested under standard culture conditions by adding 2.36 mM TSP to the medium. The growth rate of the bacteria on tropinone remained unchanged, whereas cells incubated with TSP alone showed no growth at all. Furthermore, it was verified with in vivo NMR that the bacteria did not consume TSP or accumulate any TSP-derived metabolites (data not shown). Therefore, TSP is suitable as the reference compound for in vivo NMR.
The bacterial cell density was optimised so as to obtain complete consumption of the added tropinone in about 20 h. This is long enough to follow metabolism with good time resolution and signal-to-noise ratios, and avoids prohibitively long experimental times. An initial OD550 of 0.92 gave such metabolic rates. The rate of metabolism did not depend strongly on the air bubbling rate, indicating sufficient oxygenation even at lower rates (2 mL/min) than that employed (3.5 mL/min). However, at very high rates foam formation was a problem.
3.2 1D 1H NMR spectroscopy
3.2.1 Optimisation of NMR parameters
Fig. 3 shows the 1H NMR spectrum of a tropinone/tropine/pseudotropine mixture. Tropinone can easily be distinguished from the other compounds not only by its methyl peak but also by the H1, H2, H3 and H5 peaks. Distinguishing tropine is harder but possible from the H1 and H2 peaks, while pseudotropine can, with some difficulty, be characterised by its H1, H2 and H6 peaks. Note that in reference spectra from the individual compounds, peaks due to minor impurities can also be seen: moreover, tropinone has a pKa between 7 and 8, making its spectrum pH-dependent around pH 7.1 (data not shown). Furthermore, the conditions in the standard solution are rather favourable compared to the in vivo spectrum, where line widths are sometimes larger and the suppression of the water peak poorer. Additional difficulties are that tropinone concentrations are much higher than those of the other metabolites during the first half of the experiment, and the pseudotropine/tropine ratio is lower than in this mixture. Hence, the 1D spectrum can realistically only be used to quantify tropinone consumption and the combined (tropine + pseudotropine) formation and further metabolism: this is most easily done using the methyl peaks.

1H NMR spectrum of a standard mixture of tropinone, tropine and pseudotropine.
For accurate quantification, it is essential to wait for full relaxation between scans, or at least to know the relaxation rates in order to correct for saturation factors. Then, the TSP peak can be used as internal standard for determination of the other peak areas. Therefore, the longitudinal relaxation constants T1 were measured. It was found that these apparent T1 values are strongly dependent on the air bubbling rate (Fig. 4). This can be explained by a partial renewal of the excited spins in the detection zone by relaxed molecules coming from outside the detection zone. If the renewal rate is too fast, higher apparent transverse relaxation rates will also be seen, resulting in broader peaks. At the highest bubbling rates used, we started to see such an effect but it remained small. From the relaxation results, we chose a bubbling rate of 3.5 mL/min, which is also compatible with the physiological requirements of the bacteria (see Section 3.1). It is noteworthy that the use of an airlift system allows fully quantitative spectra to be obtained in 3 s per scan instead of 17 s, giving an appreciable gain in attainable signal-to-noise ratio or in time resolution. A bubbling rate higher than 3.5 mL/min would allow a higher scan repetition rate, but the gain is marginal and foaming becomes a problem.

Variation of T1 with airlift bubbling rate.
Under these chosen conditions, calibration curves were recorded for both methyl peaks (Fig. 5). These are linear as expected (R2 > 0.999). Their slopes are not quite the same, probably due to minor impurities, which do not resonate at the same frequency.
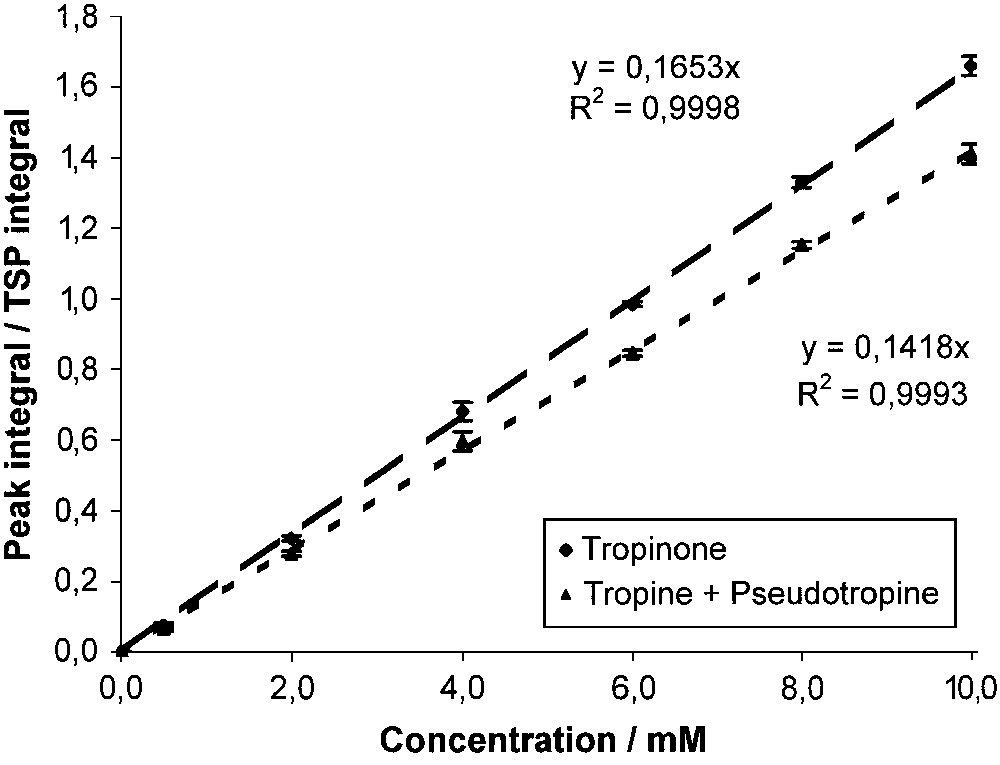
Calibration curves of tropinone and tropine + pseudotropine.
3.2.2 In vivo kinetics of tropinone metabolism from 1D spectra
Fig. 6A shows a stacked view of a series of 1D in vivo 1H spectra. The TSP signal remains constant, whereas the tropinone methyl peak gradually decreases and the combined tropine + pseudotropine methyl peak concomitantly increases, going through a maximum when all the tropinone is used up, and then is itself being rapidly consumed. Fig. 6B shows the corresponding kinetics from peak integration with better time resolution. The total amount of alkaloids, A, decreases continuously and at an increasing rate. Assuming that the consumption rate per bacterium, C, is constant, and that the number of bacteria, B, increases exponentially with a time constant T, then A(t) can be modelled by a function A(t) = A0 − CB0T exp(t/T). A good fit is obtained with A0 = 5.86 ± 0.10 mM, (CB0) = 0.065 ± 0.004 mM/h and T = 9.7 ± 0.4 h (data not shown). This shows that the cells indeed resume exponential growth in the NMR tube, indicating that the in vivo system is compatible with the physiological state of the cells. Pseudotropine peaks can be seen in the spectra between 14 and 20 h, but not reliably quantified. To resolve this problem, 2D spectroscopy was used.
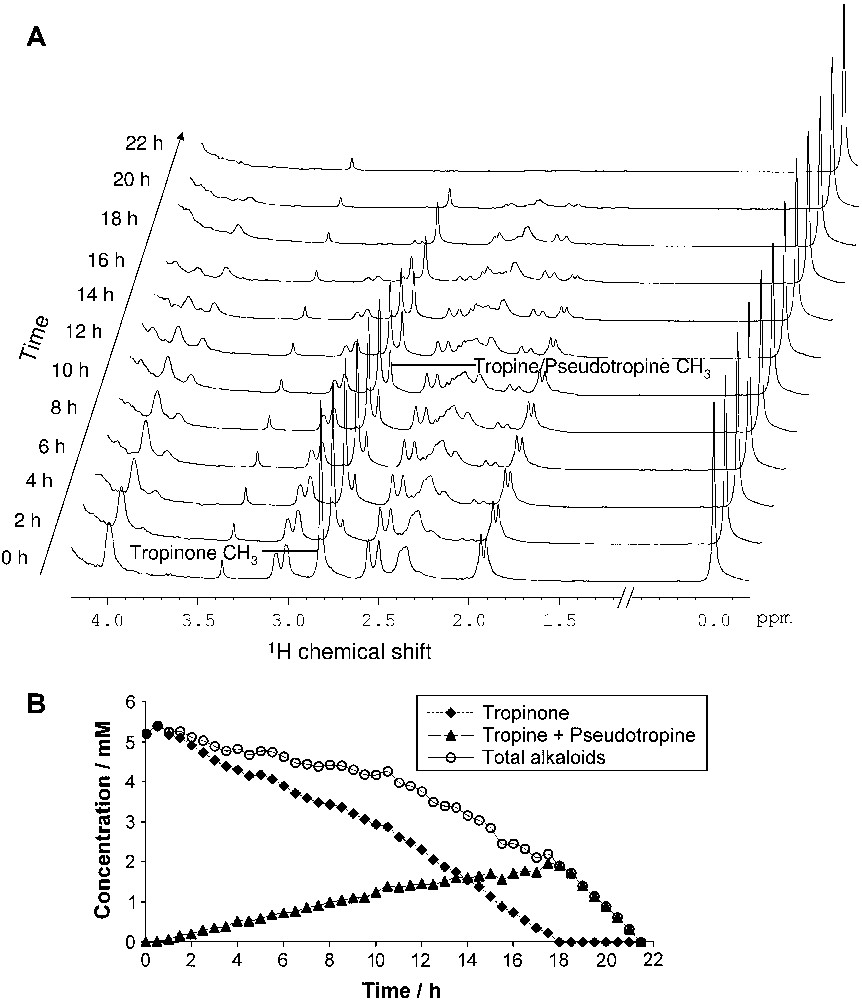
(A). Stacked 1H NMR spectra of in vivo experiment for the metabolism of tropinone; (B) kinetics of tropinone metabolism by Pseudomonas AT3.
3.3 2D TOCSY NMR spectroscopy
3.3.1 Optimisation of NMR parameters
Fig. 7 shows a TOCSY spectrum of a standard solution, and the enlarged zone between 1.7 and 2.5 ppm in both dimensions that contains several strong cross-peaks due to 2J-couplings. Since there are peaks for each one of the three compounds, and especially a distinct peak for pseudotropine H4–H6, this zone is particularly suitable for quantifying this compound. First, the mixing time was optimised with an equimolar solution, and a maximum intensity for the pseudotropine cross-peak was found at 15 ms (Fig. 8). The tropinone H4–H5 cross-peak also has a maximum at 15 ms, whereas the tropine H4–H6 cross-peak that contains a contribution from the pseudotropine H3–H5 cross-peak has a broader and higher maximum. Then, the 2D method was calibrated with solutions containing pseudotropine/(tropine + pseudotropine) at ratios between 0.025 and 0.25 to cover the expected in vivo range. Fig. 9 shows a good linearity between the concentration ratios and the peak ratios, despite the fact that the tropine cross-peak contains some signal from a pseudotropine cross-peak. The resulting non-linearity will only be significant at higher pseudotropine concentrations than those produced in these experiments.
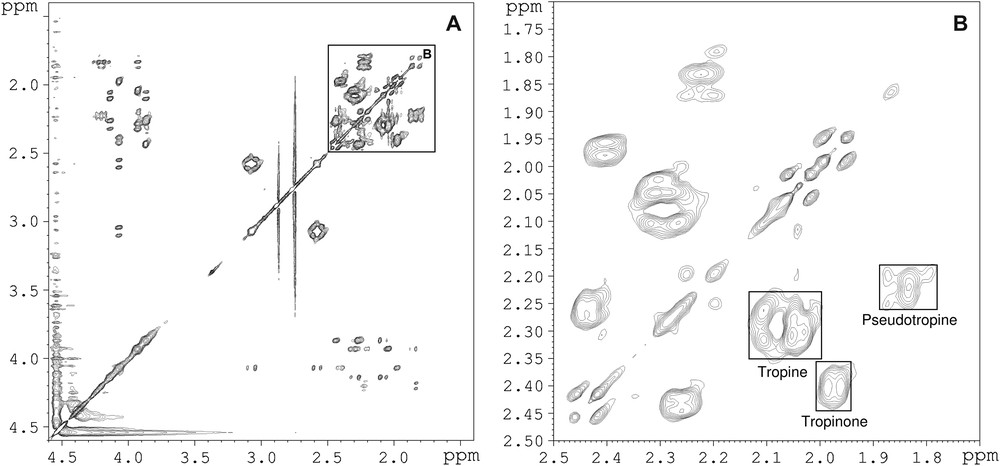
(A) TOCSY NMR spectrum of a standard solution of tropinone, tropine and pseudotropine; (B) enlarged zone of same spectrum between 1.7 and 2.5 ppm.
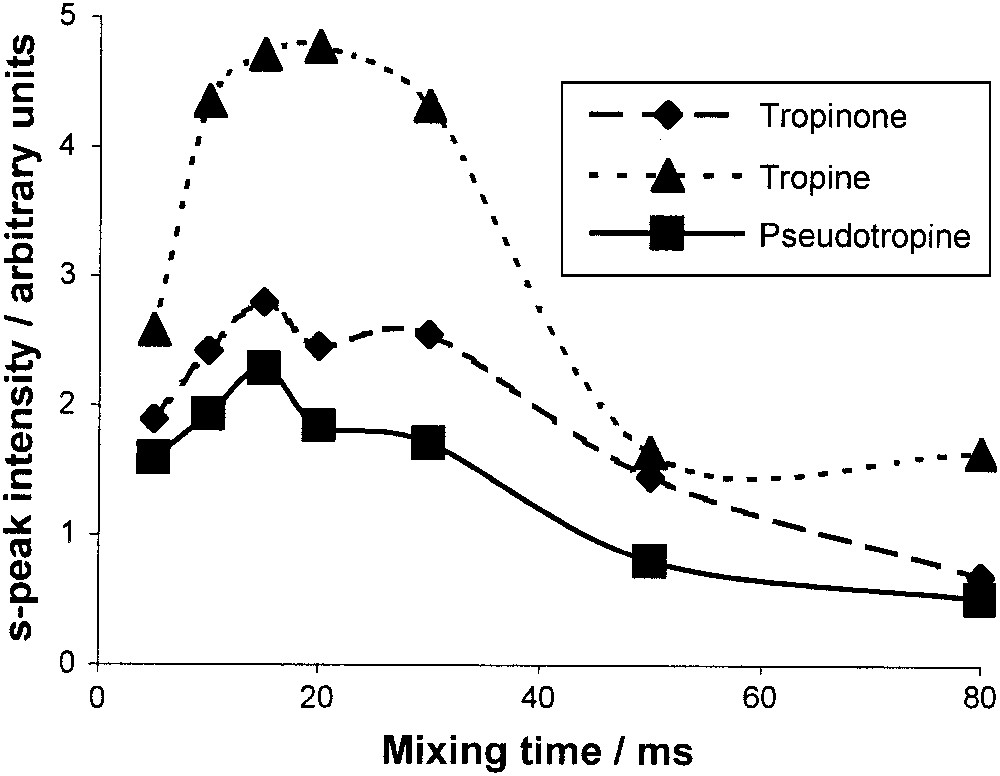
Optimisation of TOCSY mixing time.
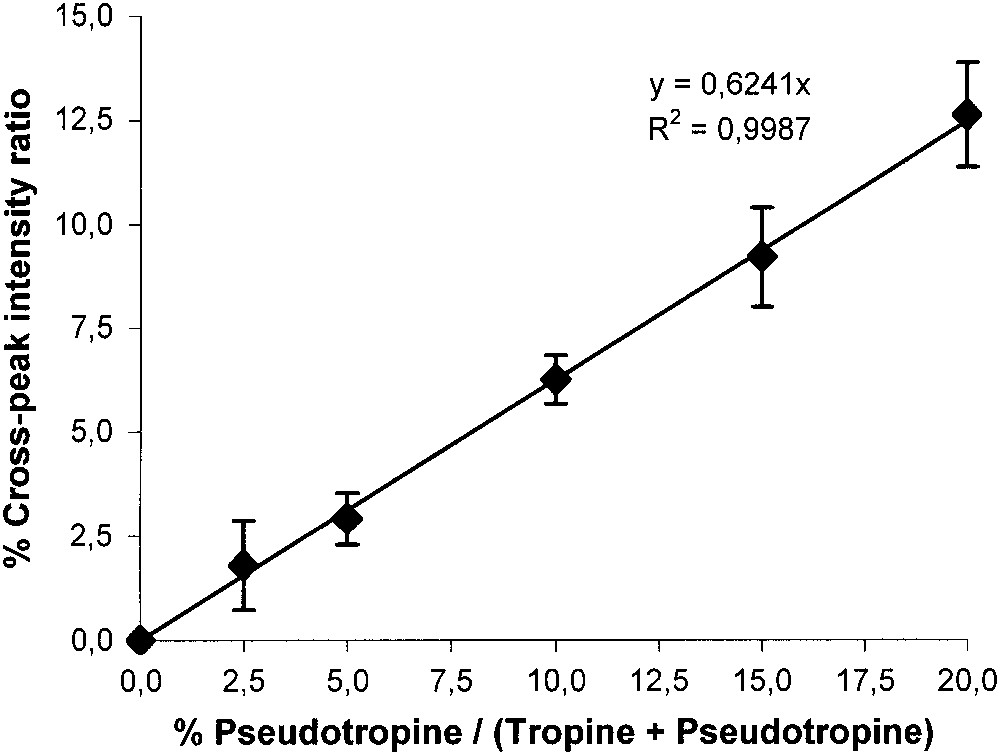
Calibration curve of pseudotropine/(tropine + pseudotropine).
3.3.2 In vivo kinetics of pseudotropine metabolism from 2D spectra
Fig. 10A shows the zone of interest for pseudotropine quantification at three different points during the in vivo NMR experiment. In the first four hours, the spectrum is dominated by tropinone but, possibly due to pH or temperature changes in the cell suspension, the tropinone peak has a tail that covers the expected region for the pseudotropine peak. In the third 4-h period, the tropine cross-peak has become higher than that for tropinone, and a pseudotropine cross-peak can be distinguished, but its quantification is too uncertain due to the tropinone tail. In the fifth 4-h period, however, the pseudotropine peak is clearly separated from the now smaller tropinone peak and can be quantified. The kinetics of degradation are shown in Fig. 10B. Tropinone is steadily lost, and completely disappears by 22 h. In parallel, tropine accumulates, though not quantitatively, indicating a net consumption of substrate. Pseudotropine, at least in the zone where it is quantifiable, is formed and degraded in parallel with the tropine. By the end of bacterial growth, all substrate has been consumed.

(A) TOCSY NMR spectra of in vivo experiment; (B) kinetics of tropinone metabolism by Pseudomonas AT3.
4 Conclusion
These experiments show for the first time that the in vivo kinetics of the metabolism of tropinone to tropine and pseudotropine by Pseudomonas AT3 can be quantified by combining 1D and 2D 1H NMR studies. This system provides a useful model for examining how different bacteria might metabolise potential therapeutic agents to a variety of metabolites. As in the case of the formation of pseudotropine and tropine described here, all metabolites are not necessarily accumulated simultaneously in the medium. The advantage of the NMR approach is that it follows all major metabolites in real time and, as is shown in this communication, can be used to quantify them. Other NMR experiments, such as HSQC 1H–13C, are under investigation for this purpose.
Acknowledgements
TAB wishes to thank the GERM committee for a grant towards her participation at the 20th annual GERM meeting, as well as the French `Ministère des Affaires étrangères' for a studentship. We are grateful to Dr. P.W. Trudgill (Department of Biochemistry, University of Wales, Aberystwyth, UK) for supplying the tropane-metabolising Pseudomonas strain and to Prof. B. Dräger (Institut für Pharmazeutische Biologie, Martin Luther University, Halle, Germany) for supplying the pseudotropine. We are grateful to Carol Wrigglesworth (Scientific English, Nantes) for linguistic assistance.