

1 Introduction
The Multiple-Quantum Magic-Angle-Spinning (MQMAS) method is very much used in solid-state NMR to obtain high-resolution 2D spectra of quadrupolar nuclei. In these spectra, an isotropic dimension is correlated to the anisotropic dimension that gives the usual MAS-broadened pattern of each resolved site. Since the discovery of MQMAS by Frydman and Harwood in 1995 [1], this experiment has been developed mainly in two ways. First, several pulse sequences have been proposed to improve the efficiencies of MQ excitation and conversion [2–15]. Second, two acquisition methods were introduced to obtain 2D MQMAS spectra with pure-adsorption lineshapes [16]: the amplitude-modulated method which generally includes a z-filter part [17] and the phase-modulated method which is associated with full-echo MQMAS [18,19]. In 2004 Gan and Kwak [20] introduced Soft-Pulse-Adding-Mixing (SPAM) as a solution to the efficiency and 2D-lineshape problems. Amoureux et al. [21] gave a complete description of this method which consists in adding several coherence transfer pathways constructively. Moreover, Gan and Kwak suggested the possibility of introducing into the SPAM MQMAS experiment the multiplex phase cycling initiated by Ivchenko et al. [22]. Very recently, Malicki et al. [23] proposed a multiplex SPAM MQMAS sequence (Fig. 1). One of the main advantages is the possibility, with the same acquisition, of recording 3Q and 5QMAS NMR spectra. However, the problem is the difference in pulse duration for the two MQ [24–27]. In this communication, we present a method based on the simulation of signal intensity depending on the pulse duration to find a compromise between the 3Q and 5QMAS spectra.
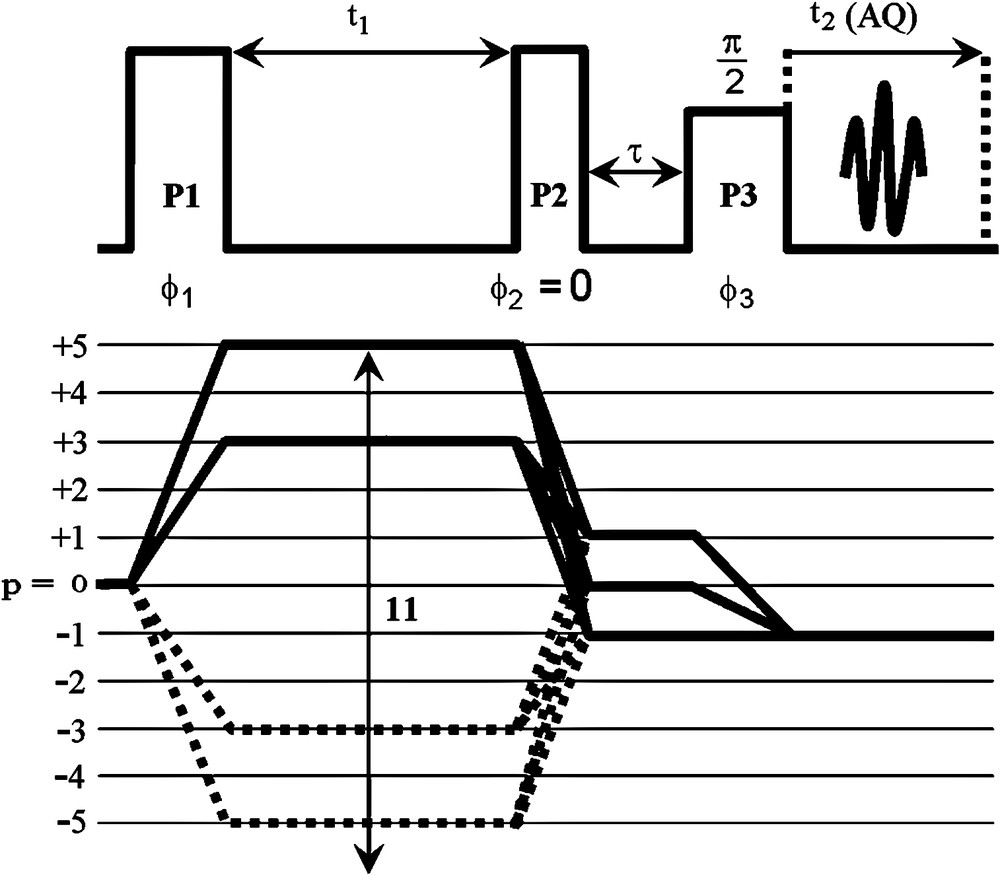
Multiplex SPAM MQMAS sequence for a spin I = 5/2.
2 Multiplex SPAM MQMAS sequence
This sequence [23] consists of three pulses: two strong pulses (P1 and P2) and one selective pulse (P3) (Fig. 1). The P1 pulse generates simultaneously all coherences available for the excited spin I, and after the MQ evolution period (t1), the P2 pulse puts this spin system along the z-axis of the laboratory frame. There is no phase cycling for the P2 pulse, and the receiver phase is always set to zero. The P3 pulse selects 0Q and ±1Q coherences, and the signal increase comes from transfers through these three coherence levels. To select individually all coherences, it is necessary to apply N1 (= 4I + 1) phases to the P1 pulse. For each value of this phase, two Free Induction Decay (FID) signals are recorded separately: a signal with a phase zero and a second with a phase π for the P3 pulse. These two phases for P3 are necessary to add the 0Q and ±1Q coherences in a constructive way: one of these two phases is for echo pathway, the other phase for anti-echo pathway. The time between P2 and P3 is short (1 μs) to avoid dephasing of the ±1Q coherences [23]. FID signals are stored in a 3D data file and when the acquisition is finished, the processing program “MSM” [28] reorganizes them in a normal 2D data file. This program treats signals according to:
| (1) |
3 Echo and anti-echo amplitude simulation
The pulse durations of P1 and P2 that provide maximum line intensity are not identical for the two coherences 3Q and 5Q. To study this difference, we developed [29] Mathematica-5 notebooks and SIMPSON1.1.1 Tcl scripts [30] to optimize the echo and anti-echo amplitudes for a z-filtered MQMAS experiment applied to a half-integer quadrupole spin. We start by determining the expressions of the irreducible spherical tensors V(2,0), W(2,0) and W(4,0) of the first- and second-order quadrupolar Hamiltonians and using the Wigner rotation matrix [31]. From these expressions we develop a Mathematica-5 notebook to simulate the intensity of the central line of a spin I excited by a MQMAS sequence (in our case the z-filter sequence). The first- and second-order quadrupolar interactions for a powder rotating at the magic angle are taken into account during the pulses. We consider that the NMR line intensity, which depends on the various interactions involved during the RF pulses, is proportional to the echo amplitude. This program calculates the theoretical line intensities of the central transition versus the variable duration and for various experimental parameters (spin I, RF amplitude ΩRF/2π, variable pulse duration, rotation rate, MQ desired) and estimated values of CQ and η. This simulation can also be performed with the SIMPSON program. The agreement between our simulations and those obtained with SIMPSON is excellent, the values of these simulations being identical with an accuracy of 10−9. SIMPSON gives 9 digits after dot for a real number.
To illustrate the difference between P1 and P2 pulse durations, we use our Mathematica-5 notebooks applied to 27Al (I = 5/2) (parameters are given in the caption of Fig. 2). We simulate (Fig. 2) the intensity of the central line according to each pulse, and this for a 3Q and 5QMAS experiment. We observe that for the three pulses the intensity of the 5QMAS experiment is always lower than that of the 3QMAS experiment. This is foreseeable since coherence leap for a 5Q is larger than for a 3Q. The line intensity variation versus the P3 pulse duration is identical for the two experiments, and 8 μs is the best intensity (not shown). This is also expected because this pulse makes the same jump in the two experiments. This 8-μs pulse duration corresponds to the 90 selective pulse for the central transition at ΩRF/2π = 10 kHz (which is exactly 8.33 μs). For P2 and P1 pulses the maximum durations are different:
| (2) |
| (3) |

Maximum echo amplitude optimization by simulation of P2 and P1 pulse durations for the z-filtered MQMAS sequence obtained with Mathematica-5 notebooks for 27Al (I = 5/2). The simulation parameters are rotor spinning speed: 5 kHz; Larmor frequency: 104.309 MHz; amplitude of the strong radio-frequency pulse (P1 and P2): 90 kHz; amplitude of selective pulse P3: 10 kHz; quadrupolar coupling constant: 1.75 MHz; asymmetry parameter η = 0.5; quadrupolar interaction: first- and second-order. tP3 = 8 μs. (A) tP1 = 4 μs for 3Q (■) and 5Q (▴); (B) tP2 = 1.5 μs for 3Q (■) and tP2 = 2.5 μs for 5Q (▴).
The echo amplitude for the 5QMAS experiment is much lower than for 3QMAS and thus optimization is much longer. To limit the latter, we propose to use our simulation program. We start by optimizing the echo amplitude experimentally according to the pulse durations for the 3QMAS experiment. From this study and by estimating the quadrupolar coupling, we can simulate the variation of the echo amplitude according to the pulse duration for the 5QMAS experiment.
4 Experimental considerations
It is fairly easy to avoid peak aliasing in the F2 dimension of a 2D spectrum but it is more difficult to anticipate this problem in the F1 dimension. For a 2D MQMAS spectrum, on the one hand, it is not easy to predict the positions of the various crystallographic sites in the isotropic F1 dimension and, on the other hand, the off-resonance position in F1 differs from that of F2 by a factor (k − p) [32]. Thus, it is necessary to determine by simulation or a brief experiment which is the smallest spectral width in the F1 dimension SW(F1). We will then be able to deduce the maximum increment usable for the F1 dimension.
Moreover, the smallest spectral width in the F1 dimension SW(F1), which avoids peak aliasing during the acquisition of a 5QMAS spectrum, is five times larger than for a 3QMAS spectrum. The position of the center of gravity of the peak relative to the carrier frequency in the F1 dimension is given by [32]:
| (4) |
| (5) |
| (6) |
| (7) |
| (8) |
Parameters: spin I, coherence order p, λ and echo position k
| I | pQ | ||||
| 5/2 | 3Q | −3/4 | 19/12 | −17/12 | 5/6 |
| −5Q | −25/4 | 25/12 | 85/12 | −25/6 | |
| 7/2 | 3Q | −9/5 | 101/45 | −34/45 | 4/9 |
| 5Q | 1 | 11/9 | −34/9 | 20/9 | |
| 9/2 | 3Q | −9/4 | 91/36 | −17/36 | 5/18 |
| 5Q | −5/4 | 95/36 | −85/36 | 25/18 |
5 Experimental
MAS NMR experiments were performed on a Bruker AVANCE400 spectrometer at 9.4 T and with a 4-mm zirconia rotor. 27Al 3Q and 5QMAS spectra were acquired with the multiplex SPAM MQMAS sequence [28]. The P1 and P2 pulse durations were 4.5 and 2.0 μs, respectively (ΩRF/2π = 92 kHz). The P3 pulse duration was 6.5 μs (ΩRF/2π = 10 kHz). The multiplex spectra were acquired at a spinning rate of νRot = 14 kHz, with a 0.25-s recycle delay, 2 μs for the increment of the t1 period, 210 sections and 140 accumulations. Data processing was performed using the “MSM” program [28]. Shearing transformation and scaling of the F1 axis was realized with “xfshear” [28] or with Grandinetti's RMNFAT program [34]. Tetraethylammonium BEA (TEABEA) zeolite (with Si/Al = 11 and Na/Al < 0.1) was provided by Dzwigaj et al. [35]. More details are given in Section 6.
6 Results and discussion
From the same acquisition, the multiplex SPAM sequence allows us to extract 2D spectra corresponding to various pQMAS experiments. For a spin I = 5/2 the “MSM” program will generate 3Q and 5QMAS 2D spectra. In practice, it is unfortunately not easy to obtain good signal-to-noise ratios for both spectra. There are differences in the optimal experimental parameters to obtain MQ coherences of orders 3 and 5.
By using the previous considerations (spectral width in the F1 dimension and number of increments) and pulse duration optimization, it is possible to extract from the same acquisition 3Q and 5QMAS 2D spectra. We will apply the multiplex SPAM sequence to the case of aluminium-27 (I = 5/2) in TEABEA-11 zeolite to demonstrate our method.
We start by optimizing the pulse durations for the two experiments (3Q and 5QMAS) with a 1D z-filtered MQMAS sequence. The pulse duration P3, corresponding to the best intensity, is identical for the two experiments (6.50 μs for ΩRF/2π = 10 kHz). Fig. 3A–D presents experimental optimizations of the pulse durations P2 and P1, respectively. It shows, as expected, that the durations t2 (max) and t1 (max) corresponding to the best intensities for the two experiments are different. Indeed:
| (9) |
| (10) |

Experimental optimizations of P2 and P1 pulse durations of the z-filtered MQMAS sequence obtained for 27Al in TEABEA-11 zeolite with 240 scans and tP3 = 6.5 μs. (A) tP1 = 3.0 μs for 3Q, (B) tP1 = 3.5 μs for 5Q, (C) tP2 = 3.5 μs for 3Q and (D) tP2 = 4.5 μs for 5Q.
For the 3QMAS 2D experiment, the smallest spectral width of the F1 dimension, which avoids peak aliasing during the acquisition of TEABEA-11, is equal to 24 kHz, but this is not sufficient for the 5QMAS experiment. The minimum width which will be appropriate for both experiments is SW(F1) = 120 kHz.
Now we will determine the minimum number of sections necessary to the F1 dimension and this without having a truncated signal. The maximum delay (t1) between the first two pulses, for which we always observe a signal, is 320 and 420 μs for 5Q and 3Q coherences, respectively.
The signal of 5Q coherences decreases more quickly than that of 3Q coherences. Thus, for a 2-μs increment, we will use 210 sections for , to obtain a value of at least t1 = 420 μs.
Fig. 4A–B represents the 3Q and 5QMAS 2D multiplex SPAM spectra, respectively and are obtained from the same acquisition with a good signal-to-noise ratio. In the 3QMAS spectrum, we observe two resonances which correspond to the octahedral and tetrahedral environments of the aluminium atoms. With 5Q coherences, which give a better resolution, we observe two sites and from the F1 projection. Omegna et al. [36] and Capek et al. [37] also observed these tetrahedral sites. The resolution increase obtained with the 5QMAS experiment seems to indicate that the homogeneous interactions are not weak. Indeed, 3QMAS experiments are more sensitive to homogeneous broadening than 5QMAS [33,38,39].
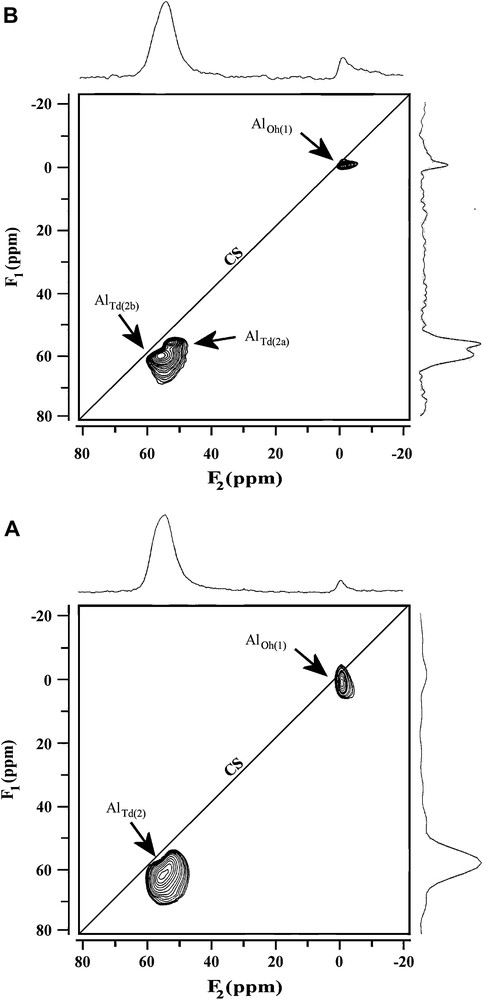
27Al 3QMAS (A) and 5QMAS (B) multiplex SPAM MQMAS spectra of TEABEA-11 zeolite obtained with the same acquisition.
For our sample, the signal of 5Q coherences decreases much faster than that of 3Q coherences. In this case, we could record 3Q and 5Q spectra separately and obtain for the same experimental time a slightly better sensitivity. Indeed, we will use P1 and P2 durations corresponding to the maximum of the signal for each experiment and not to intermediate values. Moreover, we will be able to increase the increment of the 3Q experiment to reduce the spectral width and obtain overall the same number of sections as previously. It seems that recording 3Q and 5QMAS experiments simultaneously and handling of one data file is interesting in the case of samples where the decreases versus t1 in 3Q and 5Q coherences are not too different.
7 Conclusion
We proposed a procedure to obtain simultaneously 3Q and 5QMAS 2D spectra from the multiplex SPAM sequence. This method indicates how to choose the experimental parameters to obtain good sensitivity in both experiments. More generally, to reduce the time for pulse duration optimization in the 5QMAS experiment, we propose to use our simulation programs. Moreover, we indicate and discuss the precautions to be taken to go from a 3QMAS spectrum to a 5QMAS spectrum avoiding peak aliasing and a truncated signal. We apply this method to TEABEA-11 zeolite and obtain good 3Q and 5QMAS spectra.