

1 Introduction
Nuclear Quadrupole Resonance (NQR) was developed since 1950 [1,2], four or five years after NMR. Indeed, the NMR and NQR experiments share many features with, however, a major difference: NQR does not require an external static magnetic field, but just a radio-frequency field for inducing transitions. It is the quadrupolar interaction (between the quadrupole moment of a nucleus with a spin greater than 1/2 and the electric field gradient at the considered nucleus) which is responsible for the energy level splitting, thus the possibility of transitions between distinct energy levels in a zero static magnetic field (pure NQR). In fact, the quadrupolar interaction (via the electric field gradient) is a tensorial quantity, the trace of which is zero because of the Laplace equation (ΔV = 0). As a consequence, NQR is not operative for a liquid state sample, since, in that case, as far as energy level splitting is concerned, molecular tumbling implies that one must deal with the third of the trace of any interaction. Thus NQR is reserved to solid-state samples (single crystals or powders) without any preferential direction; this is not the case for solid-state NMR, where the Zeeman interaction imposes the direction of the magnetic field B0 as the “quantification axis”. Rather, in a powder sample, essentially considered throughout, the preferential directions are the principal axes of the electric field gradient (efg) tensor (also called Principal Axis System PAS) which are different from one microcrystallite to the other. This is the first difficulty (probably more severe) when interpreting NQR results, which must therefore be considered through an integration over all microcrystallites of the sample. The other difficulty arises from the weak splitting of energy levels (in the range 500 kHz to 6 MHz for 14N) which, because of the Boltzmann distribution, explains the poor sensitivity of nitrogen NQR spectroscopy.
It turns out that the efg is a sort of fingerprint of the electronic distribution within a nitrogen-containing molecule and that, as a consequence, is so for the NQR frequencies. Thus 14N NQR appears as a unique tool [3] for characterizing and identifying nitrogen-containing molecules such as explosives and drugs [4] (remember that 14N solid-state NMR is rather inoperative). In spite of these appealing features, manufacturers do not offer any instrument capable of running specifically 14N NQR experiments. It is the aim of this paper to report our attempts for devising such an instrument homemade from A to Z. Much effort has been directed toward its versatility and to the possibility of implementing new experiments. This can be achieved because every aspect of the instrument (hardware and software) is perfectly mastered. After recasting the basics of spin 1 (14N) pulsed NQR spectroscopy, we shall provide a didactic description of some parts of the instrument (hardware and software) in relation with the intrinsic problems of this spectroscopy. Indeed, we do not claim that this instrument is really new but our objective is rather to report on the achievement of a spectrometer adapted to the needs of the laboratory.
2 Basics of pulsed 14N quadrupole resonance
A spin 1 [5] can be characterized by the three eigenstates of its operator which we denote by (corresponding to the quantum numbers m = 1, 0, −1) and which are such that:
| (1) |
The quadrupolar Hamiltonian [6], expressed in rad s−1, in the case of an efg tensor of axial symmetry can be written as:
| (2) |
As shown in Fig. 1, left, there are only two energy levels, one corresponding to m = 0 with an energy value equal to and the other corresponding to m = ± 1 with an energy equal to . A single transition is possible at the frequency ωQ.
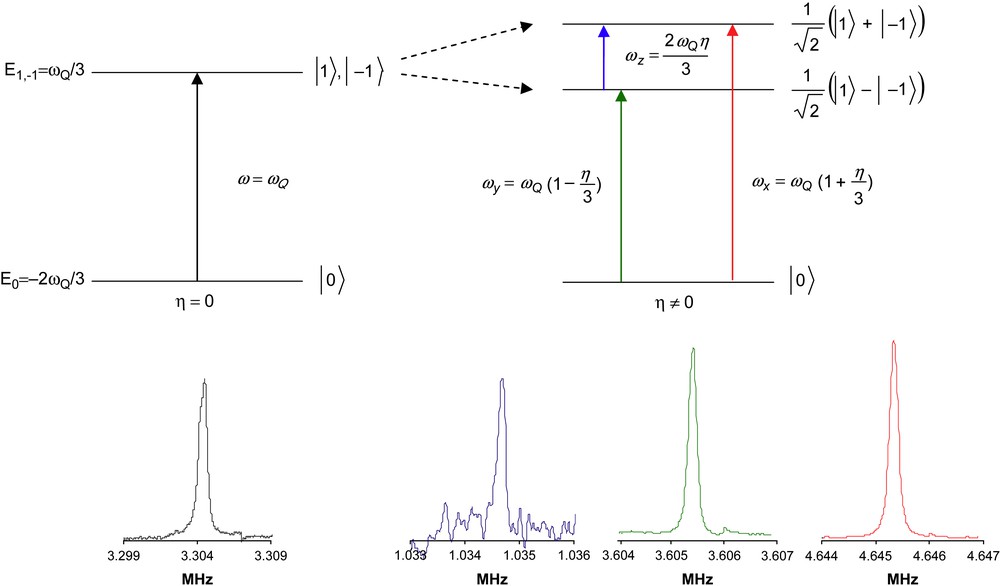
Energy-level diagrams for a spin 1 nucleus with an efg tensor of axial symmetry (left, ) and an efg tensor without symmetry (right, ). For each transition, an illustrative nitrogen-14 QR spectrum (obtained at ambient temperature by accumulating 5000 transients) is shown. Left: the single line of hexamethylenetetramine (HMT), linewidth at half height: 660 Hz. Right: the three lines of sodium nitrite (NaNO2), linewidths at half height from left to right: 183 Hz, 195 Hz, 207 Hz; 10 mm o.d. tubes contained about 0.3 g of powder.
The situation is a little more complicated when the efg tensor ceases to be of axial symmetry. In that case, the Hamiltonian has the form:
| (3) |
Throughout, the rf field is supposed to be applied in the form of pulses. In order to understand how an rf pulse operates on the nuclear spins, let us consider the case of an efg tensor of axial symmetry and a single crystal with the rf field perpendicular to the symmetry axis. In this case, it is a simple matter to show that the rf pulse [8] (of duration τ) induces a coherence (thus a signal which can be detected by the rf coil) and that the amplitude of this coherence is proportional to with . This is equivalent to NMR, except that the effective B1 amplitude is twice the NMR B1 amplitude. This feature can be understood by the fact that the quadrupolar Hamiltonian involves , whereas the NMR Hamiltonian, through the Zeeman term, involves Iz. The immediate consequence is that the NQR experiment is twice less demanding than the NMR experiment, as far as the rf power amplifier is concerned. From a practical point of view, this means that a 300-W power amplifier is largely sufficient for most NQR applications (see Section 3). These considerations can be extended to the general case provided that the rf field is oriented perpendicular to the axis associated with the transition (ωx, ωy, ωz) [9]. Thus, as in NMR, we can rely on the concept of flip angle, recognizing, however, that the required rf amplitude is half that of NMR. Now, if we are dealing with a powder instead of a single crystal, we have to consider the orientation of the rf field within each microcrystallite. This problem has been addressed previously but with somewhat contradictory results [10–15]. This implies an average over all microcrystallites, thus over the two polar angles θ and φ (see Fig. 2). This average concerns not only the flip angle, but also the receptivity by virtue of the reciprocity principle. In the simple case of an axially symmetric efg tensor, this average has to be performed on the sole angle θ. The signal itself is thus proportional to whereas the receptivity factor is given by . Altogether, the detected signal is given by the following integral:
| (4) |
| (5) |
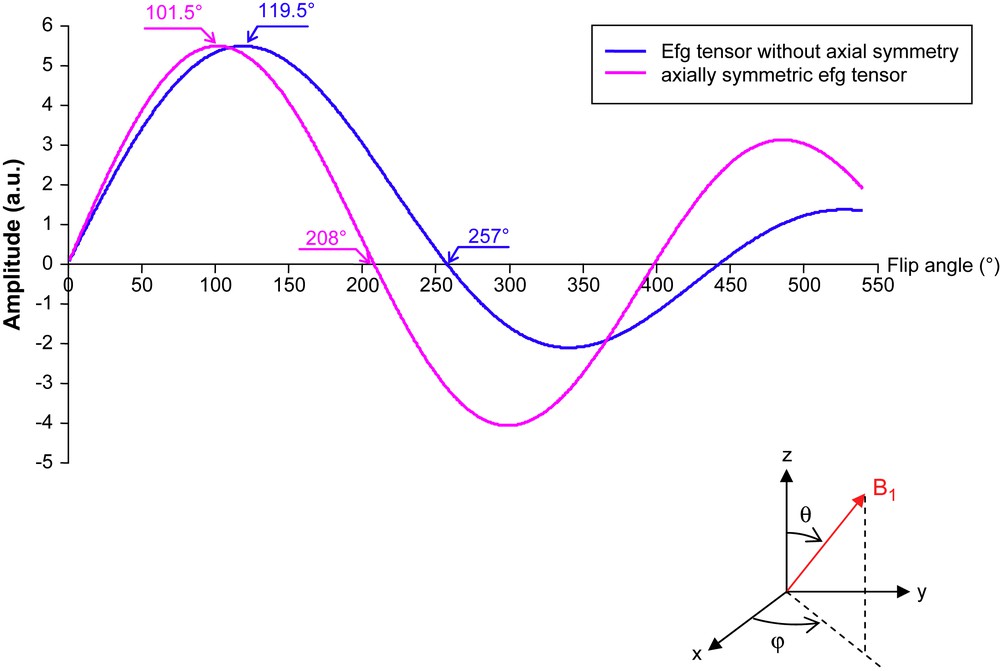
Theoretical nutation curves (signal intensity as a function of the pulse length τ or, equivalently, of the “flip angle” ). These particular features (with respect to sine functions observed in the case of NMR) are due to the necessary powder average performed over the angle θ and φ shown at the bottom (when not dealing with a single crystal). These curves have been experimentally verified.
It turns out that for symmetry reasons the integral represented by Eq. (5) is also valid for the two other transitions ωy and ωz. Unfortunately, integrals in Eqs. (4) and (5) cannot be solved analytically and must therefore be calculated numerically. Nevertheless, Eqs. (4) and (5) represent universal formulas for the cases and , respectively. They can be used for plotting the so-called nutation curves which predict the signal amplitude as a function of the pulse length (or as a function of the flip angle α). These curves are displayed in Fig. 2. Note that, for NMR of liquids, such curves are perfect sine functions which lead to the pulse lengths corresponding to 90°, 180°, 270°… flip angles. By contrast, in NQR, these nutation curves are sort of damped sine functions with maxima, zeroes, minima… occurring at values of α different from 90°, 180°, 270°…, as shown in Fig. 2. We shall therefore dub “pseudo 90° pulse” the rf pulse corresponding to the first maximum of the nutation curve, and “pseudo 180° pulse” for the first zero of this nutation curve. The fact that the nutation curves corresponding to and are different is rather puzzling if one considers the situation . As a matter of fact, in that situation, the line ωz disappears, whereas the two lines ωx and ωy tend to coalesce. They are, however, 90° out of phase and their resultant no longer obeys the “universal” nutation curve for the case . Rather, this resultant now obeys the “universal” nutation curve for the case .
Now, all experimental spectra presented here have been obtained from the Fourier transform of (possibly averaged) “free induction decays” (fid, according to the abbreviation used in NMR) which are acquired subsequently to the application of an rf pulse. Some typical examples are presented in Fig. 1 and show the inherent poor sensitivity of 14N NQR which is due to the weak difference in energy level populations and which, of course, still decreases when the transition frequency decreases (see the 1.04 MHz line of sodium nitrite). Finally, the usual way to tackle sensitivity problems is to perform data averaging. As far as NMR is concerned, an optimum has to be found between relaxation and experiment repetition. By contrast, in NQR, it has been demonstrated [16] both theoretically and experimentally that, for optimum overall sensitivity, the repetition rate can be kept as low as possible, the only limitation arising from a proper sampling of the fid. This surprising property is illustrated in Fig. 3 and can be understood on the following grounds: when applying an rf pulse, most microcrystallites undergo a very weak effective flip angle due to the orientation of the rf field with respect to the orientation of the efg tensor. Thus, their magnetization returns quickly to equilibrium irrespectively of the time elapsed between two consecutive pulses. It is the fundamental reason why the poor sensitivity of NQR can be circumvented by data averaging. There exists another procedure for acquiring the NQR signals based on the formation of echoes by application of a pseudo 180° pulse train. This will not be considered here but has been abundantly treated in the literature [17–20].
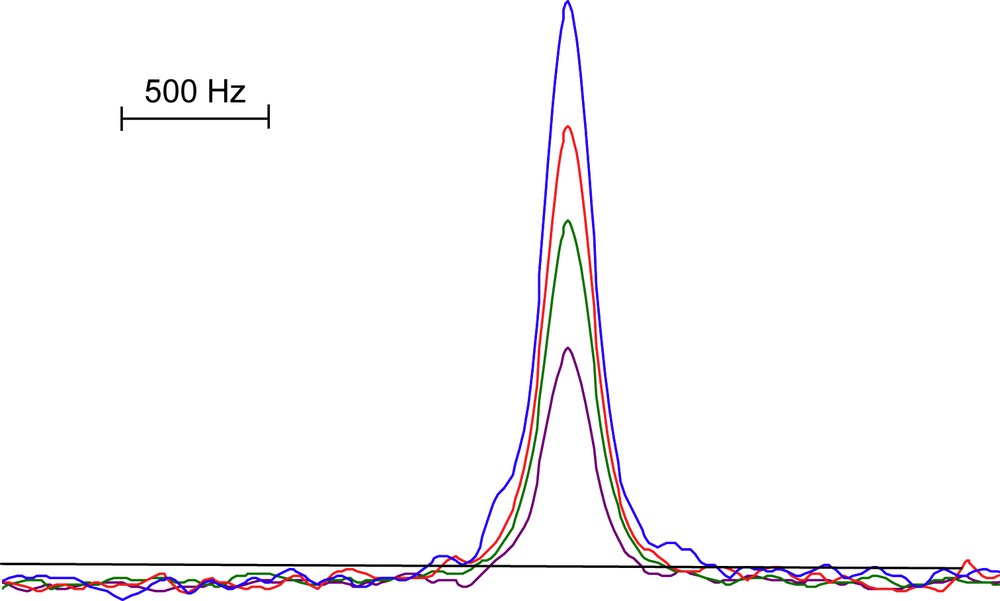
The highest frequency line of sodium nitrate (4.6 MHz) obtained in 22 s for different values of the ratio T/T1 where T is the repetition rate of the experiment and T1 the longitudinal relaxation time. From top to bottom: T/T1 = 1.3, 2, 3, 5. The number of transients has been adapted to the value of T for fulfilling the condition of a total measuring time of 22 s. The signal intensity is seen to definitely increase whenever T decreases.
3 The NQR spectrometer: hardware
The design is somewhat classical (Fig. 4) and can be considered as a simplified NMR console with reliable and easy to handle components. It is operative at relatively low rf frequencies (0.5–100 MHz), the range 0.5–6 MHz being effective for nitrogen-14 NQR. Ethernet cables are used for physical links between the main PC computer (shown in Fig. 4) and those modules of the spectrometer which must be under computer control. As most elements are of commercial provenance, we shall neither describe in detail the corresponding units, nor mention their performances. They are similar to those of a standard NMR spectrometer.
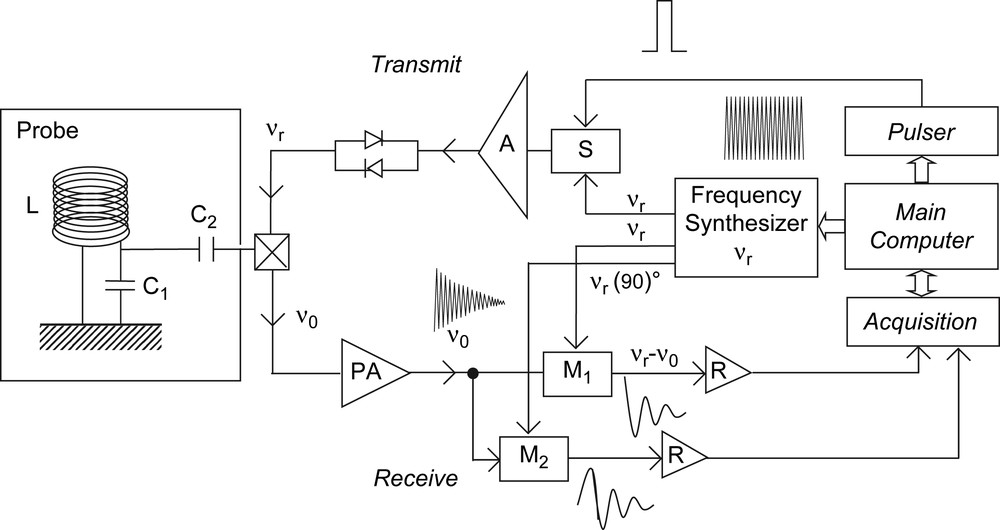
Layout of the multi-frequency NQR spectrometer. The “pulser” unit generates all signals required by the NQR experiment. The frequency synthesizer is of the DDS (Direct Digital Synthesis) type. (S) is an rf switch (see Fig. 5) producing an rf pulse which is fed to the power amplifier (A). The two crossed diodes do not affect transmit operations but isolate the transmit part during receive operations. The cross inside a square stands for a device (diodes and tuned circuits) which isolates the receive part during transmit operations. (PA) is a low-noise preamplifier. (M1) and (M2) are mixers (see Fig. 5) which convert the high-frequency NQR signal into two quadrature low-frequency signals bearing the same characteristics as the NQR signal. (R)s are low-frequency receivers (including a low-pass filter and an amplifier) which produce signals appropriate for data acquisition and averaging (“Acquisition” unit).
3.1 The frequency synthesizer
It is of the DDS (Direct Digital Synthesis) type and has the ability to produce two independent outputs, 90° out of phase, which are mandatory for quadrature detection. The transmit channel is under computer control (through the “pulser” see below) making quite versatile the choice of frequency or phase during any experiment.
3.2 The “pulser” unit
It is accommodated by a dedicated PC which loads, from the main computer, all the events corresponding to a given pulse sequence. Five outputs are available: (1) pulses of specified durations for driving the radio-frequency transmitter; (2) a pulse bracketing the rf pulse with, on each side, two delays of 1 μs each for blanking the power amplifier outside the transmit periods; (3) and (4) two lines for determining the phase of the rf output (x, −x, y, −y) connected to the frequency synthesizer; (5) a signal which triggers the acquisition unit. It can be noted that, until now, these features have satisfied our needs. For more elaborated experiments, an extension of this device could be easily considered.
3.3 The radio-frequency unit
All rf elements are gathered in this unit. As it has been entirely homemade, its block diagram is shown in Fig. 5. It is used for transmit operations including the modulation of rf output through dc (direct current) pulses generated by the “pulser”. These rf pulses are fed to an rf power amplifier (which can deliver a maximum output of 300 W) connected to the probe coil. In fact, typical outputs of the power amplifier are kept around 100 W, which is quite sufficient for obtaining pseudo 90° pulses of the order of 10 μs. Independently, at the receive stage the NQR signal is demodulated with respect to the synthesizer frequency (νr) for providing the low-frequency signal (s): (i) one signal in the case of single channel detection, (ii) two signals (90° out of phase) for quadrature detection. In this latter case, this implies that two reference frequencies (νr), 90° out of phase, are available (from the frequency synthesizer). The merit of quadrature detection, in terms of sensitivity (a theoretical increase by a factor ), is illustrated in Fig. 6. It is well known that the quality of this type of detection depends strongly on the 90° phase difference between the two channels. A major advantage of the two outputs of our DDS system is that this difference can be exactly achieved in any circumstance, very importantly, at any frequency, making the rf unit really broad-band.
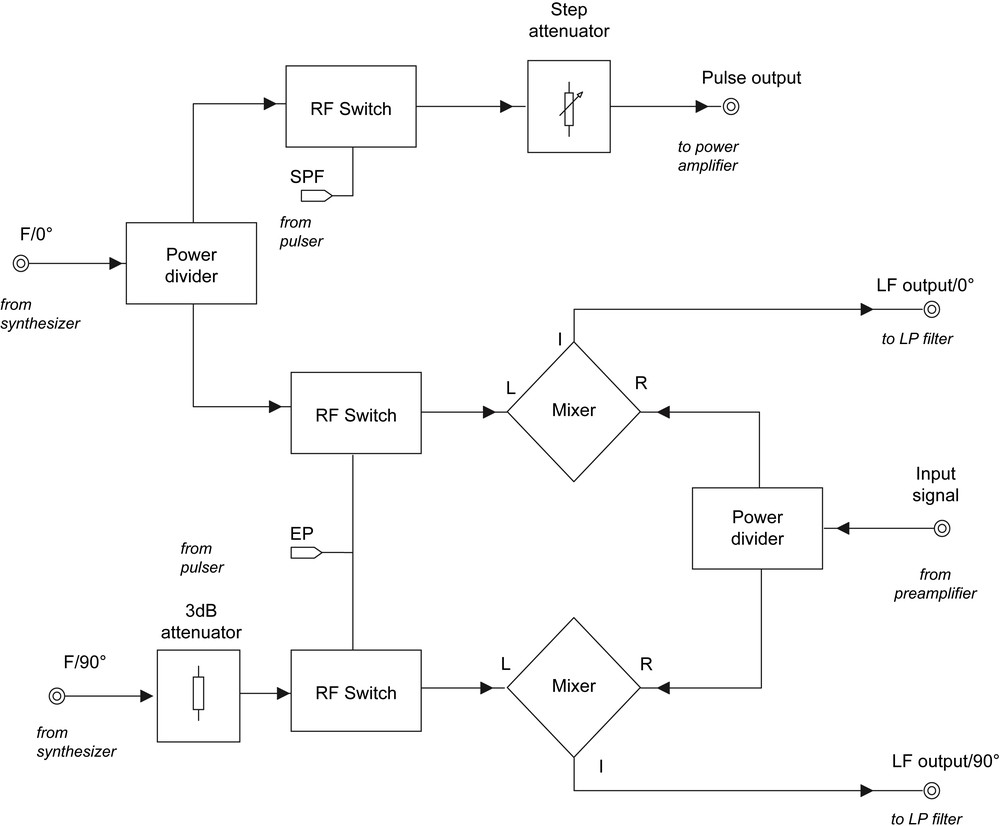
Block diagram of the rf unit. Top: transmit section; SPF is a dc pulse generated by the “pulser” used for the generation of the rf pulse. Bottom: receive section; the command EP switches off the receiver during transmit stages (optional, not in use in the present arrangement). F/0° and F/90° stand for the two reference frequencies (νr of Fig. 4), 90° out of phase.
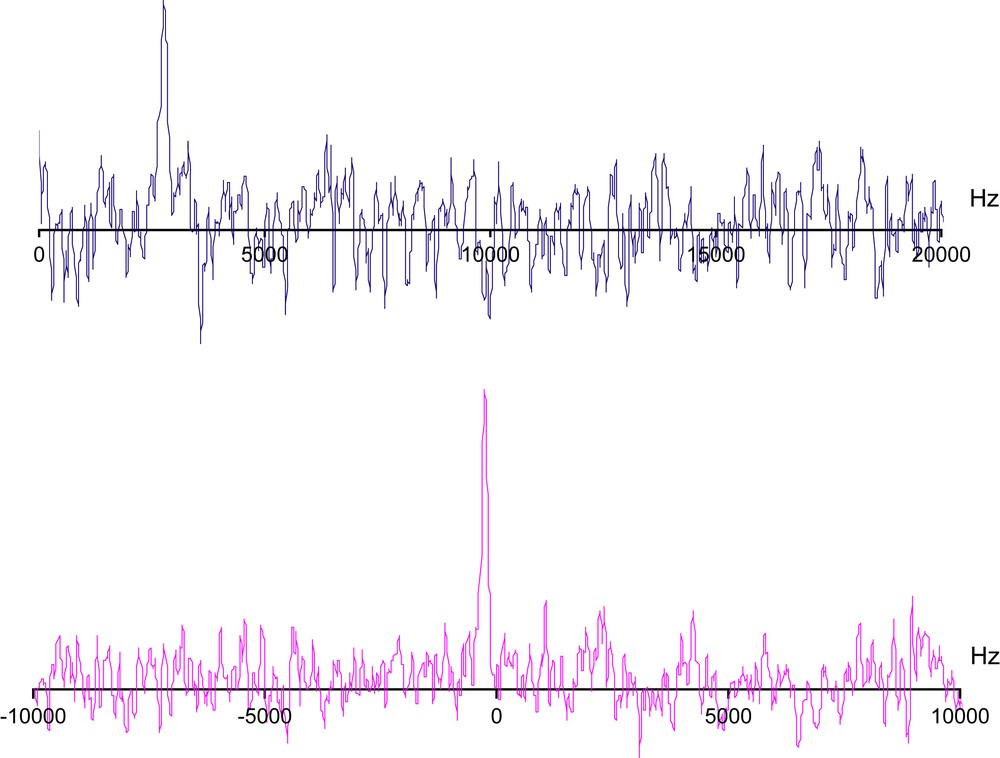
One scan spectra of the highest frequency sodium nitrite transition (4.6 MHz). Top: single channel detection. Bottom: quadrature detection.
3.4 The low-frequency unit
It is sketched in Fig. 7 for one of the two channels (used for quadrature detection). All analog components are set digitally from the main computer. They include a programmable-gain low-frequency amplifier, a digital programmable low-pass filter, set normally at a cut-off frequency equal to the spectral width and a programmable offset correction via a serial voltage-output digital-to-analog converter. This latter arrangement, not really common in magnetic resonance instruments, proved to be very useful in our case to compensate for dc (direct current) components which can occur due to the direct demodulation process and the relatively low working frequencies.
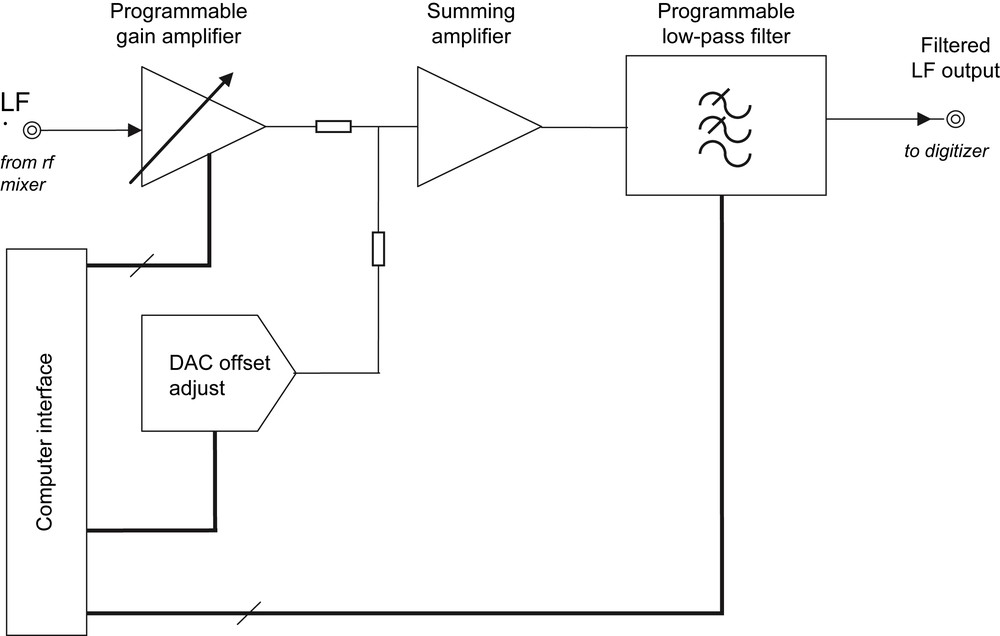
Block diagram of half the low-frequency unit. Two such circuits, including amplifiers and filters (under computer control), are operative in case of quadrature detection. DAC stands for digital-to-analog converter. They deliver signals appropriate for analog-to-digital conversion and data averaging.
3.5 Probes and preamplifier
Several probes have been built according to specific applications. Most of the time, for 14N observation, we use a probe which includes a 60-turn solenoid (54 mm height, 14 mm i.d. and 18 mm o.d., made of enamel copper wire of gauge 0.7 mm) which can be tuned and impedance-matched from 700 kHz up to 6 MHz by means of interchangeable capacitor sets (see Fig. 8), namely capacitors CT (tuning) and CM (matching) of Fig. 9. Typical values for a probe operating at 4.64 MHz are CT = 44 pF, CM = 22 pF leading to a Q value of 230. Also, the probe geometry is such that it can be used in the gap of a variable-field electromagnet enabling us to perform NMR measurements at the NQR frequency and thus estimating the rf field amplitude with some confidence. In Fig. 9 is shown the whole circuit which enables the probe to be connected either to the transmitter (power amplifier, transmit stage), or to the receiver system (preamplifier, subsequently to an rf pulse). As already mentioned, the crossed diodes in the transmit channel, which are conducting when the rf pulse is on, just prevent the NQR signal to flow toward this channel instead of the receiver channel. Protection of the preamplifier is a little more subtle. A λ/4 line could be used [21] but we have found more practical to have recourse to tuned circuits according to procedures commonly employed [22], as shown in Fig. 9. This will be briefly explained now. In the present arrangement, the preamplifier is made of two cascaded low-noise amplifiers. When the rf pulse is on, P is at a high potential and the diodes at input of the preamplifier are conducting and therefore protect it. However, the rf pulse must flow toward the probe and must therefore be blocked below point P. This is achieved by the fact that the circuit between P and the preamplifier input reduces to the parallel circuit (L′, C1) which has been tuned at the relevant frequency. Conversely, at the receive stage, these diodes are open and we have to consider the whole circuit (C1, L′, C2). With C2 = C1, it is equivalent to a simple 50 Ω impedance and consequently does not affect (in principle) the NQR signal. This implies that, when going to another frequency, one has to change the values of the inductance L′ and of the capacitors C1 and C2. These capacitors and inductance are placed in a removable box (blue rectangle of Fig. 9) which is useable in range of 1 MHz around the rated value. We have made as many boxes as necessary owing to the investigated transitions, allowing us very easily to switch from one transition to the other or from one compound to the other. It can also be mentioned that, with such a system, it is a matter of minutes to go to chlorine NQR (Fig. 10). At these low frequencies, probe ringing is known to be important and we have found that a dead time as long as 300 μs was necessary. In spite of this seemingly prohibitive feature, the sensitivity remains very acceptable.
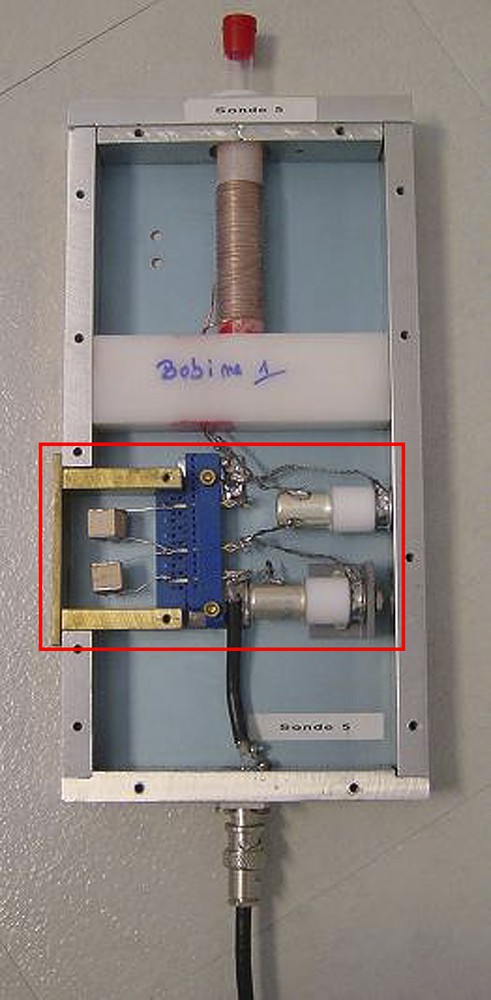
Photograph of one of our standard probes, showing the removable box (red rectangle) containing the tuning and matching capacitors.
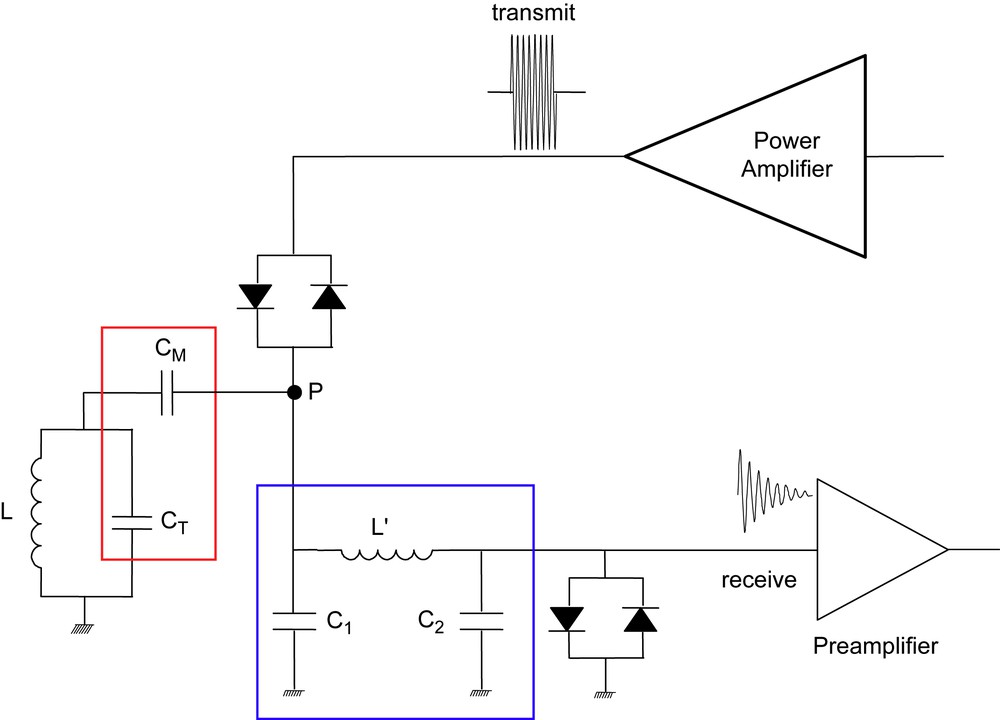
Block diagram of the probe and its associated switching circuits. L is the inductance of the probe solenoid. CT and CM are the tuning and matching capacitors, respectively. C2 = C1 (C1 being nevertheless a high voltage capacitor) and L′ are such that the (C1, L′, C2) circuit has an impedance of 50 Ω when diodes inserted before the preamplifier are open (receive stage). When these diodes are conducting (transmit stage), (C1, L′) acts as an anti-resonant circuit (L′C1ω2 = 1, ω being the spectrometer frequency in rad s−1). The red rectangle corresponds to the tuning and matching circuits which include a removable box (see Fig. 8), while the blue rectangle corresponds to the removable box close to the preamplifier input.
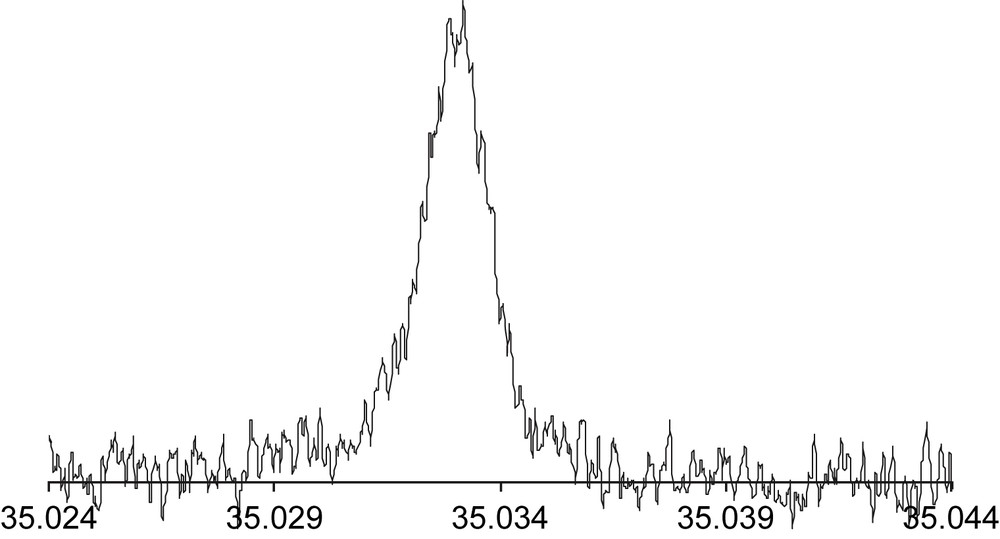
The 35.03 MHz chlorine-35 NQR spectrum of 1,3,5-trichlorobenzene (10 scans). Note the important linewidth.
3.6 The acquisition unit
It is accommodated by a dedicated PC which loads, from the main computer, all parameters required by a 12-bit analog-to-digital sampling card acquiring simultaneously data from the two quadrature channels at a maximum rate of the order of 1 MHz. Sampling is triggered by a signal coming from the “pulser” (see above). Data are stored, coherently added in the RAM's of the dedicated PC and read into the main computer according to protocols described in Section 4.
4 The NQR spectrometer: software
The software has been entirely developed in this laboratory. It is therefore perfectly mastered and can be adapted at will to new experiments. It is composed of independent units permitting to avoid any conflict and rendering it, as a whole, especially versatile. Communication between the main computer (a powerful portable PC) and the devices described above (including dedicated PC's) is via the Ethernet protocol with a switch for directing data to the desired device. The code of the main computer is written in Java and is developed on a Linux operating system called Fedora. We now describe briefly the different software modules (possibly outlining their specificities) which have been either adapted from homemade existing software or created in accordance with the structure of our NQR spectrometer.
4.1 Data processing
By the end of any experiment, the (possibly accumulated) fid is displayed and the data processing unit is active waiting for commands from the keyboard. Of course, the same can be done for any data set previously stored in an appropriate file. The usual operations (Fourier transform, phase correction, apodization, peak picking…) can be performed on single channel or quadrature data.
4.2 Data visualization during the NQR experiment
The client/server technique is used for the relations between two computer programs (the corresponding code is written in C language) in which one program, the client, makes a service request from another program, the server, which fulfils the request. This technique is employed between the main computer and the PC devoted to data acquisition. Exchanges and data are managed by two Berkeley sockets (one for the client and one for the server). The Berkeley sockets application programming interface comprises a library for developing programs in the C language that perform communications between two hosts.
During data averaging, the latest accumulated fid which could be entirely transferred is displayed by the main computer. The current number of scans is also displayed; horizontal and vertical zooms are allowed in order to perfectly examine experimental data in the course of the averaging process.
There exists another mode for which the experiment is repeated without data averaging, the objective being the adjustment of some instrumental parameters. The unitary fid is thus displayed at each scan with the possibility to modify (in real time and from the keyboard) the receiver gain and the dc offsets (independently of the two channels of the quadrature detection if the latter is used).
4.3 Programming the DDS device
The communication between the device and the main computer is via an IPC (Inter-Process Communication) chip. The parameters of the device are set by a CPLD (Complex Programmable Logic Device) and then transferred to the DDS board. Due to the minimal configuration of the controller, communications with the main PC are made by packet driver (local area network software that divides data into packets and which routes them to the network). The frequency is fixed before the experiment, whereas the transmitter phase can be varied in the course of the experiment thanks to two inputs coming from the “pulser” (0–90° and 0–180°; see below).
4.4 Acquisition parameters
They are gathered and can be easily modified in a dedicated window (Fig. 11) and are sent to the acquisition computer via Ethernet by the client/server protocol. These parameters include: the DDS frequency, the dwell time (sampling time), the dead time (between the end of pulse, and the start of acquisition), the acquisition phase cycles, the number of data points, the number of scans of each experiment (NS), the number of experiments (NE, when a given experiment is repeated with a list of experimental parameters), the choice between single channel/quadrature modes and the receiver parameters. These data are taken into account by the acquisition unit whenever it receives a trigger signal from the “pulser”; it works thereafter independently of the other parts of the system.
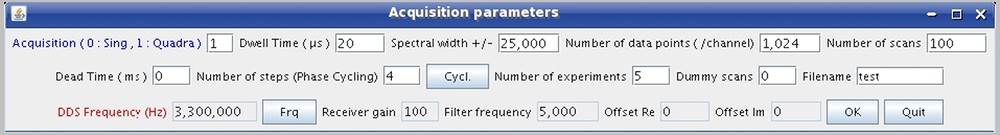
The acquisition window as it appears in the graphical interface of the main PC software.
4.5 Programming the “pulser”
In commercial spectrometers, pulse sequences are written via languages similar to those used in computer programming and this can be difficult for new users. Here, the sequences are generated using a convivial software written in Java; its interface permits to build sequences graphically as a drawing program.
In order to ease the understanding of the sequence and the actions it will produce, its graphical representation is similar to the conventions of the NMR literature (Fig. 12). The user chooses the different events (pulse, delay, acquisition…) in a window and places them into the sequence. After that, he can change the different properties of these events easily by a right click.
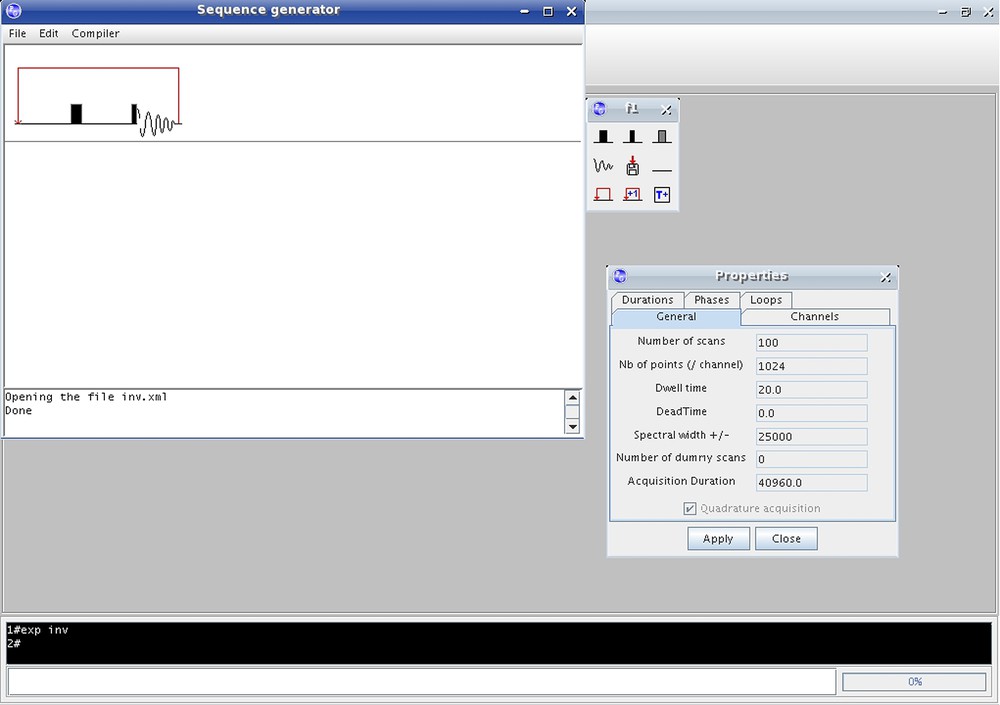
Example of a sequence constructed by the sequence generation software.
The durations are written in symbolic form so one can use mathematical relations between events (for example P2 = P1/2).
After compilation, this software creates two files describing the sequence: one file contains the list of instructions which will be transmitted to the pulser and the other one the corresponding numerical values.
This program can also open previously written sequences in order to modify them.
The only parameters required by the “pulser” are NE (equal to 1 by default) and NS (see above). They are provided to the corresponding PC by packet driver (the code is written in C language). Via a homemade software, this dedicated computer manages files created by the sequence generation software and sends the instructions of the sequence to the pulser board. It delivers signals to the other components (pulse and blanking signals to the radio-frequency unit, phases signals to the DDS, trigger signal to the acquisition unit).
5 Conclusion
The incentive of completely developing its own nitrogen-14 quadrupole resonance instrument was two-fold: (i) no complete NQR spectrometer is commercially available, (ii) there is a necessity to perfectly master the hardware and software in order to devise appropriate QR experiments, even on a routine basis.
The performances of our instrument seem quite appealing. Contrary to others [23], we preferred to have recourse to an analog rather than digital quadrature detection for avoiding any risk of analog-to-digital converter saturation. However, the hardware of our instrument can still be improved by substituting to the two dedicated PC's modern components: (i) a DSP (Digital Signal Processor) in place of the data acquisition board accommodated by a PC, (ii) a dynamic architecture reconfigurable circuit in place of the “pulser” board accommodated by a second PC. These instrumental revisions are under way.
Finally, the versatility and modularity of the spectrometer (hardware and software) open the way to new sequences (possibly involving pulse trains) and to new methods for the detection of nitrogen containing molecules requiring non-Fourier signal processing. Such methods, which are currently under development, imply adaptations that would have been impossible with commercial softwares.