

1 Introduction
In order to modify the interactions between a solid and the surrounding medium, one way consists in grafting polymers at the interface. In turn these interactions depend on the conformations and mobilities of the chains. The interfaces formed by polymers grafted on silica are the continuous objects of considerable interest for both practical and fundamental reasons [1–4]. The configuration and the properties of chain polymer should depend essentially on the polymer surface density [5,6], length (molecular weight), and the nature of the solid surface. Less information is available on short grafted polymeric chains [7,8]. The knowledge of the dynamics of grafted polymer may also provide essential data for the understanding of global surface properties like wetting, adhesion… The study of the molecular dynamics is very important to understand how the motions of polymer chains are affected by different anchoring points on the solid surface. It has appeared that the grafting ratio becomes a very significant parameter in the characterisation of such systems [9,10].
Only few data concerning the chain segment dynamics are available. The dynamics of the macromolecules is a complex process, extended in a large temporal and spatial range, going from the fast motions of the monomeric unit to the slow process of the reorientation of monomer units to each other [1,10–12].
Poly(ethylene oxide) (PEO) is a simple polymer, that can be used as a model system, since all the CH2 are chemically identical (with the exception of the terminal group), and the NMR spectrum of the polymer has one simple line. The solid support is silica (Aerosil) with a high degree of chemical purity [9].
It has already been shown that only the dipolar interaction between the nuclei is the cause of relaxation and that the motion of the monomer units is very anisotropic [9,13]. The strong PEO/silica interactions cause the polymer to adopt a flat configuration by spreading on the solid surface.
NMR is one of the most sensitive methods to investigate the dipolar interaction between the nuclear spins on the polymeric chain, and thus it is an important source of information concerning the polymeric dynamics.
In this work our interest was to observe the modification of the dynamics of the polymeric chain induced by grafting. For this purpose, the 1H NMR spin–lattice and the spin–spin relaxations were observed in a large temperature range, for poly(ethylene oxide) PEO with molecular weight 2000 grafted on silica with different grafting ratios. An important parameter for characterising the dynamics of the polymeric chain is the correlation time of the local segmental motions. This parameter was evaluated from spin–lattice relaxation time versus temperature (T1(T)) data.
2 Experimental
2.1 Materials
The silica is pyrogenic, Aerosil 300 (from Degussa), prepared at high temperature in a flame [9,14]. This material was selected because it has a high degree of chemical purity and it is not porous. It consists of large aggregates formed by small spheres, each sphere being about 7–12 nm in diameter. Its specific surface area, measured by nitrogen adsorption, is of about 300 m2 g−1.
The silica surface is mainly reactive with the surrounding through its silanol groups. The number of silanols on a silica surface is about 5 per square nanometers for a fully dehydrated silica. They are assumed to be rather randomly distributed and therefore it seems a fair approximation to assume that the density of grafting points is constant.
The polymer is poly(ethylene oxide) PEO. The molecular weight and polydispersity was determined by gel permeation chromatography. The length of the chains is always that corresponding to a molecular weight of 2000 with a polydispersity of 1.04.
Grafting reaction: the silica was dried, agglomerated in acetone (RP) and brought to 150 °C in an oven. It was then dispersed in a PEO solution to achieve the desired impregnation ratio. The solvent was evaporated in a rotating evaporator under a pressure of 2 × 10³ Pa. The powder was again dried and degassed in a vacuum of 0.1 Pa and then kept in nitrogen. For the grafting reaction the vessel was maintained in an oil bath at a temperature fixed at ±3 °C. The reaction time was varied for the chosen temperature between 4 h at 113 °C and 1 h 30 min at 234 °C. This last case corresponds to the highest coverage achieved. Once the grafting was performed, the unbounded polymer was removed by a long extraction in a Soxhlet. The grafted silica was first dried in air to remove most of solvent and finally put in a dynamic vacuum of 0.1 Pa for 24 h in an oven kept at 60 °C to avoid the degradation of the polymer. The grafting ratio was evaluated by elemental analysis or by pyrolysis weight loss between 25 and 750 °C under oxygen.
The grafting ratio, τG, is expressed in weight%. It is the weight of polymer irreversibly fixed on 100 g of silica. When using pyrolysis procedure, τG is given by the following relationship:
| (1) |
Three significant grafting ratios for different ranges were studied:
- - low grafting ratio: 5%,
- - medium grafting ratio: 19%,
- - high grafting ratio: 53%.
2.2 NMR technique
Experimental 1H measurements were carried out on a Bruker CXP 300 Fourier transform NMR spectrometer operating at 300 MHz.
Each spectrum was obtained by fast Fourier transforming the averaged free induction decay (FID) occurring after a π/2 radiofrequency pulse. The π/2 pulse width was less than 1.5 μs, which corresponds to a B1 rotating field of more than 40 Gauss. The dead time of the detection was less than 4 μs.
Experimental measurements of T1 (1H) were carried out by using the inversion-recovery pulse sequence (π–τ–π/2).
Experiments were carried out over the temperature range 220–380 K, with the latter being controlled by a variable temperature regulator from Bruker.
This spectrometer was equipped with a “double- bearing” probe head allowing magic angle spinning (at 54°44′) at rates going from 0 to 4.5 kHz. Rotation at room temperature was achieved by an air-driven turbine in which the rotor itself was supported by gas bearing. Experiences at low temperature were achieved by using cold nitrogen gas as propulsor. The experimental spectra were fitted with calculated Lorentzian or Gaussian lines, with the program Linefit from Bruker.
The samples were prepared as follows:
- - relaxation time experiment: the samples were all prepared in Pyrex spheres of 5-mm diameter, which gave greater field homogeneity. Before the experiment the grafted silica was dried by direct pumping.
- - MAS experiment: the powder samples (PEO grafted on silica) were placed in zirconia cylindrical rotors of 5-mm diameter, volume about 0.3 cm3 (about 0.15 g), spinning at the magic angle (54°44′).
3 Result and discussion
3.1 Effect of the dipolar interaction for PEO
For polymer grafted on silica, dipolar interaction between adjacent nuclei is considered to be the only interaction responsible for nuclear relaxation processes. There exist two contributions due to intermonomer unit and intramonomer unit interactions. The interaction can therefore be decomposed into two parts of the Hamiltonian [13,15]:
| (2) |
| (3) |
| (4) |
| (5) |
is a static interaction (i.e. ) giving the residual interaction (nonzero average dipolar spin coupling). This interaction is due to the very slow anisotropic reorientation process of the monomer units relative to one another. This interaction depends on the local density of monomer units. It is not averaged because the motion of the segments relative to each other is strongly hindered. The local motion of segments on the other hand is rapid enough to average the Hamiltonian . The effects of these two terms on the relaxation times T1 and T2 of the spin system are very different. The spin–lattice relaxation time T1 depends only on , whereas the spin–spin relaxation function T2 depends on both and .
3.2 Spin–lattice relaxation time study
The dominant mechanism which governs the spin–lattice relaxation process of the proton of macromolecules is the dipolar interaction between the nuclear spins located within one given chain segment. The expression of the spin–lattice relaxation rate 1/T1 for identical spins is given by the relation [16]:
| (6) |
The observation of the longitudinal magnetisation in a large domain of temperature gives the possibility to evaluate the correlation time τc of the local fluctuations of the chain segments [17]. This evaluation becomes very simple when the minimum of the spin–lattice relaxation time versus temperature T1(T) is observed.
The mathematical expression for τc is derived from a specific model for the chain dynamics. Unfortunately, there is no general theory of NMR relaxation for such complex systems as polymers yet. Different models are used. The BPP model [18], usually used for simple liquids and developed for the interpretation of the experimental data, introduces, for a simple isotropic and random motion of the lattice, a rotational correlation time of the supposedly thermally activated process. The Kramer and Helfand model [19,20] is based on the passage of a particle over a potential energy barrier. Two different stable conformations/structures of the polymeric chain are separated by a potential energy barrier of height Ea. The energy required for conformational transition is provided by thermal activation.
For a quantitative estimation of the correlation time of molecular dynamics, the Kramer and Helfand model is used. The temperature dependence of the correlation time is:
| (7) |
By combining Eqs. (6) and (7), we obtain the temperature dependence of the spin–lattice relaxation rate:
| (8) |
- - the extreme narrowing limit ,
- - the minimum of the spin–lattice relaxation time.
| (9) |
Concerning the second situation, the minimum of the spin–lattice relaxation time implies the condition: . From Eq. (8), by derivation, we can obtain the simplest relation corresponding to the minimum of the spin–lattice time:
| (10) |
If we substitute Eq. (8) into Eq. (6), we can obtain a direct relation between the minimum value of the relaxation time T1min and the parameter K:
| (11) |
We measured the spin–lattice relaxation time for the polymer grafted on silica at different grafting ratios in the temperature range 220–380 K; this domain includes the temperature corresponding to the minimum of the relaxation time (Fig. 1). The values of T1min and corresponding temperature are listed in Table 1.
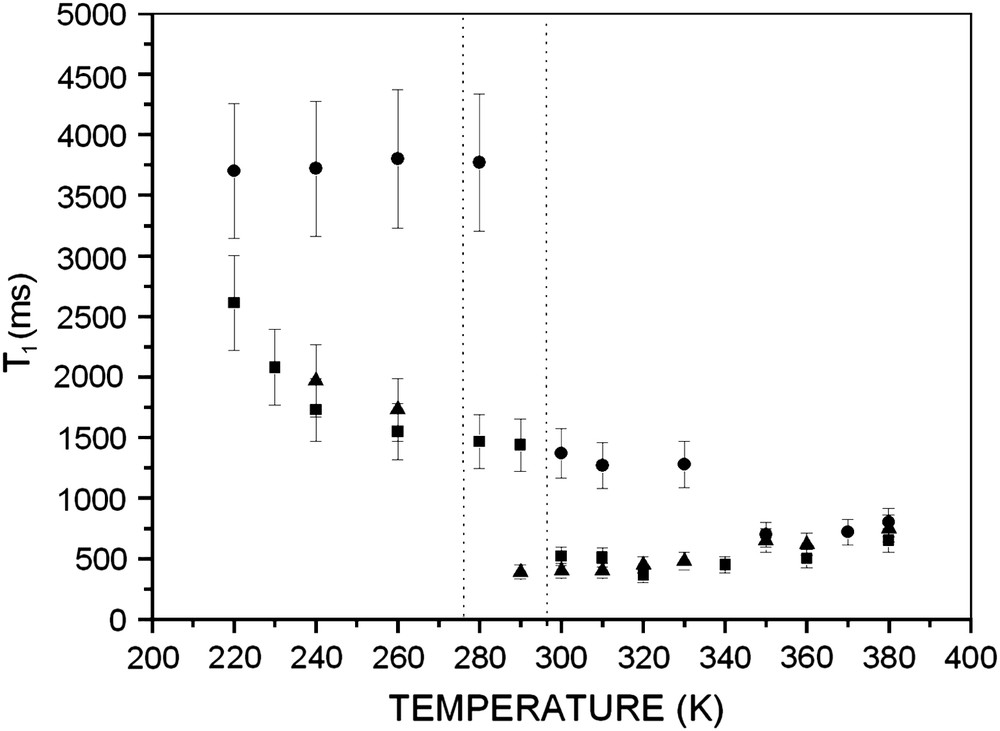
Temperature dependence of the spin–lattice relaxation time T1 for PEO 2000 grafted on silica with molecular weight 2000 for different grafting ratios: (●) 5%, (■) 19%, (▴) 53%. Data obtained from 1H NMR spectroscopy (300 MHz) (without sample rotation).
Values of parameters for PEO grafted on silica with molecular weight 2000 at different grafting ratios
| T1 min (s) | T(T1 min) (K) | 10−3/T1 min | K (s−2) | Ea (kJ/mol) | B (s) | |
| 5% | 0.7 | 350 | 2.85 | 0.27 × 10⁹ | 5.9 | 9.9 × 10⁻¹⁰ |
| 19% | 0.36 | 320 | 3.12 | 0.55 × 10⁹ | 9.56 | 1.4 × 10⁻¹⁰ |
| 53% | 0.4 | 310 | 3.22 | 0.45 × 10⁹ | 8.65 | 1.9 × 10⁻¹⁰ |
From the minimum of the relaxation time we calculated the values of parameter K for all grafting ratios with Eq. (11). These values are also listed in Table 1.
It was already demonstrated by measurements of relaxation times [9] that there exists a transition situated between 270 and 290 K. The transition is not a vitreous transition of poly(ethylene oxide) because the latter (for free PEO macromolecules) is situated at 210 K. It is of a dynamic nature, and corresponds to a modification of the motion of the monomer units, which is influenced by the grafting ratio. This transition is observed for all grafting ratios. It is more important when the grafting ratio is low.
For each grafting ratio we calculated the activation energy Ea from the Arrhenius plot of the experimental data in this temperature range (Fig. 2).
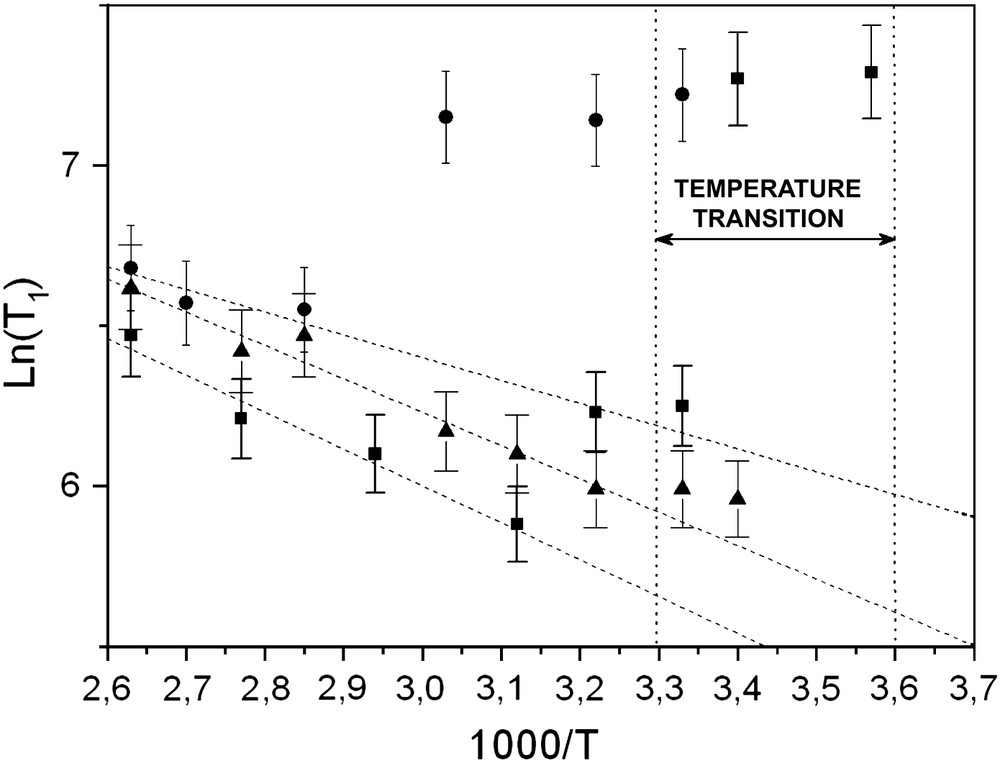
1H NMR. Arrhenius plot of the experimental T1(T) data for PEO 2000 grafted on silica with molecular weight 2000 at different grafting ratios: (●) 5%, (■) 19%, (▴) 53%.
The values of parameters K and Ea were introduced in Eq. (8). We fitted the experimental results T1(T) to this equation in order to obtain the parameter B. We retained the value of B that corresponds to the relatively best fit.
To a first approximation we do not obtain a good fit for all samples (Fig. 3). In fact, we obtain an agreement for the temperatures located after the zone of transition. We were interested in the high temperatures, i.e. after the zone of transition. Let us note that for the low grafting ratio, the results are in disagreement.

1H NMR. The fit plot of the experimental 1/T1(T) data using Eq. (3) for PEO 2000 grafted on silica with molecular weight 2000 at different grafting ratios: (●) 5%, (■) 19%, (▴) 53%.
The simplest dynamic model is very well suited to a system with great mobility. In the domain of high temperature, above the transition temperature range, the dynamic of the polymeric segment is high and this model can be applied with good results. We calculated the parameter Ea in this temperature domain, and used this value to fit the experimental data T1(T) in the entire temperature domain.
At low temperature, in particular in the vicinity of the transition temperature range, the dynamics of the polymeric chain is very much reduced compared with the dynamics at high temperature. In this situation, it is possible that the simple model of the potential energy barrier could not explain the behaviour of the polymeric segment. For this reason, some deviations of the fit from the experimental data may be observed. However, this model can be used for preliminary investigation of the local dynamics.
Using the parameters Ea and B obtained in this way, we generated the correlation time at any temperature after the transition temperature range using Eq. (2) as shown in Fig. 4. These values of τc were calculated.
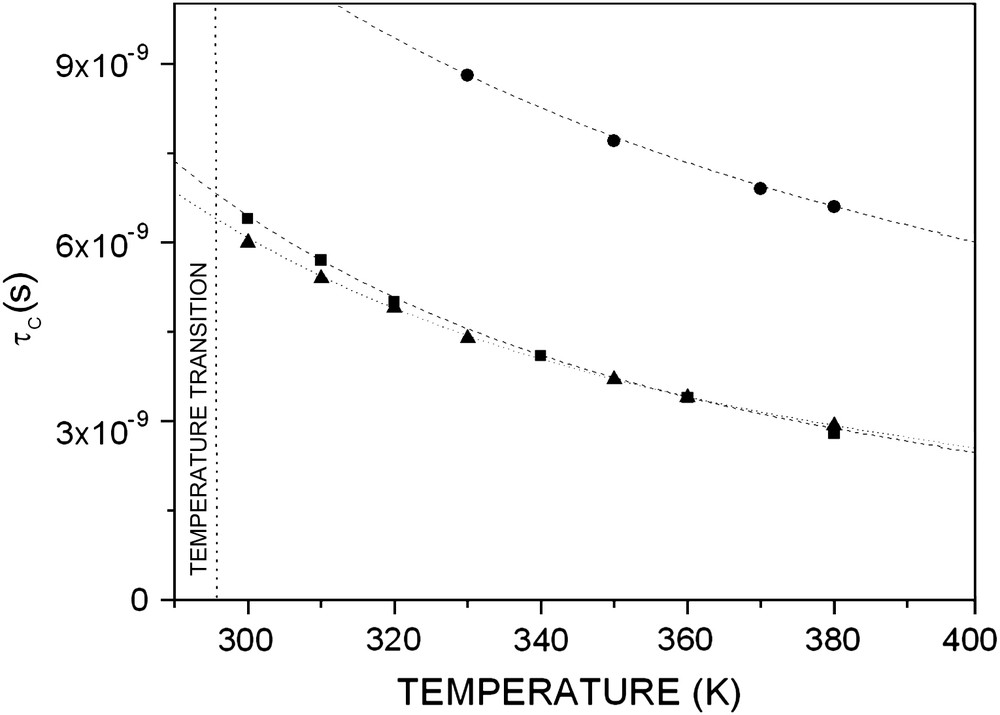
1H NMR. The values of τc generated with Eq. (2) for PEO 2000 grafted on silica with molecular weight 2000 at different grafting ratios: (●) 5%, (■) 19%, (▴) 53%.
3.3 Rotation effect and limit linewidth study
The magic-angle spinning technique was used to study the dynamics of the polymeric chain and to determine two correlation times (τsl and τfa) for each grafting ratio. In fact, we assume that the fluctuation of local dipolar field arises from two contributions [21,22]:
- - the reorientation motion of monomer units relative to each other described by the Hamiltonian and characterised by the relatively longer correlation time τsl;
- - the local motion of monomer units, relatively fast, and described by the Hamiltonian and characterised by the short correlation time τfa.
We are interested essentially in the last correlation time, which corresponds to the local segmental motion. It can be evaluated from the analysis of the experimental results and can be compared to the correlation time determined by T1.
Some experiments have been performed on PEO grafted on silica at room temperature at different grafting ratios [23]. In Fig. 5, experimental 1H NMR spectra showing the effect of sample rotation on the narrowing of the central line is presented. Fig. 6 shows the evolution of the linewidth versus the rate of rotation. The NMR line narrowing effect by high speed rotation is observed in the same samples with different grafting ratios. As previously, the same evolution is observed in our experiences. In fact, when the rotation frequency increases, one observes a line narrowing for ωr ≈ 1/τsl. After this transition, the linewidth will be limited to (δω)li independently of the rotation rate, because of the very large value of 1/τfa. This behaviour is characteristic of the coexistence of two fast and slow motions, described, respectively, by and , characterised by the respective correlation times τfa and τsl. The resulting spectral density is illustrated in Fig. 6 (inset). The study of the NMR linewidth as a function of ωr is therefore interesting for evaluating the correlation time τfa in PEO/silica systems. The linewidth, when the sample rotates at ωr, can be written as [22,23]:
| (12) |
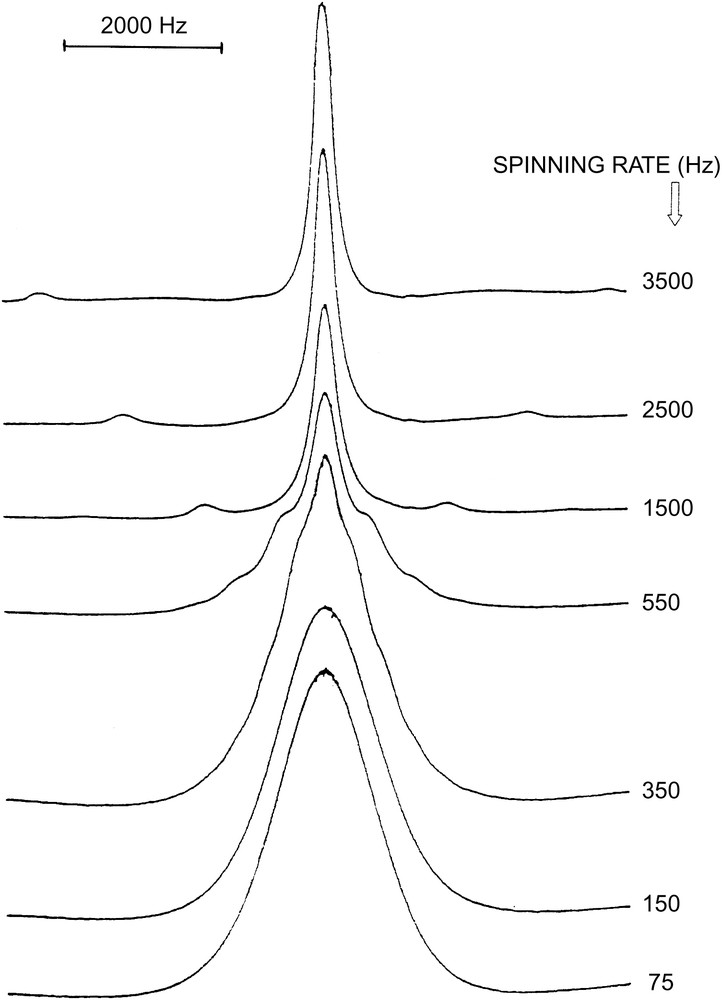
1H NMR. Spectra recorded during sample rotation. Spectra correspond to an increasing spinning rate (from 0 to 3500 Hz); PEO 2000 grafted on silica (grafting ratio 53%); room temperature.
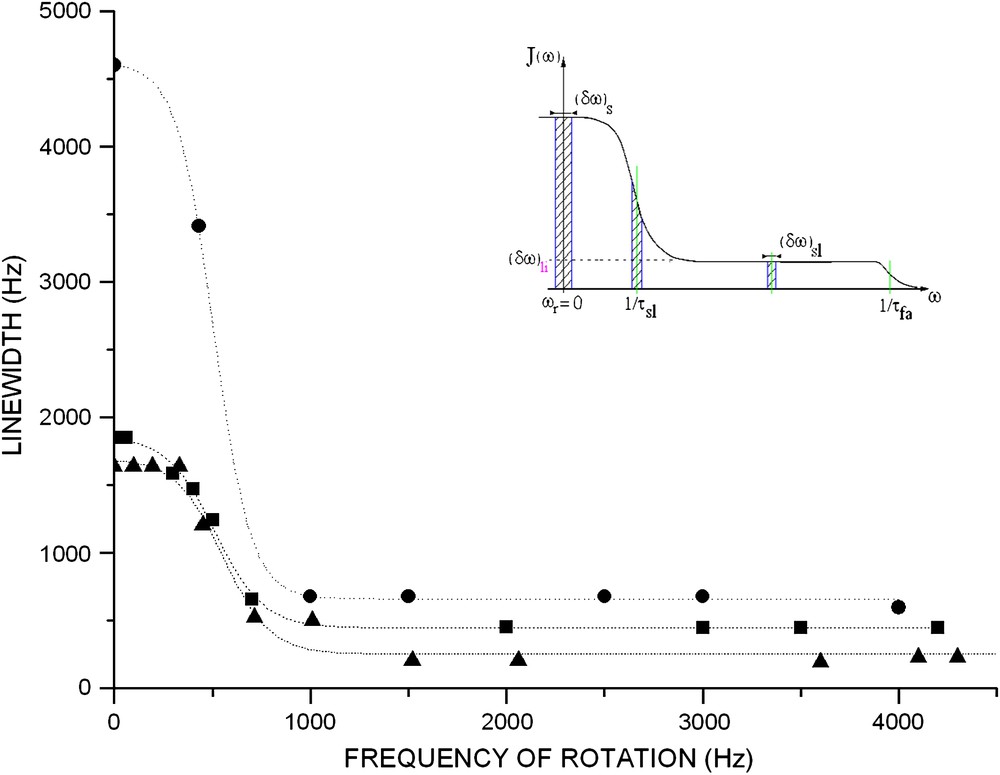
Evolution of linewidth versus rotation frequency of sample. Different grafting ratios at room temperature for grafted poly(ethylene oxide). (●) 5%, (■) 19%, (▴) 53%. Data obtained from 1H NMR spectroscopy (300 MHz). Inset: effects of sample rotation on linewidth when two molecular motions τfa and τsl are present in a sample.
Particularly, when ωr > 1/τsl, the linewidth reaches a limiting value:
| (13) |
Correlation times for PEO grafted on silica with molecular weight 2000 at different grafting ratios obtained at 300 K by MAS technique and T1 measurements
| Correlation time τc (s) (by spin–lattice relaxation time T1) | τc (s) (by MAS technique) | |
| 5% | 1.7 × 10⁻⁶ | |
| 19% | 6.4 × 10⁻⁹ | 1 × 10⁻⁶ |
| 53% | 6 × 10⁻⁹ | 0.9 × 10⁻⁶ |
We obtained two correlation times characteristic of the fast segmental motion by two different techniques. The comparison of the values obtained at 300 K shows a great difference. We observe a ratio of approximately 100. This variation can be explained as follows.
The spin–lattice relaxation which limits the life time of spin in a given state can lead to a linewidth of about 1/T1. In the polymer grafted system, the local motion of the monomer units, which is relatively fast, represents a significant mechanism of relaxation. According to the BPP [18] model, the components of the order of the Larmor frequency ω0 (and 2ω0) of the local motion could produce transitions between the states of nuclear spins and thus to support the transfer of energy between the spins and the lattice.
The macroscopic rotation of the sample does not have a significant effect on this type of mechanism of relaxation. In fact, the macroscopic frequency of the rotation reached is much weaker than ω0. The spin–lattice relaxation time T1 and the linewidth which results from it are not modified by the rotation of the sample. Thus, we can notice that the linewidth generated by the spin–lattice relaxation mechanism is generally negligible when compared to the limiting linewidth.
4 Conclusion
The local mobility of the polymeric chain can be investigated by analyzing the temperature dependence of the NMR spin–lattice relaxation time and magic-angle spinning. An important parameter used to characterise this process is the correlation time of the local dynamics of the polymeric segments. This parameter can be evaluated, in a first approximation, using the dynamic model of the passage of a particle over a potential barrier. The mathematical relation used for this evaluation requires an analysis of the T1(T) data for a wide range of temperatures, including the extreme narrowing and the minimum of the T1(T). The correlation time is dependent on the temperature. For a given grafting ratio, the correlation time decreases with increasing the temperature, which indicates an increase of the polymer mobility.
The correlation time of the local dynamics determined by the MAS technique lies in the range of 10−6–10−7, but it is greater than the correlation time obtained by the spin–lattice relaxation method (about 10−9–10−8). The comparison of the values obtained by the two techniques shows a great difference. A ratio of one hundred is obtained. Indeed, the macroscopic rotation does not have an effect on the mechanism of relieving of T1. It is necessary to reach the frequency of rotation close to the frequency of Larmor, which is impossible.