

1 Introduction
The “Ouzo effect” was coined by Vitale and Katz [1] to describe the spontaneous emulsification accompanying the preparation of the Greek beverage Ouzo, because Ouzo is more drunk than Pastis in the United States due to the presence of an important Greek community. Nevertheless, French Pastis lovers are familiar with this process, and revel in it when they prepare their favourite aperitif. This “Ouzo effect” is the result of a spontaneous emulsification between two immiscible components, thanks to a third component in which both components are soluble. This phenomenon arouses intermittent interest in the scientific community, principally due to a number of potential applications [2]. Thus, mixing an ethanolic solution of the essential oil trans-anethole (t-A) in water instantaneously gives a metastable solution of cloudy aspect. Despite its noticeable visual stability over several few hours, continuous molecular reorganizations occur than can be probed by using NMR.
In a previous paper, we reported the mechanism of the aggregation process that occurs at the early beginning of t-A emulsification [3] and the effect of aggregation processes on its photochemical behaviour [4]. Herein, a more detailed analysis of each state of t-A emulsification is described, showing that before reaching a molecular metastable state, t-A molecules initially reorganize into small aggregates of angstrom-size, thus visible by using standard liquid NMR experiments. Simultaneously, these small aggregates coalesce inbetween them to form small micrometer-size droplets.
2 Materials and methods
2.1 Sample preparation
Microemulsions were freshly prepared using a set procedure to ensure reproducibility: an amount of trans-Anethole (t-A, Aldrich, >99% pure) was dissolved in ethanol D6 (Euriso-Top) in order to obtain a homogeneous single-phase solution. Subsequently, deuterium oxide (Euriso-Top) was added to the alcoholic solution to reach a concentration of 5 mM in t-A and a solvent composition of 5% C2D5OD/D2O. A 0.5-mL aliquot was used for the NMR experiments.
2.2 NMR experiments
NMR experiments were performed at 298 K on a Bruker DPX 400 equipped with a 5-mm gradient inverse broad band probe. All proton chemical shifts are given with respect to TMS as an external reference. Three types of experiments were recorded.
2.2.1 Kinetics
A sample containing 5 mM of trans-anethole in a solvent mixture containing 5% C2D5OD/D2O was prepared as previously described. An external capillary containing 5 mM of methanol was added in the NMR tube and was used as an external quantitative. Then, proton spectra were recorded every 10 min immediately after the sample preparation, and the ratio of aggregated form/free form was estimated with respect to the total amount of trans-anethole present in the sample.
2.2.2 Exchange rate measurements
The 2D 1H EXSY NMR spectra were recorded using the pulse sequence of Jeener et al. [5] in the phase-sensitive mode with time-proportional phase incrementation [6]. Twenty-four experiments were recorded at two successive mixing times (60 and 0 ms) every 15 min during the first hour and then every 30 min during the 10 following hours. The auto and cross-peak volumes were determined after phase and baseline correction of the two dimensions using the Bruker UXNMR software. Rate exchanges were obtained from these experiments by using the method of Perrin, Gipe and Dwyer [7,8] that allows extraction of rates from a single experiment recorded at one mixing time by resolving the kinetic matrix L:
2.2.3 Diffusion measurements
Diffusion measurements were performed using a 2D 1H NMR pulsed-gradient experiment: the stimulated spin-echo sequence [10] which leads to a 2D spectrum in which the second dimension is obtained after a Fourier Transformation and gives the 1H NMR spectrum, and the first dimension is obtained after a Laplace Transformation using the Bruker software and gives the translational Diffusion Coefficients' dimension. The 2D DOSY spectrum was recorded using the following parameter: intergradient delay Δ, 150 ms; gradient pulse duration δ, 1,3 ms and 16 different gradient values varying linearly from 0.01 to 0.4 G/m).
3 Results
3.1 Behaviour of trans-anethole in water
Fig. 1 shows a proton spectrum of t-A obtained approximately 10 min after emulsification. According to the expected pattern for the proton spectrum, two distinct sets of readily assigned resonances can be distinguished, suggesting that t-A can exist in at least two forms. Three types of NMR experiments confirm that these two forms correspond to free and aggregated t-A. First, EXSY experiments acquired on the mixture clearly demonstrate a slow exchange between the two species (Fig. 2), confirming that the same compound is undergoing exchange between two states. Second, DOSY experiments performed on the mixture shows that the two species have very different diffusion coefficient values: about 6 × 10⁻¹⁰ and 1 × 10⁻¹⁰ m2 s−1, allowing the unambiguous assignment of the free and the aggregated forms, respectively, as shown in the DOSY spectrum displayed in Fig. 3. Since we are in the slow exchange limit (Δ/τ between 0.075 and 0.18 for the aggregated specie, and close to 0.11 for the free form) [11], we can consider that the two diffusion coefficients measured are representatives of those belonging to the individual species. Third, proton spectra recorded at different ethanol concentrations (up to 60% ethanol) show that only the free form of t-A is present above 40% of ethanol [12]. However, the most interesting feature of these experiments is the systematic deshielding effect of ca. 0.6 ppm for the overall 1H resonances of the free form as compared to the aggregated form. This phenomenon can be easily explained by the hydrophilic/hydrophobic environment felt by t-A in the free and aggregated forms.
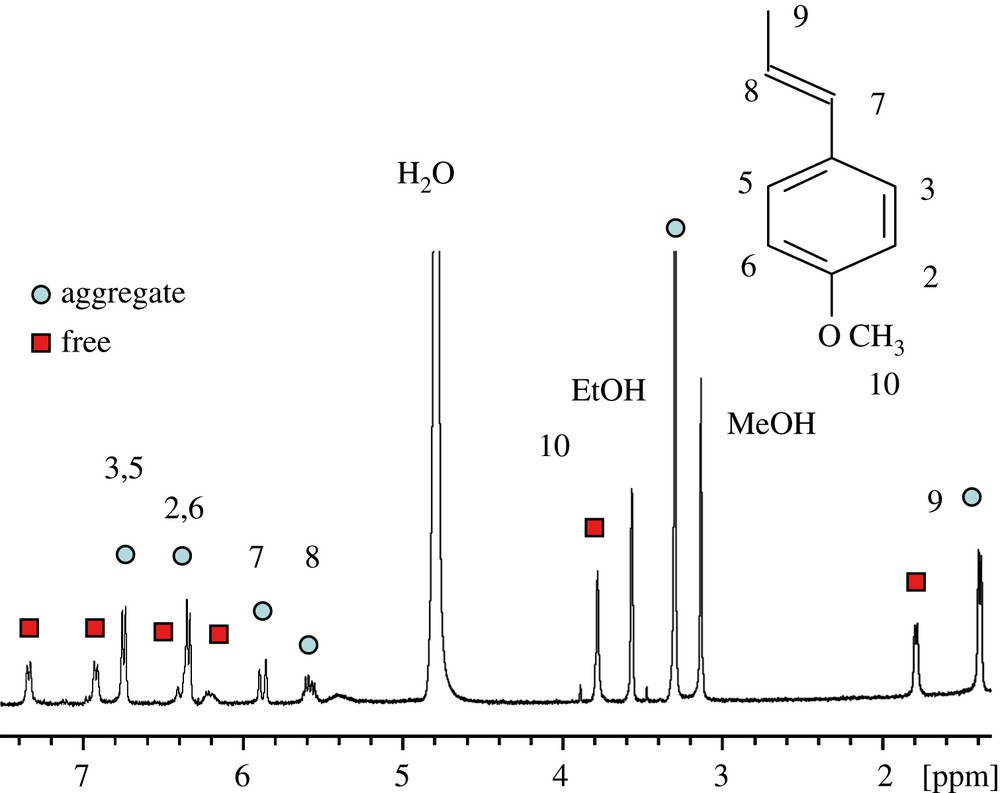
Proton spectrum of t-A (400.13 MHz), 10 min after the mixture preparation.
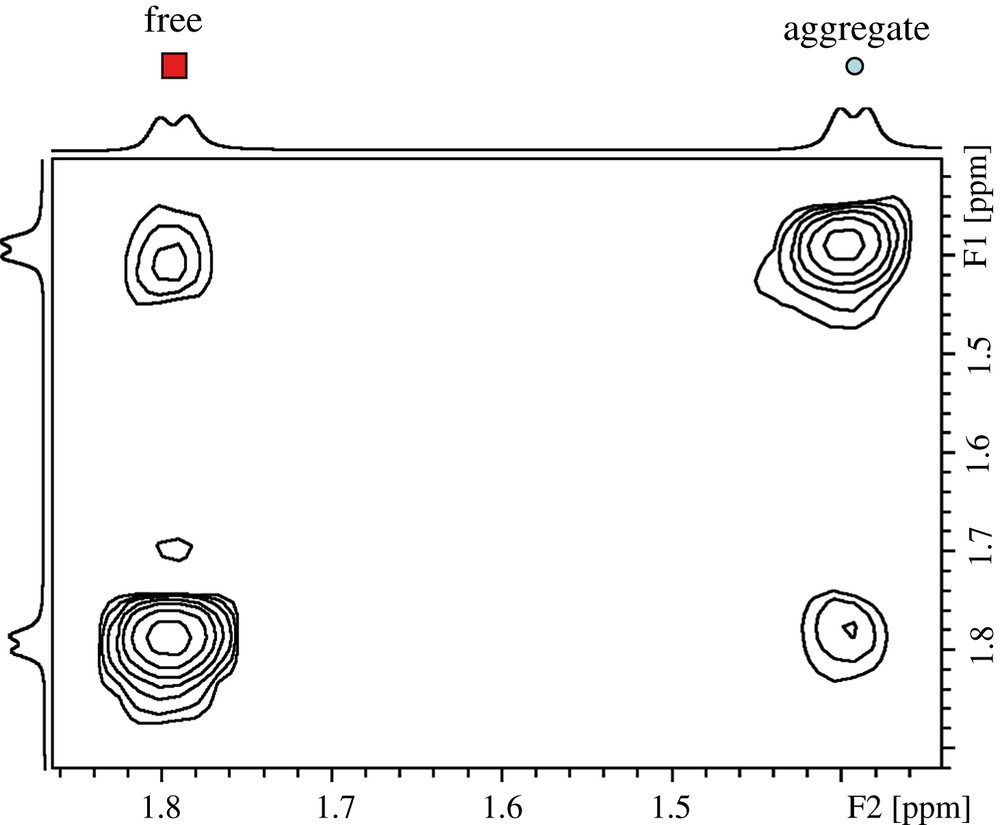
EXSY spectrum recorded with a 60 ms mixing time showing the interconversion between the two forms of t-A.
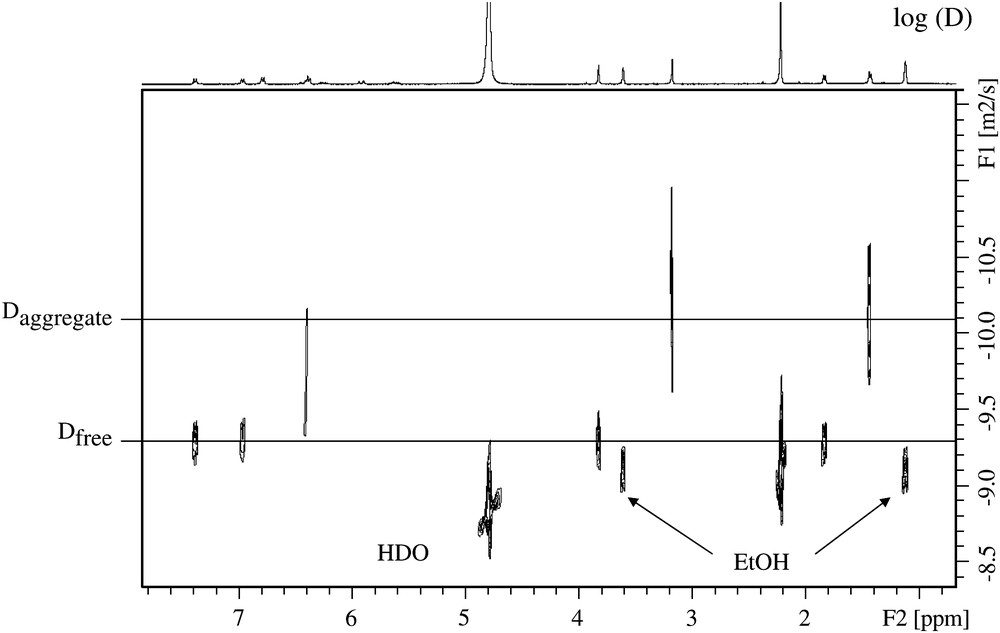
DOSY 2D spectrum of a hydroalcoholic solution of t-A 5 mM, showing two distinct diffusion coefficient values allowing the assignment of the free and aggregated forms.
3.2 Aggregation process
When water is added to an alcoholic solution of t-A, the mixture instantaneously takes a cloudy aspect that appears visually stable for at least 6–8 h, after which a two-phase solution can be observed [13]. But this stable appearance is only visual: as an example, Fig. 4A displays the methyl 9 part of the proton spectra acquired in the course of time. It shows that if the intensity of the free form (1.78 ppm) remains constant along at least 70 min, a decrease of the signal assigned to the aggregated form (1.39 ppm) is observed over the same period. This decrease has been followed and quantified with respect to the intensity of the methyl signal of methanol added to the mixture as an internal standard (5 mM, final concentration). From these results, it is possible to understand that anethole exists in three distinct forms, of which only two are observable in the NMR 1H spectra. It is thus possible to follow, all along the duration of the experiment, the proportion of t-A observed in two forms (small aggregates or free) and to deduct the proportion of t-A that is invisible by NMR (Fig. 4B). After 40 min, the latter reaches a plateau value close to 3.5 mM, which represents up to 70% of the total t-A; at the same time, the proportion of small aggregates decreases to a concentration close to 0.7 mM, whereas the proportion of free t-A remains constant (0.8 mM). It is only after ca 40 min that a metastable state is reached, which remains stable for several hours, as shown by liquid NMR observations.
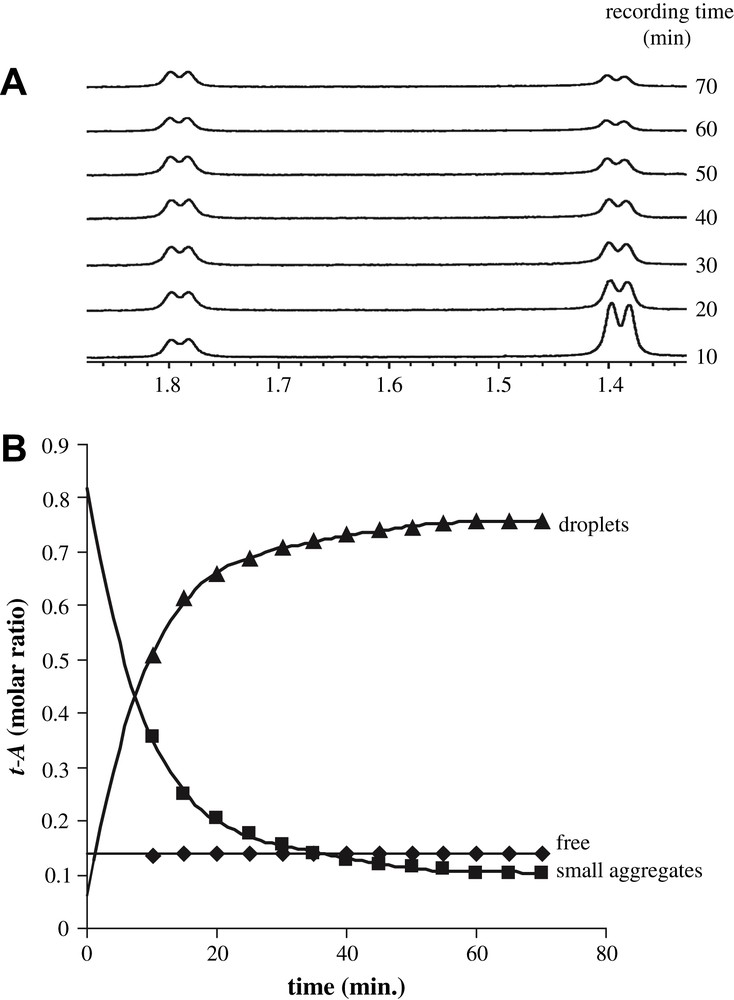
Evolution of the different forms of t-A along the time. (A) Part of proton spectra showing the doublet representative of each form of methyl 9. (B) Evolution of trans-anethole molar fraction against time under its free (diamond), aggregated (square) and NMR invisible (triangle) forms. The solid lines are the best-fit using a monoexponential function for the aggregates (y = Ae−kt, k = 11.5 min−1).
The fraction of t-A not visible in the NMR proton spectrum recorded using classical liquid techniques is assigned to t-A present as small droplets that are several micrometers in size and that are responsible for the cloudy aspect of the solution. Two observations support this hypothesis: first, the proportion of t-A, which is being indirectly followed through the disappearance of t-A in the NMR spectra (Fig. 4B, droplets) can be fitted to a monoexponential function consistent with an Ostwald ripening process. This behaviour is in agreement with previous investigations of t-A droplet growth by Grillo et al. using Small-Angle Neutron Scattering [13]. Second, the part of t-A that escapes detection does so either due to differences in magnetic susceptibility of anethole in different environments or due to the predominance of interactions specific to emulsions such as a decrease in T2, chemical shift anisotropy or/and dipolar coupling. Concerning this last point, it is noteworthy that HR-MAS spectra recorded at different rotation speeds up to 10 kHz (Fig. 5) show that only a very small part of the signal is recovered, suggesting that the disappearance of a large part of the anethol is due to residual dipolar couplings/anisotropy, since the effect of magnetic susceptibility, which does not exceed 10–100 Hz in a solution, should be averaged at a speed of 10 kHz [14].
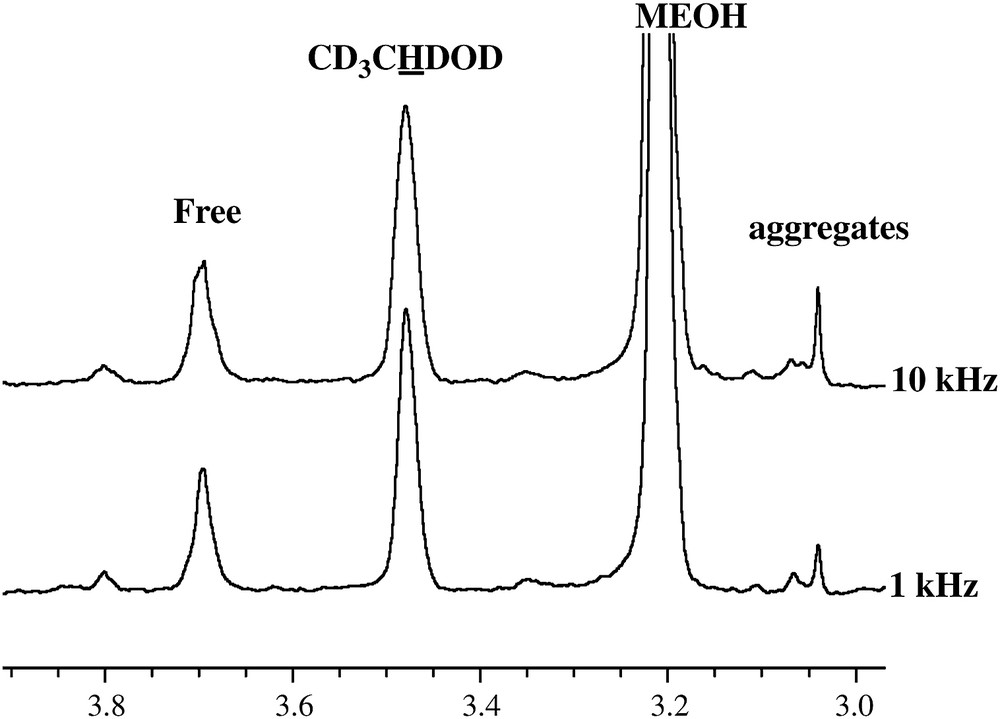
HR-MAS spectra recorded at 1 and 10 kHz of an hydroalcoholic t-A (4 mM) solution mixture: expansion showing the Me 10 region.
3.3 Kinetics
EXSY experiments were recorded over the course of time using a constant mixing time value of 60 ms. EXSY experiments with a zero mixing time were intercalated inbetween each experiment in order to have a reference area matrix for each measurement. The system was considered to undergo only small variations during the time required to acquire the NMR data. Therefore, EXSY NMR experiments allow one to observe the exchange of magnetization between the free and the aggregated forms: such an exchange is adequately described by the bimolecular process illustrated in Scheme 1. Thus, the rate constant values ka and k−a, extracted from the area matrices as previously described [9], are, in fact pseudo-order-one rate constants intrinsically expressed in Hz or s−1, and are concentration-dependent (ka depends on [t-A]aggregate] and k−a on [t-A]free as explained in Scheme 1).
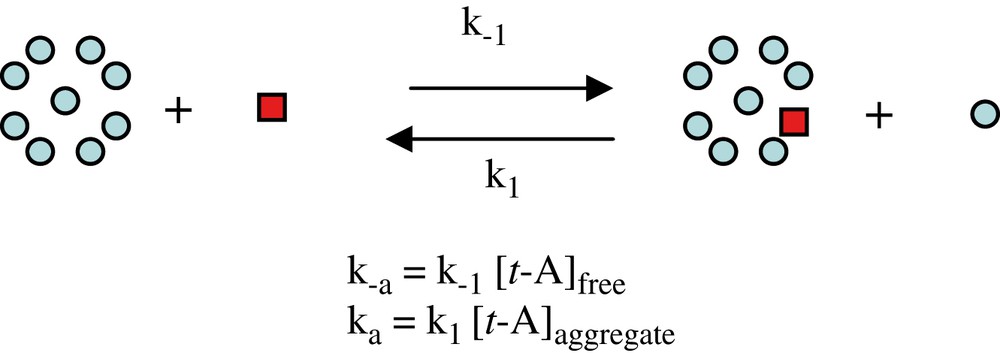
Study of exchange of magnetization in a bimolecular process by EXSY NMR experiment.
Pseudo-order-one rate constant values ka and k−a evolved till 4 h (Fig. 6). The pseudo-order-one rate constant k−a, that reflects the change from the aggregated form to the free form, as shown in the inset of Fig. 6, increases from 0.8 to 2 s−1. Since [t-A]free remains constant, the evolution of k−a reflects the evolution of k−a. During this time, the pseudo-order-one rate constant ka that reflects the inverse exchange from the free form to the aggregated state remains stable at 1.3 s−1. Since [t-A]aggregate decreases all along the time, it suggests that, as expected, k1 increases as k−1 until a metastable equilibrium is reached, in which the three forms of t-A coexist.
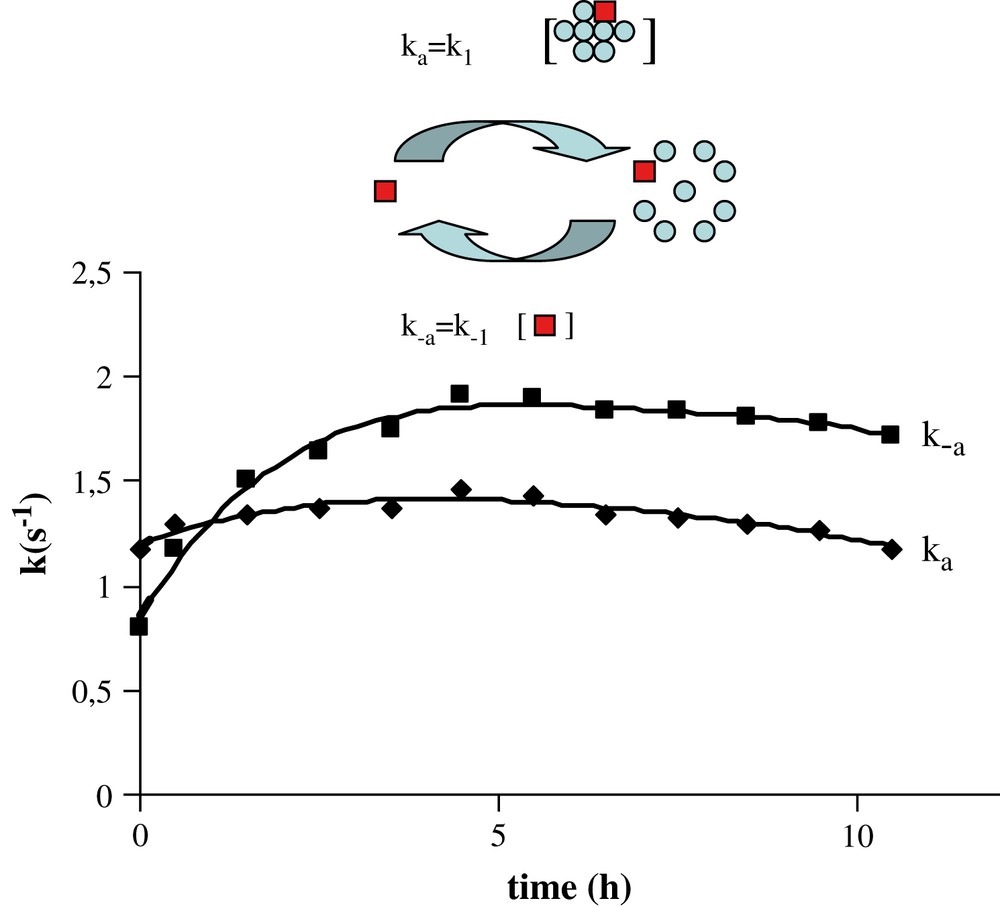
ka and k−a evolution over the time course measured from EXSY experiments.
4 Conclusion
The results we reported herein clearly demonstrate that the spontaneous emulsification of t-A in water proceeds via a molecular maturation process that can be probed using NMR spectroscopy (Scheme 2): t-A molecules are able to give small aggregates of around 2- nm diameter in which all t-A molecules are sufficiently mobile to be observed by classical liquid NMR experiments. An exchange is still occurring all along the time course between both free and aggregated form. Simultaneously, a coalescence process of the small aggregates is taking place to give micrometer-size droplets; t-A embedded into these droplets are not visible using liquid NMR techniques, but its behaviour can be indirectly followed and evolved with respect to an Ostwald ripening process.
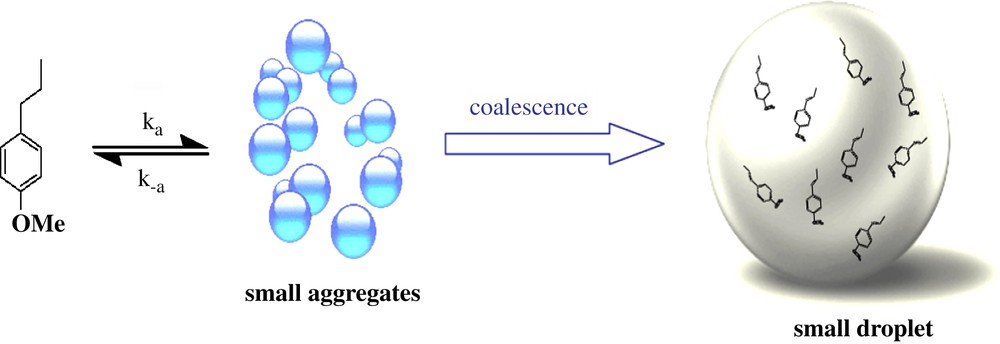
Proposed mechanism of t-A aggregation process.
Acknowledgment
Financial support from the Région Aquitaine, ANRT and the CNRS are gratefully acknowledged.