

1 Introduction
X-ray absorption spectroscopy, XAS, is now a well-established structural technique. The basic principles have been covered in several books [1–3] and there have been reviews covering specific applications such as biology [4,5], catalysis [6,7], coordination chemistry [8,9] and environmental applications [10]. The main objective of this contribution is to demonstrate the unique information that the technique can provide in two areas of material chemistry, namely nanocrystalline compounds and battery materials. In order to attain this objective we will use as case studies recent XAS experiments that we have performed from a number of research programmes, particularly from the EU ALISTORE Network of Excellence focused on solid-state lithium batteries.1 An additional objective is to give some insight into technique developments that can be expected in the next few years.
Only a brief review of XAS experiments and principles will be given here and the reader is directed to the specialised books and articles for more details [1–10]. The experiment involves measuring the absorption coefficient of a sample for X-rays as the incident energy of the X-rays is scanned across the range corresponding to that required for the photoemission of a core electron (K or L shell) from an atom in the sample. The need for a tunable, high intensity X-ray beam means that the vast majority of XAS experiments are performed at synchrotron sources. As the X-ray energy moves from low to high across the photoemission energy of the atom (usually termed the absorption edge) there is a sharp jump in the absorption coefficient followed by a series of oscillations. This is illustrated in Fig. 1, which shows the Ti K-edge XAS spectrum for a titanium containing oxide. The oscillations diminish with increasing photon energy and are typically about one-tenth of the magnitude of the step at the edge. As shown in Fig. 1 the spectrum is divided into two regions: the X-ray absorption near-edge region (XANES) or near-edge X-ray absorption fine structure (NEXAFS) extending some 50 eV beyond the edge and the extended X-ray absorption fine structure (EXAFS) at higher photon energies. The origin of the oscillations in the EXAFS region is the effect of the interference between the fast moving outgoing photoelectron wave and that part of itself which is backscattered from neighbouring atoms. As the photon energy increases the velocity, and hence the wavelength of the photoelectron decreases, however, the distance from the target atom to the neighbours is fixed. When the waves are in-phase there is a constructive interference, the final state energy is low and there is a higher probability for absorption of the incident photon. Conversely, when waves are out-of-phase there is destructive interference, the final state energy is higher and there is a lower probability of absorption. In the XANES region the photoelectron is moving slowly, interacting with the near neighbour atoms and undergoing multiple scattering events.
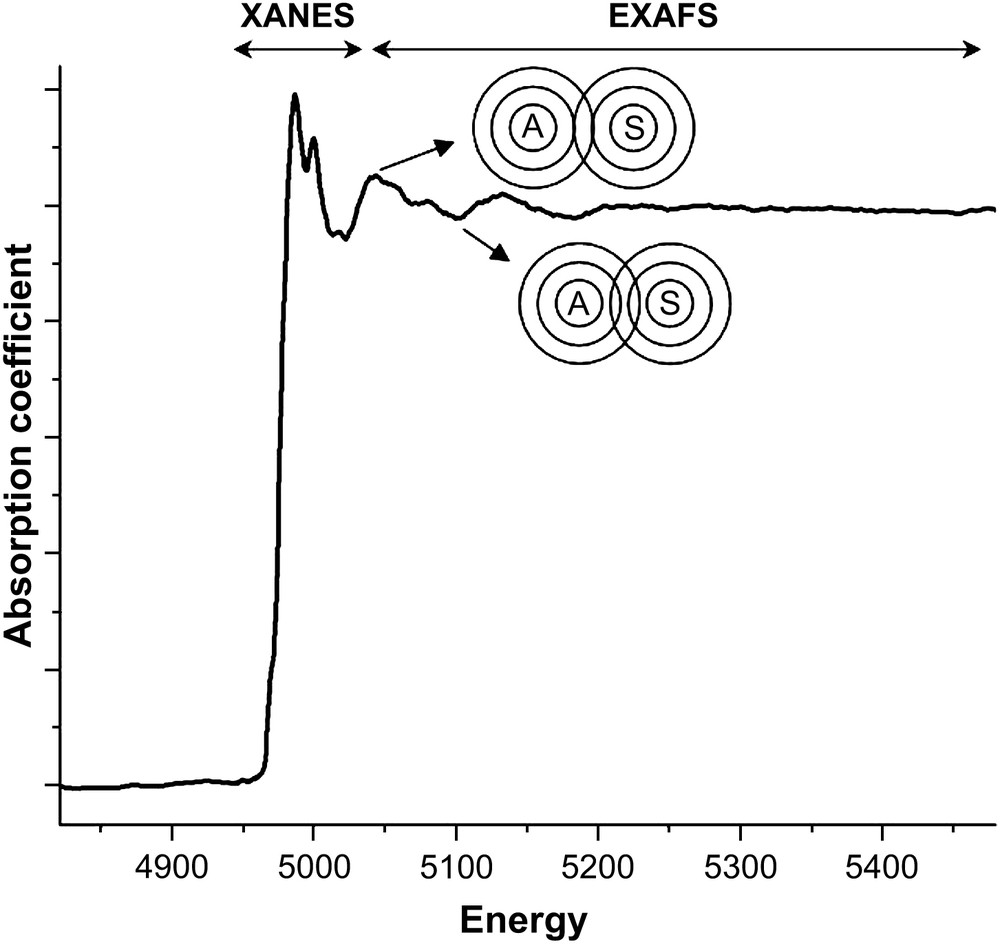
The raw Ti K-edge XAS spectrum of Ti2O3. The division of the spectrum into XANES and EXAFS regions is indicated. The figure also schematically shows the effect of the interference of the outgoing photoelectron wave from the target atom (A) and the backscattered wave from a neighbouring atom (S).
From the qualitative explanation in the preceding paragraph it should be clear that the frequency of the EXAFS oscillations contains information on the distance from the target atom to its neighbours. The oscillations can be considered as a sum of sine waves, each sine wave arising from a shell of neighbours of a particular type of atom at a certain radial distance from the target atom. The intensity of the oscillations will depend on the type of atom which is acting as the backscatterer, i.e. the higher the atomic weight the more intense the oscillations and the number of backscattering atoms. To be more precise, after subtraction of the background absorption, the normalised absorption coefficient, χ(k), as a function of the photoelectron momentum, k, can be written in an equation of the form [2,11]:
| (1) |
XAS data analysis is performed with interactive computer programs, such as the EXCALIB, EXBACK and EXCURVE codes developed at the Daresbury SRS [12], the WinXAS [13] or IFEFFIT [14] codes. The work in this article was analysed with the Daresbury suite of programs. EXCALIB allows for correction of the monitors for background counts and converts monochromator angle to X-ray energy. EXBACK removes background X-ray absorption of the atom to produce the normalised absorption, χ(k). EXCURVE, the final step in the procedure is least-squares fitting the data to a model of the local structure with parameters such as Nj, Rj and Aj [=2σj2] as variables. The programs use theoretical calculations to evaluate the phase shifts and allow for multiple scattering pathways.
The EXAFS region in general is insensitive to the geometry of the target atom site, which is usually probed by consideration of the XANES region. An example of XANES spectra is shown in Fig. 2, data for various titanium oxides [15]. For comparison the spectra have been normalised to a step at the edge of unity. The first point to note is that the edge position is sensitive to the oxidation state of the target atom; the edge moves to higher energies in going from Ti0 to Ti3+ to Ti4+ due to the increasing charge on the target atom. Thus the XANES edge shift can be used to determine the oxidation state of the target atom provided that good reference systems are available for calibration, which in the case of transition metals is not a problem. The second point is the ‘richness’ of the detail of the XANES region. Firstly there are small peaks occurring prior to the edge. These are common in transition metals and are due to the excitation of core electrons to higher atomic orbitals without photoemission. The peaks are therefore also indicators of the oxidation state of the target atom. Beyond the edge the XANES is complex as the photoelectron is moving slowly and interacting with the electrons of the neighbouring atoms. Progress is being made in quantitatively fitting this region by using DFT calculations to evaluate the electronic density states of the system and predicting the transitions available to the photoelectron [16,17]. However, the most common approach is to subject the XANES to a qualitative analysis. The shape of the XANES is used as a ‘fingerprint’ of the local geometry (i.e. square planar, tetrahedral, octahedral, etc.) and the spectrum of the unknown is compared with standards of known local geometry.
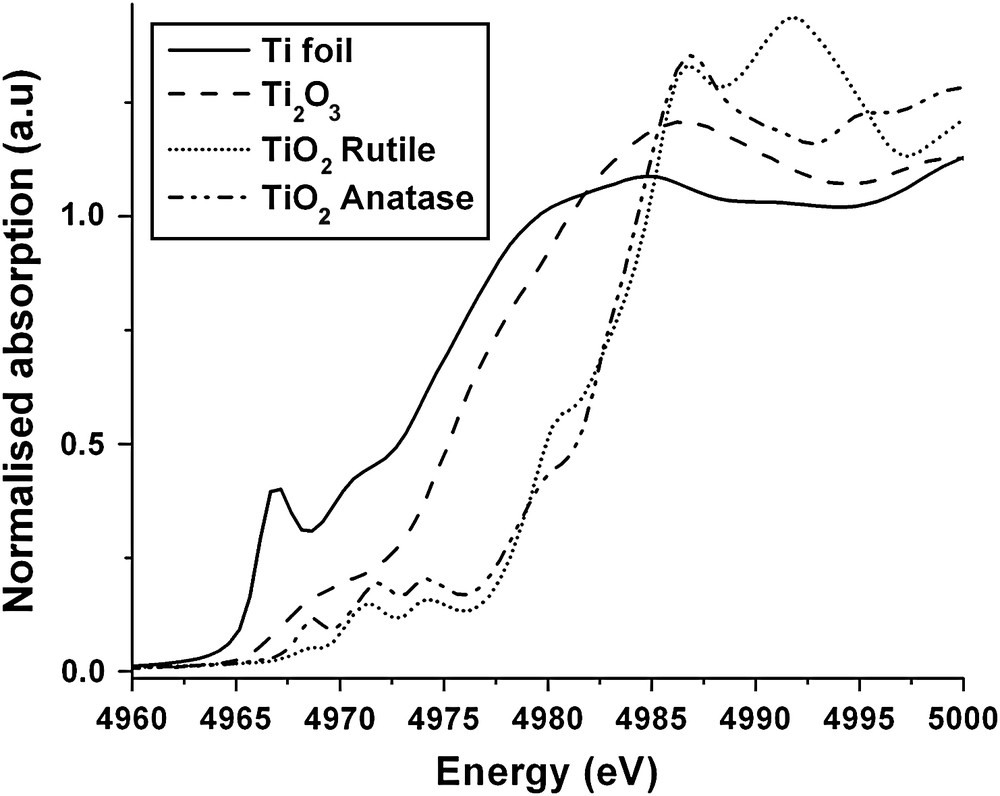
The Ti K-edge XANES spectra of titanium metal and oxides.
The above features of the XAS technique will be exemplified in the following sections by considering several case studies. Firstly, we will consider the EXAFS of nanocrystalline oxides. Until recently this has been an area of some debate with EXAFS data being used both to support and to refute high levels of disorder in these materials [18]. We shall demonstrate that the method of sample preparation plays a major role in determining the nature and interpretation of the XAS data. Secondly, we will treat the use of XAS, both EXAFS and XANES, in the study of solid-state electrochemical reactions by discussing the case of lithium insertion into NiCo2O4 spinel oxide, a material that is being considered as the active electrode material in lithium and sodium cells [19]. Thirdly, an example of the use of EXAFS in the structural study of solid electrolytes will be presented, in this case the novel plastically crystalline electrolytes which have potential applications in solid-state batteries [20,21]. The final example will be of a very widely used application of EXAFS, the use in locating the dopant site of an impurity in a host matrix. In this case we will consider cation doping of nanocrystalline anatase titanium dioxide [22–24]. We will conclude the article with some indications of areas where the technique could develop in the next few years.
2 Experimental procedures
The set up of a typical XAS experiment is shown schematically in Fig. 3. The requirement of a high intensity, tunable X-ray source means that the majority of experiments are now undertaken on synchrotron radiation sources. The experiment is basically simple. The white beam from the synchrotron is passed through a two crystal (usually silicon) monochromator, the wavelength being selected by the Bragg condition and step-wise rotation of the crystals allows a sweep of the X-ray energy. The intensity of the X-ray beam incident on the sample, Io, is measured with an ion chamber filled with a gas mixture set to be 80% transmitting. For samples in which the target atom is concentrated (>1%) a transmission mode is employed and the transmitted intensity, It, is measured with a second ion chamber, in this case set to be 80% absorbing. The absorption coefficient is simply evaluated from ln(Io/It). The sample thickness for a transmission experiment is adjusted to give a step jump at the absorption edge of μ about 1, by using thin films or making pellets of powders with a non-adsorbing diluent (i.e. containing only light atoms, for example, boron nitride, silica or polythene). For dilute samples a fluorescence mode is used, where the fluorescence X-rays which are emitted upon absorption of the incident X-rays are used to monitor the absorption coefficient. A scan will typically take the order of 30 min. XAS spectra can be collected for most elements in the periodic table, however, for the lighter elements (roughly those lighter than calcium) air absorption will be significant and the sample needs to be in a vacuum along with the X-ray beam.
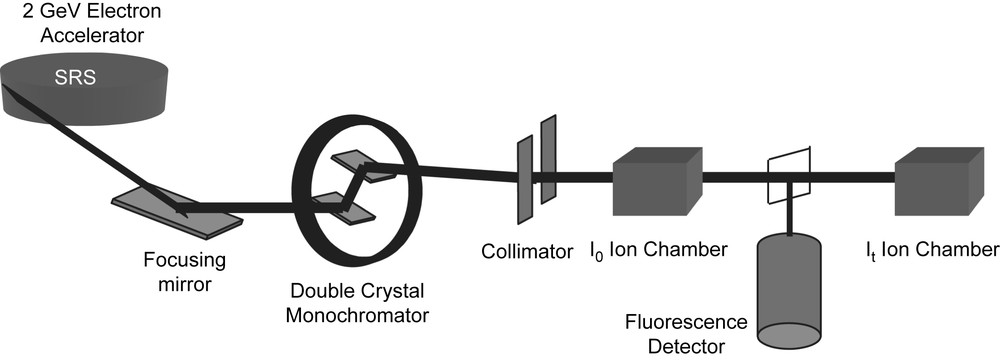
The schematic layout of a typical EXAFS station (9.3 at the Daresbury SRS).
The data that will be discussed in later sections were all collected at the Daresbury SRS which is an electron storage ring operating at 2 GeV and an average current of 150 mA. XAS stations 7.1, 8.1, 9.2 or 9.3 were used for the work and these have ion chambers for transmission experiments and multi-element solid-state detectors (Canberra) for fluorescence experiments.2 There are order-sorting monochromators on these stations which allow higher harmonics to be rejected from the incident beam. These stations also allow data to be collected in ‘quick-scanning mode’ which reduces the scan time to the order of a few minutes. In this mode the monochromator is moved at a constant angular speed and the data recorded ‘on the fly’. Station 9.3 is a combined station allowing the simultaneous collection of XAS spectra and X-ray powder diffraction (XRPD) patterns from the sample. This station is also equipped with a specially designed furnace so that data can be collected at any temperature between ambient and 1100 °C [25]. This has proved particularly useful in the study of the effects of grain growth in nanocrystalline samples. The data were analysed with the Daresbury XAS programs [12].
3 Case studies
3.1 Nanocrystalline oxides
Nanomaterials are systems that contain particles with one dimension in the nanometre regime. Currently there is intense interest from biologists, chemists, physicists and engineers in the application of these materials, so-called nanotechnology, which is sometimes referred to as ‘the next industrial revolution’ [26]. The reason for the interest is the unusual properties, very often with useful applications, that are exhibited by these materials when compared to their bulk counterparts [27–35]. Here we will focus on rather simple ionic solids with dimensions predominantly less than 100 nm, materials now known as nanoionics. In these systems the origin of the unusual properties is twofold; (i) the fact that the dimensions of the particles approach, or become smaller than, the critical length for certain phenomena (e.g. the de Broglie wavelength for the electron, the mean free path of excitons, the distance required to form a Frank–Reed dislocation loop, thickness of the space-charge layer, etc.) and (ii) surface effects dominate the thermodynamics and energetics of the particles (e.g. crystal structure, surface morphology, reactivity, etc.). The second factor can lead to nanocrystals adopting different morphologies to bulk crystals with different exposed lattice planes leading to an extraordinary surface chemistry [36,37] and catalytic activity [38,39]. The importance of surfaces and boundaries in nanocrystalline systems is demonstrated in Fig. 4, which shows the fraction of atoms in these regions as a function of grain size.
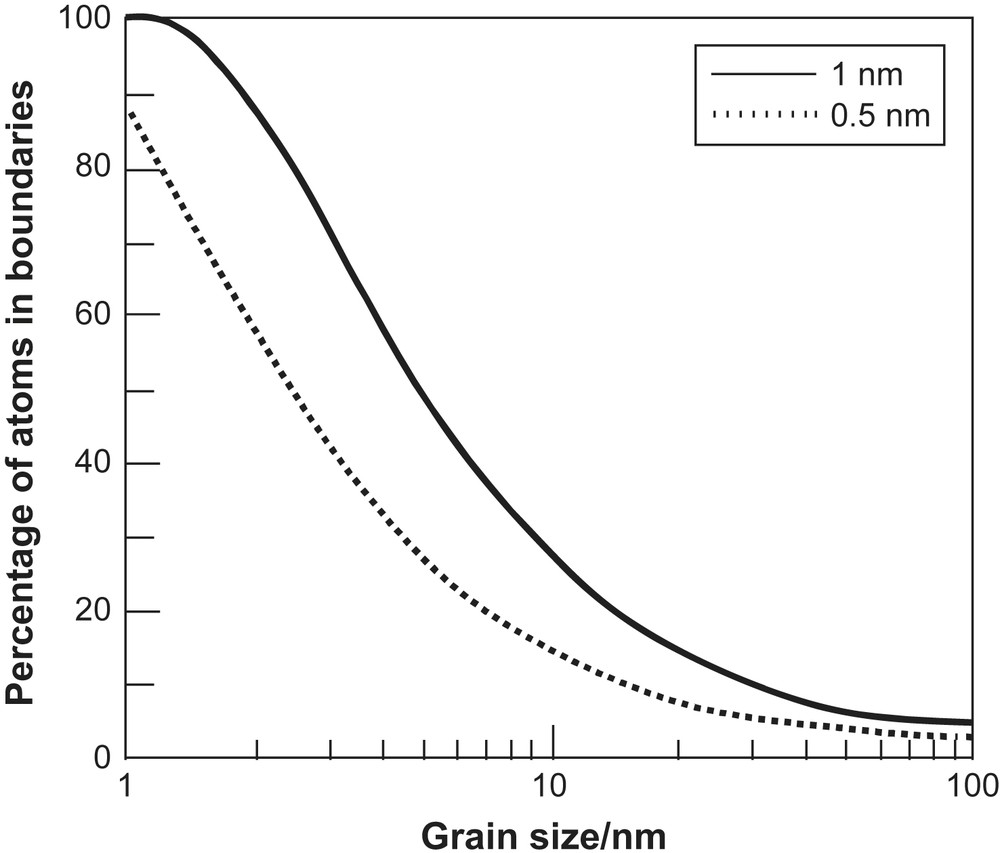
Percentage of atoms in grain boundaries as a function of grain size assuming boundary widths of 0.5 and 1 nm.
Unusually rapid diffusion of atoms in nanocrystalline metals was recognised in early studies [34,40,41]. In turn this will affect a wide range of physical and chemical properties of which the enhanced plasticity of metal and ceramic compacts has attracted considerable attention [42]. Fast diffusion in ionic and semi-ionic solids has important technological implications for greatly improved materials in a range of applications such as electrolytes and electrodes for batteries and fuel cells and chemical sensors [43–48]. As a result there has been considerable effort to quantify the extent of the diffusion enhancement and to determine the nature of the fundamental processes involved. However, until relatively recently, surveys of the experimental data of the diffusion in nanoionic materials showed that the results were not consistent, with variations even for the same system [49]. A breakthrough came with the work of Maier and co-workers who provided unambiguous experimental evidence of enhanced diffusion in layered nanocrystalline films of BaF2 and CaF2 [50]. Nevertheless, as recent articles have stressed [51,52], the volume of reliable experimental information is still sparse and the detailed understanding of the phenomenon is poor. A major problem is in the preparation of reliable samples and that the properties are very dependent on the synthetic route.
The microstructure is the key to the properties of nanocrystalline materials. It was seen earlier that simple geometric considerations lead to the conclusion that a large fraction of the atoms in a nanocrystal is in the surface (see Fig. 4). However, the crucial questions are what is the nature of the surface, in terms of the level of atomic order, and what is the structure of the interface between grains? In both cases, two extreme possibilities have been considered. One extreme is that there is extensive disorder in an interface that is several atoms in width. In some of the early work on nanocrystals this was intuitively assumed to be the case and the interfaces were referred to as ‘gas-like’ or ‘liquid-like’. This structure would clearly account for rapid diffusion in nanocrystalline samples. The alternative view is that the interface is similar to a grain boundary in normal bulk materials. In this case the interfaces would exhibit usual behaviour, although they would be present in unusually large number. High resolution TEM can provide the microstructural details. TEM measurements on nanocrystalline ceria showed that the grains had a high degree of perfection and were separated by sharp boundaries [53]. Unfortunately the data from HRTEM studies are still relatively sparse and other structural techniques had to be used to explore the microstructure, such as electron diffraction [54], positron annihilation spectroscopy [55] and XAS measurements [56–58].
In principle, for a nanocrystalline sample the XAS signal could be attenuated for two reasons: (i) the particle is so small that the average coordination numbers for the neighbouring shells are reduced or (ii) there is sufficient disorder in the sample (e.g. at the interfaces) that the Debye–Waller factors are increased. At first sight it would appear that XAS has little to offer as a microstructural probe, however, for (i) to be operative the particle size has to be very small and typically less than 5 nm. Thus XAS can offer a probe of disorder in the interfaces of nanocrystals. However, the results have been very confusing and the subject of much argument. The XAS data for ZrO2 represent a typical example. There have been several XAS studies of this system, which claim evidence for disordered interfaces in nanocrystalline samples, i.e. an attenuation of the XAS for the Zr–Zr correlation [59,60]. However, similar measurements on carefully prepared films, with particle sizes down to 6 nm found that the EXAFS was indistinguishable from the bulk [61] and great care was taken to ensure that all hydroxyl species were removed from the sample. Other studies of nanocrystalline materials have shown that the preparation methods strongly affect the XAS data [62–66].
In recent years we have been using XAS measurements to study the effect of the preparation route of nanocrystalline oxides on their microstructure. We have been using mainly two synthetic routes, namely sol–gel methods and high-energy ball milling. Sol–gel procedures have been used for many years to produce oxides and ceramics offering control over the structure and composition at the molecular level [67,68]. The usual procedure is to subject a metal alkoxide, M(OR)x to controlled hydrolysis, leading to replacement of the OR group by OH. This leads to the formation of a sol, very small colloidal particles, which then condense to form a gel, an inter-connected network. The gel is then dried and the final product can be either oxide (as in the case of silicon tetraethyl orthosilicate) or hydroxide (zirconium isopropoxide) or a mixed methoxy-hydroxide (as in the case of magnesium methoxide). Thus the final step in the formation of the oxide is calcination at high temperature. This step is difficult to control and presents two major problems, as exemplified by recent work on ZrO2 [22]. If the calcining temperature is too low then all of the residual OH groups may not be completely removed from the material. If the calcination temperature is too high then the particles will grow and the nanocrystallites will be lost. The surface energy of nanocrystals is such that relatively moderate temperatures (∼400 °C in the case of most oxides) will lead to measurable grain growth over the period of a few minutes [63].
An apparently completely general method of producing all forms of nanocrystals is by mechanical attrition. This involves taking bulk material and reducing the grain size in a high-energy ball mill [69–72]. The advantages of ball milling are the fact that almost every material is accessible, that large amounts can be produced and that the average grain size can easily be varied by choice of the milling time. In addition, it is possible to produce materials in situ in the ball mill by double decomposition reactions [73,74]. This method is therefore useful when many different materials are to be compared. One disadvantage of ball milling is that abrasion of the milling media may occur. This has to be minimized by choosing appropriate materials for the milling vial and balls. A further disadvantage is that the milling can produce amorphous debris, to the extent that recent work on ball-milled Al2O3 indicated that the sample consisted of nanocrystalline grains embedded in amorphous material [75].
Zirconium oxide, ZrO2, is one of the most studied materials due to its applications as an engineering ceramic and as an oxygen ion conductor for solid oxide fuel cells. It has also been the subject of numerous investigations as a nanoionic material due to the apparent ease of preparation. We use the term ‘apparent’ as the most common procedure of heating the hydroxide at modest temperature (500 °C) for a short period (60 min) has been reported as a means of producing 10 nm particle sizes of the oxide [76]. Later work [62] has shown that this procedure does not produce the pure oxide but material that contains a considerable fraction of hydroxyl species, sufficient to invalidate any XAS studies. A polymer precursor route can produce high quality thin films of nanocrystalline ZrO2. XAS studies [57,58] of these samples have shown that with particle sizes as small as 6 nm there is no attenuation of the XAS signal and the interfaces between crystallites are similar to grain boundaries in bulk materials. We have recently made new XAS measurements on powdered samples of pure nanocrystalline zirconia prepared by sol–gel procedures. We overcame the problem of grain growth during preparation by using silica, 15% by weight, to pin the grains [77]. The preparation involved the addition of TEOS to zirconium alkoxide prior to the hydrolysis stage. The ZrO2 sample was in the tetragonal phase with a grain size of 10 nm, even after calcining at 1000 °C. XAS spectra for the nanocrystalline ZrO2 were collected at a series of temperatures down to 17 K. The measurements were undertaken at low temperatures to remove any ambiguity about the possibility of the contributions from dynamic and static disorders to the attenuation of the XAS signal. Parallel data were also collected for a bulk sample of tetragonal zirconia that was prepared by the polymer precursor method with the addition of 8 mol% yttria and calcined at 1000 °C. The data for the two samples were virtually identical at all temperatures and only those at 17 K are shown in Fig. 5. This conclusively proves that the levels of both dynamic and static disorders in sol–gel prepared nanocrystalline ZrO2 are virtually the same as in the bulk material. Hence the interfaces between the grains are like grain boundaries in normal bulk samples.
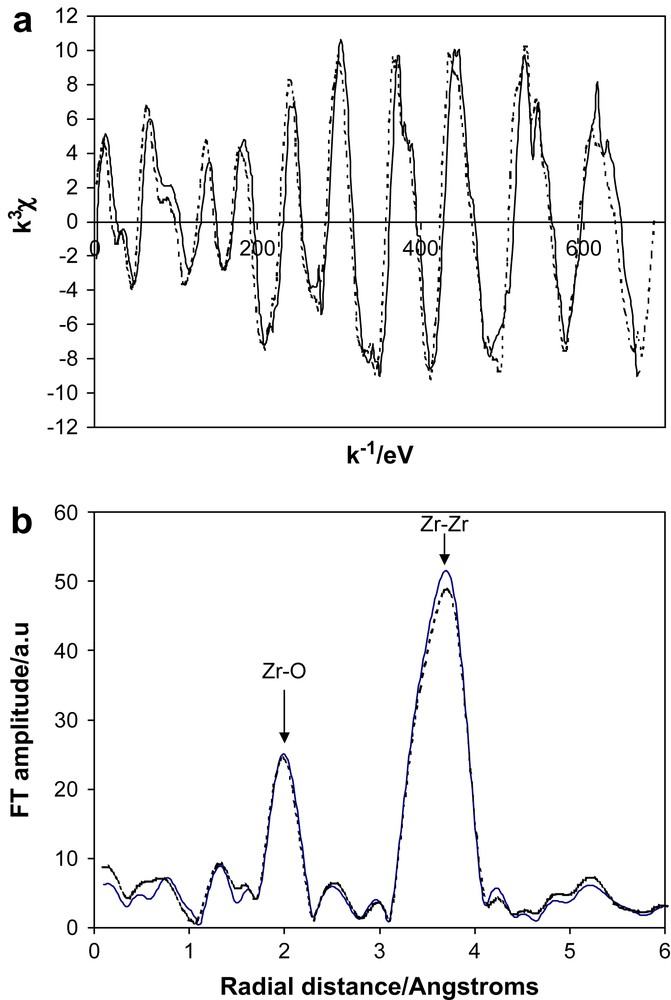
The Zr K-edge EXAFS of tetragonal ZrO2 at 17 K: (a) the normalised EXAFS, (b) the Fourier transform which has been corrected with the phase shift of the first shell. The solid line (—) is bulk material, the dotted line (⋯) is sol–gel prepared nanocrystals (10 nm).
Parallel studies were also made of ball-milled ZrO2 with a particle size of 13 nm. X-ray diffraction showed that the sample was monoclinic [55]. For comparison data were also collected for a bulk, monoclinic sample (particle size 110 nm). The Fourier transforms of the spectra collected at 17 K are shown in Fig. 6. There is a strong attenuation of the EXAFS signal for the ball-milled sample, represented by a dramatic reduction in the magnitude of the peak at ∼3.5 Å, the Zr–Zr correlations. At this measurement temperature the differences can only be due to differences in the level of static disorder in the samples. We interpret this as the formation of significant levels of amorphous material in the ball-milled samples, a feature of this method of sample preparation [75,78].

The Fourier transform of Zr K-edge EXAFS of bulk- and ball-milled monoclinic ZrO2 at 17 K. The Fourier transform has been corrected with the phase shift of the first shell. The solid line (—) is the bulk sample (110 nm), the dotted line (⋯) is the ball-milled sample (13 nm).
The report of unusually high lithium-ion diffusion in ball-milled samples of LiNbO3 [79] was intriguing, as this is not normally regarded as a particularly good ionic conductor. We therefore undertook Nb K-edge XAS studies of nanocrystalline LiNbO3 prepared by sol–gel methods from alkoxides and ball-milled LiNbO3 [80]. The results are shown in the form of the Fourier transforms in Fig. 7. The sol–gel sample (particle size 21 nm) shows a transform which is very similar to bulk material, as would be expected as the particles are relatively large and the average CN will not be reduced significantly. In contrast the ball-milled sample (particle size 50 nm) exhibits considerably reduced peaks, even for the first peak, the Nb–O correlation. We have interpreted this as due to the formation of a large fraction of amorphous material in the ball-milled sample, which we roughly estimate to be of the order of 50%. It is worth noting that these EXAFS findings were confirmed in a very recent study of lithium niobate by Heitjans and co-workers [81]. In addition they clearly showed the presence of amorphous material in the ball-milled sample by TEM measurements.

The Fourier transform of the Nb K-edge EXAFS of LiNbO3. The transform has been corrected with the phase shift of the first shell. The solid line (—) is a bulk sample, the long dashed line (– – – –) is a sol–gel sample (21 nm), the short dashed line (- - -) is a ball-milled sample (50 nm).
In summary, XAS measurements have clearly demonstrated that the preparation route has a profound effect on the microstructure of nanocrystalline oxides; the softer sol–gel approach produces highly ordered samples, whereas high-energy ball milling produces highly disordered samples with a high fraction of amorphous material. The rapid ionic transport observed in ball-milled samples is due to migration through the amorphous regions. However, it is lost on heating to moderate temperatures as the amorphous regions crystallise.
3.2 Solid-state electrochemical reactions
Recently, it was demonstrated that some nanocrystalline binary oxides, such as CoO, NiO and Co3O4 are interesting candidates for the negative electrode of lithium-ion batteries when fully reduced by discharge to ca. 0 V vs. Li [82–84]. The electrochemical reduction of the transition elements to the metallic state takes place simultaneously with the formation of lithium oxide. For cobalt oxides, the partial reversibility of the reduction process was ascribed to the nanosized Co particles dispersed in the Li2O matrix that were produced during reduction, which possess an enhanced reactivity. In addition, the complex Li2O + Co system is surrounded by a solid electrolyte interface. Similarly, a good performance was found for NiO and FeO, in which reversible capacities close to 700 mA h g−1 were reported with high cycling efficiency [82]. There is considerable interest in these systems for their technological applications and there has been a focus on the details of the electrochemical processes that occur on charge/discharge cycles. Cycling involves the reduction/oxidation of the transition metal cation and this can be readily monitored in XANES experiments. The measurements can be made on prototype lithium batteries by in situ experiments due to the transparency to hard X-rays of lithium, the organic electrolytes and the plastic containers/windows [85–88]. Thus in mixed metal systems, such as LiNi1/3Co1/3Mn1/3O2, it is possible to monitor the oxidation state of each transition metal cation in the system during charge/discharge [85].
As part of the ALISTORE project we have studied a number of battery systems using XAS and a good example of this work is the investigation of lithium insertion/extraction in NiCo2O4 spinel oxide [89]. The use of the NiCo2O4 spinel oxide as the active electrode material in lithium and sodium cells yielded a reversible capacity of ca. 884 mA h g−1 vs. lithium, while reversible cell capacities close to 200 and 300 mA h g−1 were observed for sodium and sodium ion cells, respectively [19]. A complete loss of long-range order of the transition metal compounds takes place during the first discharge. By analogy with Li/NiO and Li/Co3O4, a reversible reaction of sodium with the spinel oxide in which Na2O and the metals are formed was suggested.
The electrodes for the electrochemical experiments were nanocrystalline NiCo2O4 as the active material (85%), mixed with PVDF (5%) and SP carbon black (10%). The mixture was dispersed and then the solvent evaporated by heating at 120 °C under vacuum for 2 h. The resulting composite electrode was supported on a copper foil and used as the positive electrode in Li- and Na-anode cells. The electrolyte was 1 M LiPF6 or 1 M NaClO4 dissolved in EC:DEC or EC:DMC solvent mixture, respectively. Used electrodes were kept inside a thermo-sealed bag inside a high integrity dry-box and the bag was directly transferred to the XAS station. In addition to the electrode material XAS spectra were collected for Ni metal, NiO, Co metal, CoO, Co3O4, NiFe2O4 and LiCoO2 as reference materials for the XANES analysis. The experiments could have been performed in situ, however, the XAS experiments would have taken a lot longer as the system would take time to equilibrate after changes in cell voltage.
Fig. 8 shows the normalised Co K-edge XANES spectra of the as-prepared and used electrodes. For the starting sample, the spectrum is comparable to the literature [90]. A very weak absorption pre-peak at ca. −6 eV from the Co K-edge of cobalt (7710 eV) is visible. This absorption represents the transition of the 1s electron to an unoccupied eg orbital of cobalt ions with a low-spin electronic configuration. This is an electric dipole forbidden transition in an ideal octahedral symmetry, while the non-centrosymmetric tetrahedral environment allows its observation. Thus the pre-edge can be ascribed to the presence of tetrahedral cobalt in the structure of NiCo2O4, which is commonly described as an inverse spinel [91]. The main absorption peak at +12 eV is ascribable to the transition of a 1s core electron to an unoccupied 4p bound state with t1g symmetry, and thus is electric dipole-allowed for both tetrahedrally and octahedrally co-ordinated cobalt atoms. Interesting conclusions can be extracted by comparison of NiCo2O4 and Co3O4 XANES. They are virtually identical with a very slight shift. This suggests that the Co oxidation states are the same in both, i.e. 8/3 or 2.667. Hence the charge on Ni is also 2.667, i.e. there is probably some Ni3+ present.
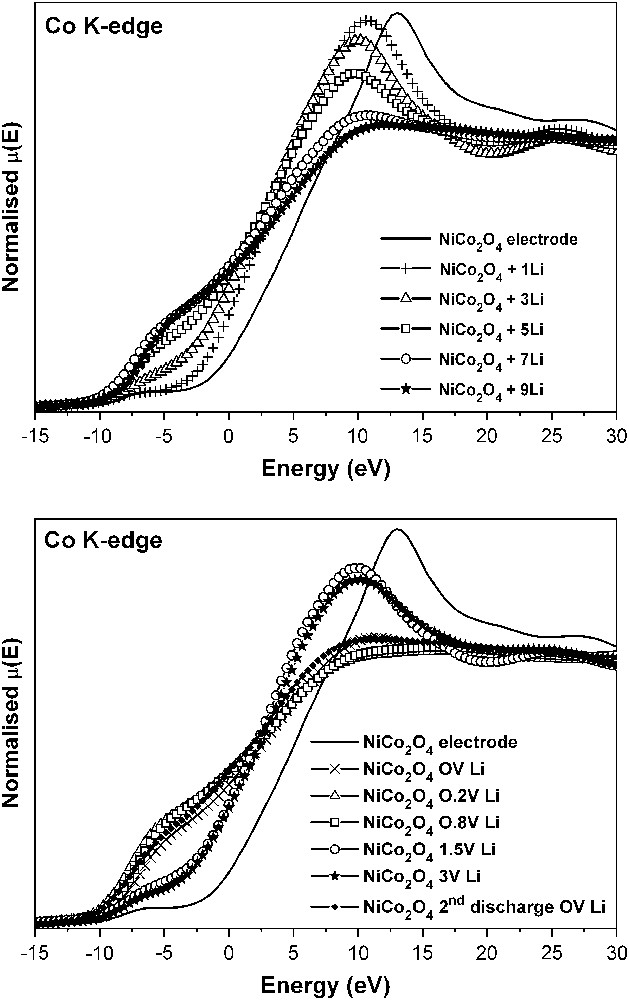
Co K-edge XANES spectra of NiCo2O4 in lithium cells at different depths of discharge (top) and charge (bottom).
The changes in the oxidation state of the absorber atoms during cell operation are particularly well followed by XANES and provide a deeper insight than diffraction techniques. The changes in the Co K-edge XANES spectra of the NiCo2O4 electrodes (Fig. 8) evidence the displacement of the edge to lower energies from the very beginning of the discharge process, which is indicative of an immediate cobalt reduction process in NiCo2O4, that leads to metallic cobalt on approaching to 0 V. In addition, Fig. 8 (top) reveals a progressive loss of signal intensity. This behaviour can be related to the loss of p character in the 1s → 4p transition, due to d–p mixing, as a consequence of the conversion to metal cobalt particles, absorbing X-rays at the lower energy values.
The XANES spectra obtained after recharge of the lithium cells using NiCo2O4 electrodes are shown in Fig. 8 (bottom). The reversibility of the reduction process is evidenced after lithium extraction up to 1.5 V by the fact that the spectra recover their shape partially. However, the maximum oxidation state of cobalt atoms in the spinel oxide is not fully recovered, as shown by the position of the edge. This behaviour agrees with the non-recovered irreversible capacity. Moreover, two steps can be distinguished during the charging process in Fig. 8. From 0 to ca. 0.8 V, the XANES spectra do not alter significantly. Probably in that voltage interval, which coincides with the extraction of ca. 0.5 F mol−1 of NiCo2O4, the changes are mostly related to the loss of the polymer-gel film and/or changes in the oxidation state of nickel. After charging to 1.5–3.0 V, some differences from the starting NiCo2O4 are observed. Thus, the pre-peak at lower energy is more clearly observed than in NiCo2O4. Also, the most intense peak is located at lower energy. Thus, the structure of the oxidised material differs from the initial spinel structure and less symmetric environments of cobalt are expected. Moreover, from the shift of the absorption edge in the XANES spectra, the initial Co2.667+ average oxidation state is not fully recovered in the re-oxidised material.
The changes in the oxidation state of the nickel atoms during electrochemical reactions were also successfully followed by XANES [89]. The EXAFS results for the fully lithiated spinel, NiCo2O4 + 9Li are of particular interest. The results of the best fit show that the electrode has clearly been converted to metal in these samples. This can be seen qualitatively in the Fourier transforms (FT) shown in Fig. 9. The plots of the electrode are considerably attenuated compared to the metal foil. There are two possible causes of this: small and disordered particles. Firstly the nanoparticles were extremely small and there was a much reduced coordination number. However, a detailed fitting showed that the particles would have to be extremely small, ∼1 nm, for this to be true. We note that the first peak in the FT is reduced and this is really unusual. The second possibility is that the particles are very disordered. This would not be surprising as they are being formed in a disordered mixture of lithium and lithium oxide, and it will be a Co/Ni alloy particle and not pure metal. We have subjected the EXAFS for NiCo2O4 + 9Li to further analysis, by fitting the first shell only and holding the Debye–Waller factor fixed at the foil value. In other words we are assuming that the reduction in the EXAFS peak is only due to particle size and that there is no disorder present. This gives a coordination number for Co as ∼5 and for Ni ∼4 (for fcc this should be 12). Using simple geometry arguments this puts the size of the particles around 1 nm. This is not unreasonable as it will be ∼1 nm in the smallest dimension. Such an ultrafine particle size, not usually found in the literature, maybe connected with the Li2O matrix. However, one can speculate that a high level of disorder in metal particles could also contribute to peak attenuation. Lithium oxide exerts a protection against coalescence of the metal particles, which is not present in cobalt or bimetallic samples prepared by other means [92–94]. Also, a thin cobalt oxide (CoO) passivating layer around the metal core, as found in the products using macromolecular surfactants [94], is not seen in the electrode working at ca. 0 V vs. Li, as there is no contact with air, and this could be considered as an indirect method of preparation of metal oxide-free metal nanoparticles.
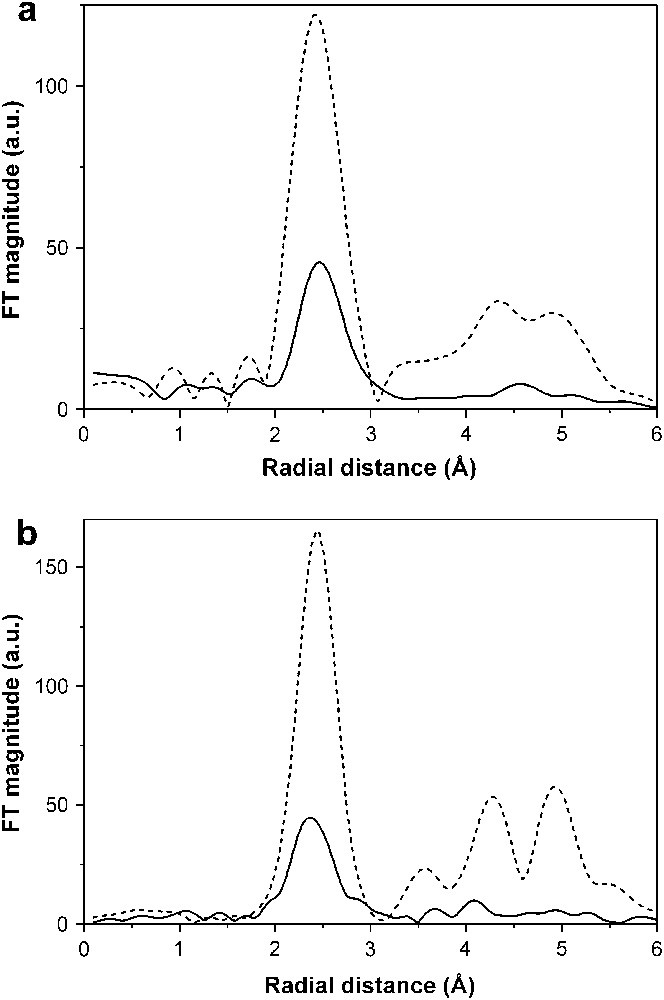
The comparison of the metal K-edge Fourier transforms for NiCo2O4 electrode + 9Li. The solid line is the electrode and the dotted line is a pure metal foil. (a) Co edge, (b) Ni edge.
3.3 Plastically crystalline electrolytes
Plastic crystals are a class of molecular materials [95,96] that consist of roughly spherical or globular molecules; thus the simplest examples are methane (CH4) and carbon tetrachloride (CCl4) and more complex systems are the bridged cyclic terpenoids, such as camphor and camphene. The materials are characterized by a solid-state phase transition or transitions. In the lowest temperature non-plastic phase the materials are typical organic solids with low crystallographic symmetries and are mechanically brittle and friable. In the solid phase prior to melting the solids are soft, hence the name plastic crystals, and show relatively rapid translational diffusion [96]. In the plastic phase the molecules are undergoing rapid endospherical reorientation and are often referred to as rotator phase solids. In addition, the plastic phases tend to be of high symmetry, either fcc, hcp or bcc. On melting there are relatively small increases in the entropy as the only gain is translational freedom. Two types of plastically crystalline electrolyte are possible. One type is when the ion or ions of the salt are exhibiting plastic behaviour, i.e. one or both ions are undergoing rapid rotation, the conductivity being improved by doping with a salt [20,97]. The second is when a plastic solid with a high dielectric constant dissolves a salt [21,98]. Both types can have solid-state conductivities at room temperature in excess of 10−3 S cm−1, and coupled with appropriate mechanical properties, have potential applications as the electrolytes in solid-state batteries. They offer an alternative to solid polymer electrolytes as the conductivities are higher and the cation transport numbers appear higher.
We have just initiated a programme of XAS studies on plastically crystalline electrolytes and the results presented here are preliminary [99]. We have focused on electrolytes based on ionic salts dissolved in succinonitrile, a readily available material which can be easily purified by zone-refining [100]. In the pure material the plastic phase extends from 238 to 335 K and the dielectric constant is 55, i.e. higher than that for many organic solvents (e.g. acetonitrile has a dielectric constant of 36.6). Succinonitrile will dissolve a wide range of salts and in the non-plastic phase the ionic conductivity is low, typically ∼10−6 S cm−1. On heating the conductivity of the solutions rapidly rises to 10−3–10−4 S cm−1 at 300 K and then there is a further less pronounced increase up to the melting point [21]. This indicates a link between the molecular motion of the organic molecule, rotation and possibly translational diffusion, with the migration of the ions.
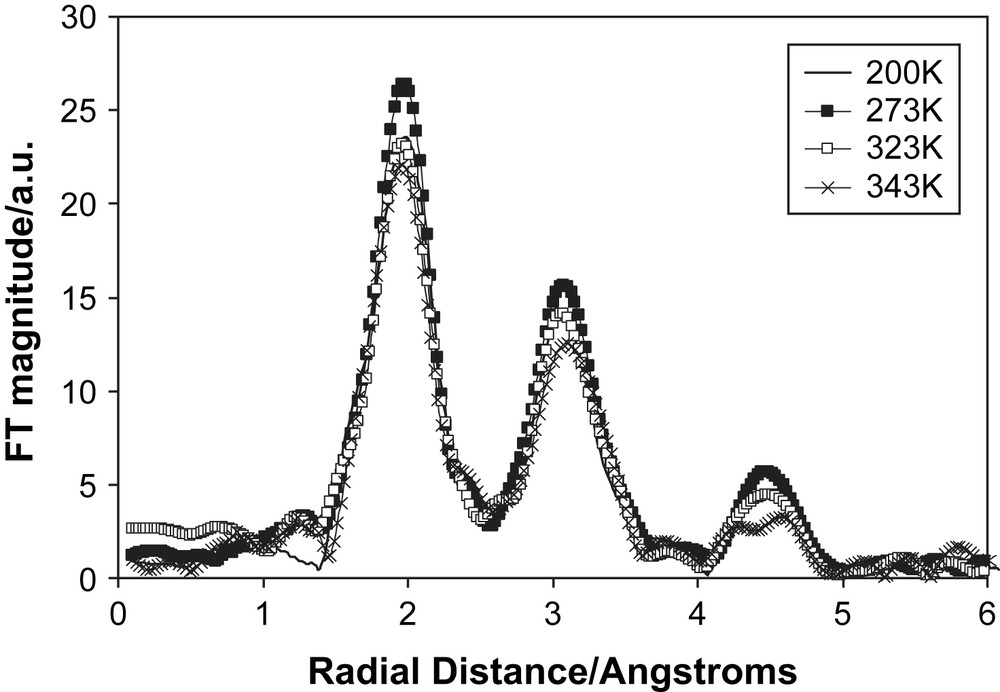
Our aim is to determine the local structure around the ions and monitor changes with temperature. The first system that we investigated was 1 mol% LiBr doped succinonitrile, where we collected Br K-edge XAS data. The measurements made in fluorescence mode and the data were of relatively poor quality. The Fourier transforms of the EXAFS are shown in Fig. 10. At 200 K, i.e. in the non-plastic phase, there is a main peak around 3 Å, corresponding to atoms of the succinonitrile molecule coordinating to the bromide ion. As the temperature was increased the spectra became attenuated and the peak in the Fourier transform is diminished. On melting the EXAFS oscillations were very weak and hardly discernable from the noise. These results are clearly consistent with increasing disorder around the bromide ion with increasing temperature and an increasing mobility of the ions in the system.
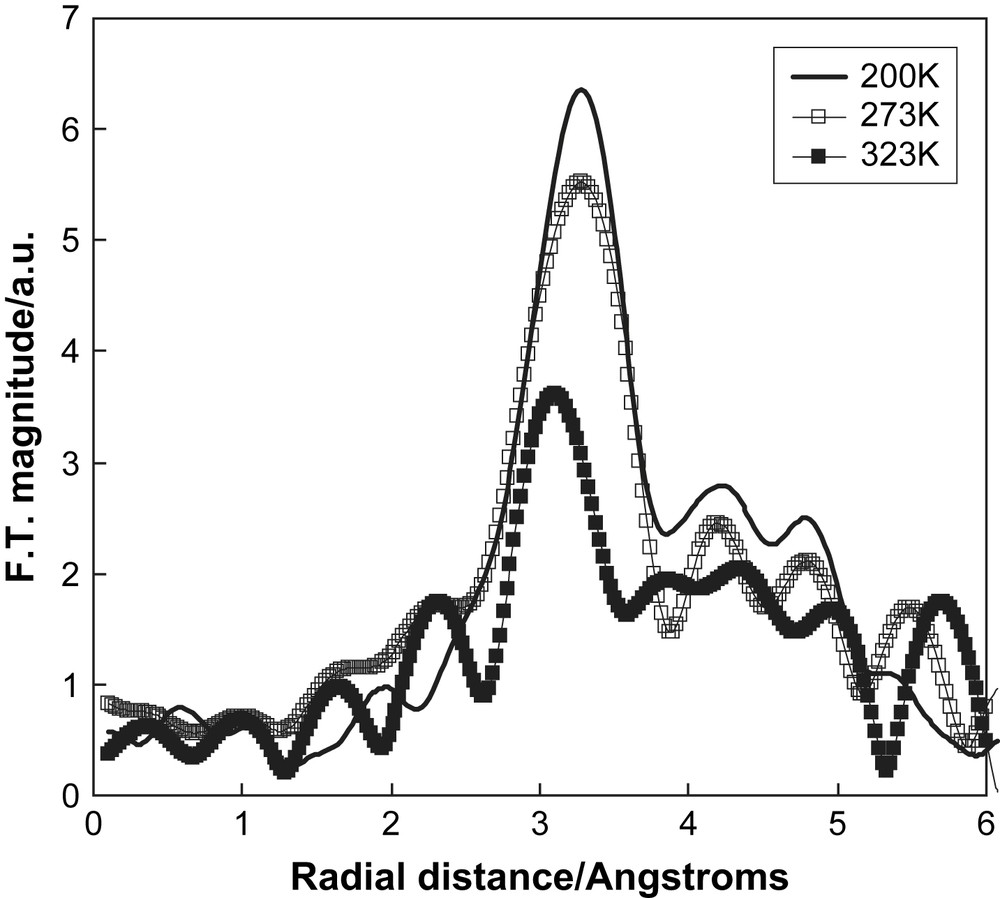
The Fourier transforms of the Br K-edge EXAFS of 1 mol% LiBr doped succinonitrile. The solid line represents data collected at 200 K, open squares at 273 K, and filled squares at 323 K.
High cation conductivity for electrolytes is important for battery applications. Therefore, we examined salts dissolved in succinonitrile that had easily accessible cations, namely Cu(I) and Cu(II) triflate and Cu(I) and Cu(II) bistrifluoromethanesulfonamide (TFSI), and for which there were conductivity measurements [21]. We collected Cu K-edge XAS spectra for all four systems using transmission mode over a range of temperatures and doping concentrations. The general features of the EXAFS and their temperature behaviour were the same for all four systems. The Fourier transforms of the 1 mol% Cu(I) triflate in succinonitrile are shown in Fig. 11. There are three distinct peaks at 2, 3 and 4.5 Å and they show only minor reduction on heating from the non-plastic phase through to the melting point. The peaks were tentatively modelled as shells of N, C and Cu atoms. These data suggest that there is a high degree of order around the cation, even though the succinonitrile molecules are rotating, and appears inconsistent with the observed conductivity. Presently we have no firm explanation of the relation between the EXAFS and the ionic conductivity. One possibility is that the majority of the Cu ions are in locally ordered regions (EXAFS will monitor the average local environment of all the Cu ions in the system) and that a small fraction is mobile and contributes to the conductivity. A second possibility is that the Cu ions are migrating with a tightly bound coordination shell of succinonitrile molecules, similar to a hydrated ion in aqueous solution. However, this seems unlikely as the overall size of the mobile species would be very large in this case. Currently we are devising new experiments to resolve this dilemma of high ionic conduction and highly ordered structure.
The Fourier transforms of the Cu K-edge EXAFS of 1 mol% Cu(I) triflate doped succinonitrile. The solid line represents data collected at 200 K, filled squares at 273 K, open squares at 323 K and crosses at 343 K.
3.4 Dopants in a host matrix
The location of the sites occupied by dopants in materials is a long-standing application of XAS, particularly for oxides and ionic crystals [101]. In cases where the dopant concentration is low this is fairly straightforward and involves only a consideration of substitutional and interstitial sites. A comparison of the dopant and host XAS can resolve the problem, as in the case of cation doped tin oxide [63]. At high concentration quite complex defect clusters can form and the XAS measurements require other inputs, such as computer simulations or diffraction data, to resolve the structures. An early example of this approach was the work on defect clusters in rare earth doped calcium fluoride [102]. Recently, we have been using XAS studies to locate dopant sites in nanocrystalline anatase titania ceramics with particle sizes of 12–30 nm [22–24].
Titanium dioxide is a model binary oxide for fundamental studies that presents many of the exciting properties of electroceramics, including variations of oxygen stoichiometry and ranges of ionic or electronic conductivity [103]. It can also be readily doped with acceptor or donor dopants, i.e. solutes with negative or positive effective charge, respectively. TiO2 has a multitude of applications: it has been a grand-scale white pigment for many years and is currently under investigation for advanced technological and environmental applications, such as solid-state gas sensors [104], photovoltaic cells [105], and photocatalysis [106]. The metastable anatase modification presents better characteristics for photoelectrochemistry.
In our first studies we used XAS to study Nb and Zn doped TiO2 [22]. The data showed that the Nb5+ ion substituted for the Ti4+ ion in the lattice at concentrations of 0.1 and 1 at%. This might have been expected due to the similarity of the ionic radii of Nb5+ (0.69 Å) and Ti4+ (0.68 Å). The ionic radius of Zn2+ (0.74 Å) is similar to that for Ti4+ but was found only to be soluble, dissolving substitutionally for Ti4+, at concentrations of 0.1 at% or less. This emphasises the role of the ion charge (rather than ion size) and that it is the electrostatic effects that determine the segregation of impurities from the host lattice.
Recently we studied the Sn K-edge XAS of 1 at% Sn doped nanoceramic TiO2 [23]. In this case we observed the expected substitutional doping on the Ti4+ site. The Fourier transform of the fluorescence XAS spectrum is shown in Fig. 12. This is very similar to the Fourier transform of the Ti K-edge EXAFS of TiO2 with the peaks at ∼2, 3 and 4 Å representing shells of O, Ti and O atoms, respectively. However, we were able to take the analysis further by comparison with DFT computer simulations of the system using the CASTEP code. The structural parameters are listed in Table 1 for TiO2 and Sn doped TiO2 from the various techniques. Firstly we see that the slightly large Sn4+ ion slightly dilates the lattice. Secondly, there is an excellent agreement for the radial distances from the EXAFS and the simulations, especially for the first two shells.

Sn K-edge EXAFS spectra (k3-weighted) and corresponding Fourier transform for 1 mol% doped TiO2 calcined at 300 °C. (a) Normalised EXAFS and (b) corresponding Fourier transform. The experimental data are represented by the solid line and the best fit to the theoretical model based on substitutional doping is represented by the dotted line.
Structural parameters for TiO2 and Sn doped TiO2
| Atom | TiO2 | Ti EXAFS | Sn EXAFS | Sn DFT | ||||||
| XRD | Bulk TiO2 | Nanoceramic TiO2 | TiO2 | |||||||
| CN | RD/Å | CN | RD/Å | A/Å2 | CN | RD/Å | A/Å2 | CN | RD/Å | |
| O | 4 | 1.934 | 6 | 1.935 | 0.014 | 6 | 2.020 | 0.008 | 4 | 2.03 |
| O | 2 | 1.979 | 2 | 2.10 | ||||||
| Ti | 4 | 3.039 | 4 | 3.033 | 0.012 | 4 | 3.121 | 0.009 | 4 | 3.12 |
| Ti | 4 | 3.785 | 4 | 3.789 | 0.025 | 4 | 3.868 | 0.014 | 4 | 3.82 |
| O | 8 | 3.856 | 8 | 3.802 | 0.017 | 8 | 3.959 | 0.008 | 8 | 3.87 |
We have made a similar combined EXAFS and DFT study of Zr4+ doped TiO2 [23]. The Fourier transform of the Zr K-edge XAS spectrum is shown in Fig. 13. The transform is very similar to that for Sn2+doped TiO2 and is best fitted by substitutional doping. Also shown in Fig. 13 is the Fourier transform of the Y K-edge of a 1 at% Y doped TiO2 nanoceramic. In this case there is only one broad peak and is a clear indication that the larger size of the Y3+ ion and the different ionic charge when compared to Ti4+ leads to a segregation of the dopant into the surface regions of the host. Similar effects were found in cation doped nanocrystalline SnO2 samples when they were heated [63].
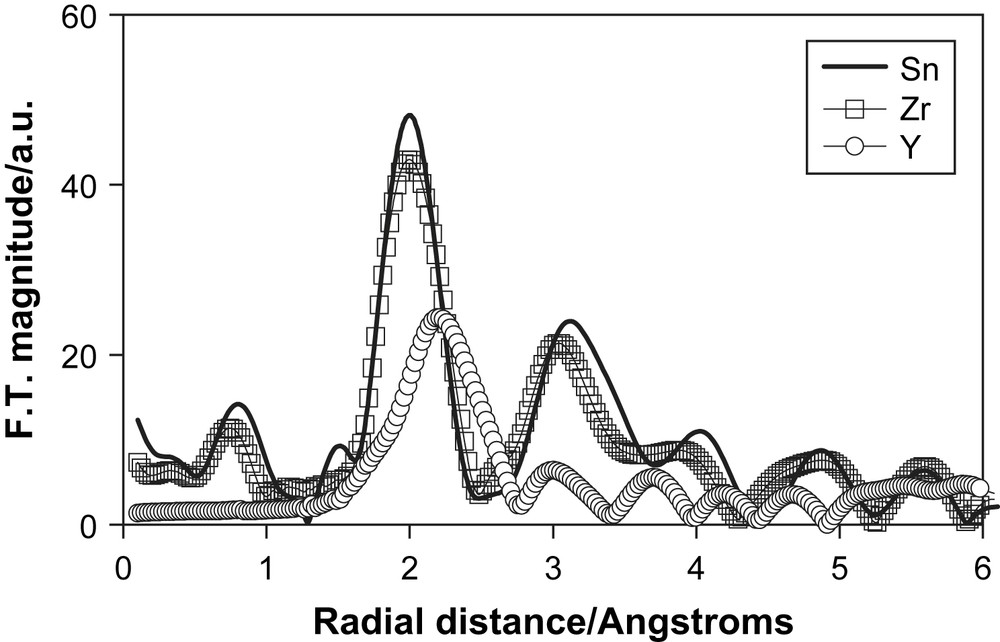
The Fourier transform of the K-edge EXAFS spectrum of the dopant cations in TiO2.
4 Future developments in XAS
The first development that is expected over the next decade is more access to synchrotron radiation with the recent commissioning and opening of new ‘third generation’ synchrotron facilities with higher brightness3; in Europe the new synchrotrons are the Diamond Light Source (UK), Soleil (France), Alba (Spain), in the Middle East Sesame (Jordan), the Australian Synchrotron and the Canadian Light Source. X-ray absorption spectroscopy will be a major technique, with dedicated stations, at all the new synchrotrons. In addition the new stations will be capable of improved performance and novel experiments. The areas of improvement include the speed of data collection, the use of focused beams and simultaneous XAS and other techniques.
In a conventional XAS experiment the monochromator is driven by a stepper motor. Thus the sequence of events during data collection is as follows: the monochromator moves a step (millidegree or less), the monochromator is allowed time to settle, the detectors record X-ray intensity for a fixed time (about 1 s), and the sequence is repeated. Thus a typical XAS scan over the pre-edge, XANES and EXAFS regions will take the order of 20–60 min. An alternative approach, available now at many synchrotron XAS stations is quick scanning EXAFS or QEXAFS [107–110]. In this mode the monochromator is moved at a fixed angular velocity and the data are collected ‘on the fly’. This reduces the time per scan to a few minutes or even seconds, the limitation the speed being the speed of data collection and transfer. Thus high throughput experiments can be undertaken with an array of samples and robotic placement of samples in the beam.
For more rapid data collection then energy dispersive EXAFS (EDE) can be employed [110–115]. This technique uses a range of X-ray energies which are focused onto the sample by a bent crystal ‘polychromator’. The emergent dispersed fan of X-ray energies coming from the sample are then collected simultaneously by a one-dimensional, position sensitive detector located behind the sample. Thus the technique eliminates the need for monochromatic scanning. Thus it makes more efficient use of synchrotron radiation beam as a bandwidth of energies are used and more significantly it enables a full XAS spectrum to be collected simultaneously in a very short time, milliseconds or less, depending on the sample. Thus experiments can follow dynamic processes by taking a number of consecutive spectra. A limiting factor in this technique is the requirement of very fast and sensitive signal detection; however, there has been good progress in detector development [116].
In the early XAS experiments the beam on the sample was typically 5 mm wide and 1 mm high. The brightness of third generation synchrotrons means that the size of the X-ray spot on the sample can be reduced and a good XAS signal can still be recorded. Thus microfocus XAS is possible and very small areas of a sample can be investigated with a focused beam [117]. Currently a beam size of around 1 μm2 can be achieved at a number of synchrotron sources and there are efforts for a further reduction. Hence complex sample can be mapped for elemental composition (using X-ray fluorescence), element oxidation state and element local environment.
For some time it has been possible to combine XAS measurements with a very wide range of spectroscopies and other techniques and to perform simultaneous experiments on a system. In addition, it is possible to undertake the combined experiments in situ, as is often the case in studies of catalysis. However, exciting new possibilities are emerging of combining microfocus XAS with other microscopic spectroscopies, such as micro-Raman [118]. Similarly, developments in EDE mean that combined in situ experiments can now be considered where processes are occurring on very short (millisecond) timescales [119].
In summary, XAS techniques are expected to develop rapidly over the next decade and the developments will have truly beneficial impacts on nanotechnology and electrochemistry.
Acknowledgements
We wish to acknowledge the various students and co-workers at Kent who have worked on nanocrystalline materials. We would also like to express our thanks to various collaborators in our work on nanomaterials over recent years. Firstly, we wish to thank Prof. Mark Smith and Dr. Luke O'Dell in the Physics Department at the University of Warwick for an extremely fruitful collaboration on nanocrystalline oxides. Secondly we wish to thank the members of ALISTORE, the EU Network of Excellence working on nanomaterials for lithium battery applications. We are very grateful for help over several years from staff at the Daresbury SRS that has facilitated the work described in this contribution, especially staff associated with the XAS beam lines; Ian Harvey, Bob Bilsborrow, Fred Mosselmans, Andy Smith, Steve Fiddy, Shusaku Hayama and Alistair Lennie. Finally we wish to acknowledge the financial support for our work on nanomaterials, especially the EPSRC (grants/S61881 and GR/S61898) and the EU (contract SES6-CT2003-503532, ALISTORE).
1 EC (Contract No. SES6-CT2003-503532, ALISTORE); see URL:http://www.u-picardie.fr/alistore/
2 Details of the stations can be found on the Daresbury web site; URL:http://www.srs.ac.uk/srs.
3 A list of synchrotrons can be found on several web sites; e.g. http://www.aps.anl.gov/About/Synchrotrons/index.html or http://www.diamond.ac.uk/UsefulLinks/Links.htm.