

1 Introduction
To improve cycle length and catalytic performances of heterogeneous catalysts a better understanding of their structure under realistic conditions is essential. X-ray absorption spectroscopy (XAS) is a powerful tool to study heterogeneous catalysts. It provides structural and chemical information about a selected element and is very effective in revealing structure-property relationships during in situ measurements carried out at high temperature and under high pressure conditions under different atmospheres. On the one hand, through a fruitful collaboration between the French synchrotron radiation facility SOLEIL and academic (Unité de Catalyse et Chimie du Solide (Lille 1), Laboratoire de Réactivité de Surface (Paris VI)) or pre-industrial (IFPEN) partners, SOLEIL's XAS beamlines are equipped with various catalytic cells and necessary devices (mass spectrometer, gas distribution rack…) for operando studies of catalysts [1]. On the other hand, the installation of a home-made double Quick-EXAFS monochromator [2], first installed at the SAMBA beamline [3] and now at the ROCK beamline [4], offers unique capabilities for the sub-second time-resolved characterisation of catalysts under working conditions.
The purpose of this paper is to illustrate with the study of the activation of molybdenum based catalysts used in the hydrodesulphurisation process (HDS) the methodology which is now available at SOLEIL for the time-resolved Quick-XAS study of heterogeneous catalysts.
The HDS process is an essential process [5] in the petroleum industry. It consists in the catalytic removal of the sulphur heteroelement from diesel and gasoline. Due to strengthened environmental regulations, refiners have to lower the sulphur content in oil fractions by improving HDS processes. Very often, to modify the active phase performances, MoS2 nanocrystallites are decorated with cobalt atoms to form the mixed CoMoS phase according to the Topsøe's model [6]. The active phase is generally obtained by sulphiding oxidic precursors during a thermal treatment, carried out at the academic level under a controlled H2S/H2 atmosphere. Thus monitoring the sulphidation process is crucial to better understand the formation of the active phase. Since molybdenum and its promoter are strongly linked in the reaction, studying simultaneously the Mo and Co species is essential to reveal the relationship between both metals. Moreover as the sulphidation process is a dynamic process, it is crucial to use an in situ time-resolved technique to obtain reliable results. Herein, using Quick-XAS, we have compared the sulphidation properties of a monometallic Mo catalyst supported on Al2O3 with those of the bimetallic Co/Mo catalyst supported on the same alumina support. We used the unique possibility of the edge jumping offered by the double SOLEIL's Quick-EXAFS monochromator [2,4] to record data at both molybdenum and cobalt K edges (measurements on the same sample under similar conditions with a few seconds between measurements of both edges) of the bimetallic CoMo supported catalysts. It allowed a direct and unambiguous comparison of the time-resolved formation of intermediate species that evolve during the studied reaction.
As time-resolved techniques produced a huge amount of data, resorting to chemometric tools is essential to unravel the mechanisms leading to the formation of active species. In this work we used a methodology combining Principal Component Analysis (PCA) and Multivariate Curve Resolution with Alternating Least Squares (MCR-ALS) methods to quantify and extract spectra of intermediate species for the different catalysts. It is noteworthy that the access to the pure spectra can be sometimes unique. Indeed, in the case of catalysis, with species well dispersed at the surface of a support, the transformation of these species leads to something unique, often different from the known bulk phases for which the spectra are reported in the literature [7]. The local order structure which can be extracted from the analysis of the EXAFS data of the MCR-ALS components must be related to meaningful structures reported in the literature or at least ascertained by complementary information for further identification.
2 Sample preparation and ex situ characterisation
CoMo/Al2O3-supported catalysts were synthesized by incipient wetness impregnation of a δ-alumina support with a solution of MoO3 (0.6 M) (Sigma–Aldrich) dissolved into H2O2 (3 M) in which cobalt nitrate (Prolabo) was subsequently added in a Co/Mo ratio of 0.5. The used δ-alumina carrier had a specific surface area of 143 m2/g and a pore volume of 0.99 mL/g. The monometallic Mo/Al2O3-supported catalyst was synthesized using the same procedure without the further addition of cobalt nitrate. The loading of the monometallic catalyst is equal to the relative loading of the corresponding metal in the bimetallic catalyst (Mo: 5.5 wt.%, Co:1.5 wt.%).
Following the impregnation step, the solid was matured in a saturated water atmosphere at room temperature during 12 h in order to ensure good diffusion of the cobalt and molybdenum precursors into the alumina pores. Then a drying step at 120 °C overnight in a static air oven was carried out to obtain the dried Mo/Al2O3 and CoMo/Al2O3 oxidic catalysts.
These as-prepared dried catalysts are characterised by Raman spectroscopy in the 450–1200 cm−1 range with a KOSI (Kaiser Optical Systems Incorporation) RXN1 spectrometer using a 785 nm laser diode as the excitation source coupled to an optical microscope (×10 magnification). In order to check the stability of samples under irradiation, spectra were first collected with a low laser power (∼1.7 mW) and short integration time (10 spectra × 10 s), then with progressively increased power up to 7 mW and total integration time up to 900 s in order to improve the signal-to-noise (S/N) ratio without affecting the line positions and intensities. Several positions over the surface of the catalysts, called Positions of Interest (POIs), were measured in order to check the homogeneity of the species dispersed on the surface of the support. The spectra acquisition consisted of several accumulations of 900s each at a resolution of 2 cm−1.
3 In situ measurements
3.1 In situ treatment
Both dried Mo and CoMo supported catalysts were sulphided in situ during synchrotron measurement sessions. For this purpose, the powdery sample was loaded in the transmission cell available at the hard X-rays SAMBA beamline (Fig. 1). Technical details of the cell are presented in 3.3 of a previous work [1c].
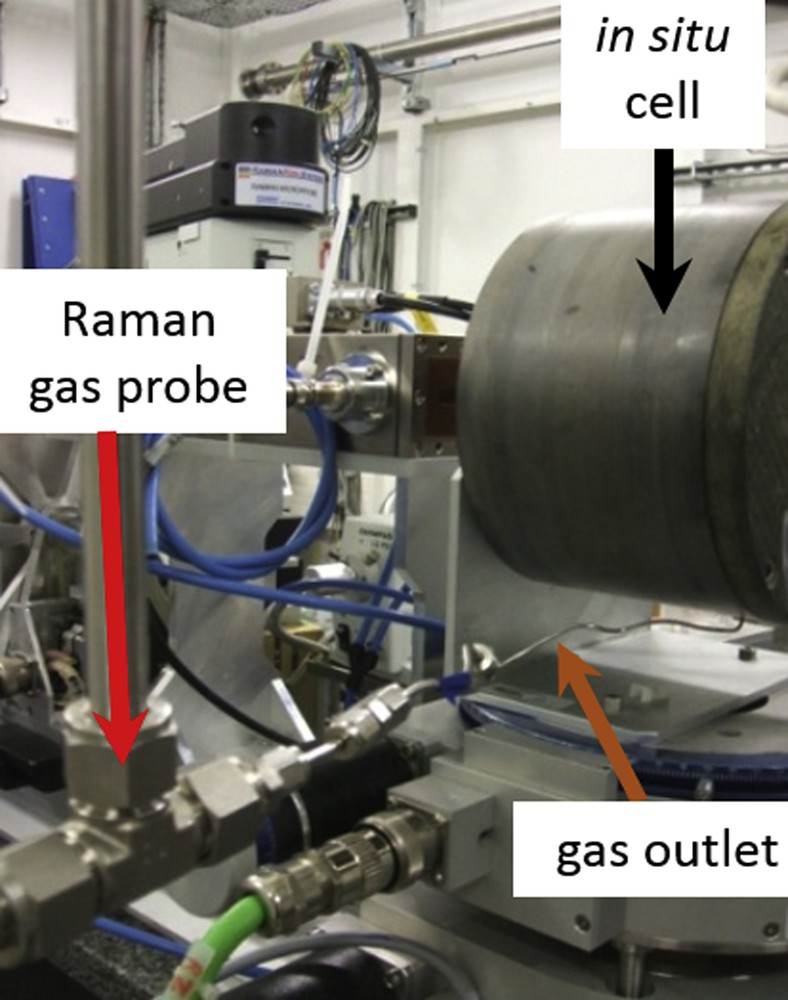
Picture of the in situ cell with a Raman gas probe installed at the cell outlet.
When Mo and Co K edges are investigated on the same sample, a compromise has to be done concerning the sample absorption at both edges. To achieve the desired sample absorption the cavity of the sample holder was filled with 90 mg of the powdery catalyst premixed with about 220 mg of diamond powder. We obtained an edge jump around 0.3 at the Mo K edge and an edge jump around 0.5 at the Co K edge.
A thermal treatment of 2 °C/min from RT to 400 °C under a flow of a mixture of 15% of H2S into H2 at atmospheric pressure followed by a plateau of 2 h (with 3 mL/min controlled by Brooks mass flow controllers), has been used to study the sulphidation process under relevant conditions.
3.2 On-line Raman spectroscopy of gas products
The gases at the cell outlet were analysed by Raman spectroscopy before being treated by using an exhaust removal gas system equipping the beamline. A 532 nm Raman spectrometer (Kaiser Optical Systems Incorporation, KOSI RXN1 type) equipped with a Raman probe mounted at the cell outlet using Swagelok fittings was used (Fig. 1). Mainly the area of the Raman bands, characteristic of H2 located at 588 cm−1 (area between 572 and 604 cm−1) and H2S located at 2611 cm−1 (area ranged between 2599 and 2625 cm−1) (Fig. S1 in supporting information) was monitored using the Holoreact software developed by KOSI allowing to obtain the profile of those reactants during the whole in situ treatment.
3.3 XAS measurements
First, data of the fresh oxidic dried catalysts were collected. Then the samples were sulphided in situ during the data collection. XAS spectra were acquired in transmission mode with three Ohken ionisation chambers (IC) as X-rays detectors. During the experiment, the ICs were filled with argon for measurements at the Mo K edge and with nitrogen for those at the Co K edge. The Mo K edge XAS spectra were acquired with a Si311 channel-cut crystal tuned to a Bragg angle of 10.8° and a crystal oscillation amplitude of around 0.7° was chosen to acquire an entire EXAFS (Extended X-ray Absorption Fine Structure) spectrum. For the Co K edge measurements, the Si111 channel-cut crystal was tuned to a Bragg angle of 13.4° and a crystal oscillation amplitude of 2.2° was used. For each edge, a frequency of 1 Hz was selected for the crystal oscillation allowing the measurement of two spectra each second (one with increasing energies, the other one with decreasing energies). The collimating and focussing cylindrically bent Pd coated mirrors were aligned with a grazing incidence of 3.1 mrad at both edges.
Both Co and Mo edges of the bimetallic catalyst were alternatively characterised during the same in situ treatment thanks to the edge jumping capability [2] of the SAMBA beamline [3]. The sequence of acquisition used in this work is presented in Fig. 2.
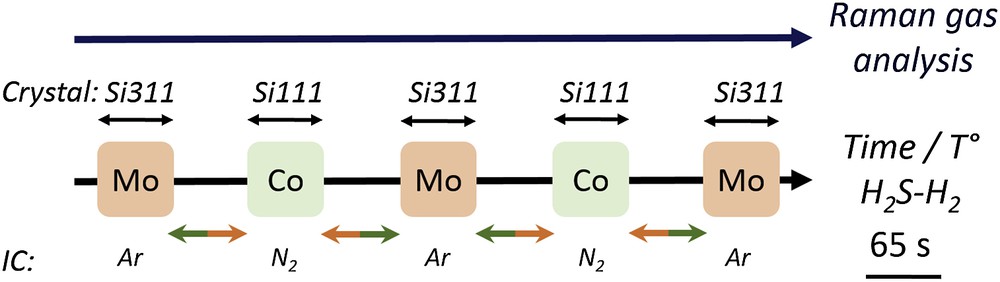
XAS data acquisition sequence switching between Mo and Co K edges with simultaneous Raman gas analysis. The coloured arrows mark the time required for edge jump (changing the monochromator, reference metallic foil, amplifier gains and gases filling the ICs).
Si111 and Si311 channel-cut crystals were alternatively used (every 65 s) as monochromator for the Co and Mo K edges. Thus the temperature difference between Co and Mo successive measurements was about 4 °C (heating rate at 2 °C/min). Consecutive spectra saved during 1 min at each edge were merged to improve the S/N ratio. Thanks to the beamline automation, the amplifier gains and the gaseous content of the ICs were changed while the monochromator setup was changed.
4 Methodology of time-resolved XAS analysis to reveal intermediate species
4.1 XAS analysis
Analysis of the XAS data was performed by using the Athena graphical interface program [8]. The energy was calibrated to the first inflection point of a Co or Mo metal foil defined at 7709 eV and 20003.9 eV, respectively. Then X-ray Absorption Near Edge Structure (XANES) spectra were background corrected and normalised using the flattening algorithm used by Athena [8]. EXAFS oscillations were extracted using the AUTOBK algorithm with a cutoff of Rbkg = 1.0 and k-weight = 3 before Fourier transformation using a k3-weighting Kaiser window with a dk = 2 apodization window. It is noteworthy that Fourier transforms presented herein in the figures are not phase corrected. Then the distances of the main FT contributions which are discussed in the text are shifted compared to the real crystallographic distances. Fits of EXAFS spectra were performed by using the Artemis graphical interface program [8]. Quick-XAS spectra of standard references prepared as pellets were recorded at room temperature (RT) at both edges in order to check the transferability of the ab initio phase and amplitude functions calculated by the FeFF6 code [9]. Structural parameters R (average atomic distance from the absorbing atom), N (coordination number) and σ (Debye–Waller factor) were determined by least-square fitting procedures using a multiple k-weight data procedure. The goodness of fit is given by the minimum value of the statistical χ2 metric parameter and of the reduced quality factor defined as the ratio of χ2 over υ where υ = Nind − Nvar with Nind being the number of free parameters allowed to vary in a fit and Nvar being the number of variables used in the model (as defined by the IXS standards and criteria committee and available at http://ixs.iit.edu/subcommittee_reports/sc/err-rep.pdf). The parameter obtained for each fit and the RF-factor, which measures the relative misfit with respect to the experimental data, are reported in the tables.
4.2 Quantification of the number of intermediate species and identification by chemometric methods
During the sulphidation process, complex chemical transformations involving several intermediate species occur. The determination of the number of those intermediate species cannot be easily done by visualising the XAS spectra alone. Even if the observation of isosbestic points is a good tool to estimate the number of intermediate species and their existence domain upon time (or temperature changes), this by-eye inspection does not guarantee the purity of the observed pivotal spectra. Furthermore, the co-existence of several intermediate species often precludes them for being distinguished due to the presence of several sets of isosbestic points. Actually, as used in several recent time-resolved XAS studies [7,10] more sophisticated multivariate methods based on linear algebra could be used to estimate the number of components in a mixture of unknowns involved in a reaction. One can also extract their pure spectra and provide a quantitative concentration profile for each component. The key ideas of those methods are to represent the original data matrix D containing the q spectra recorded along the reaction with a k number of energy points by the sum of a product of two matrices C and ST characterised for each matrix in one direction by a smaller n dimensionality than q and of a residual matrix E containing the experimental noise, as schematised in Fig. 3.
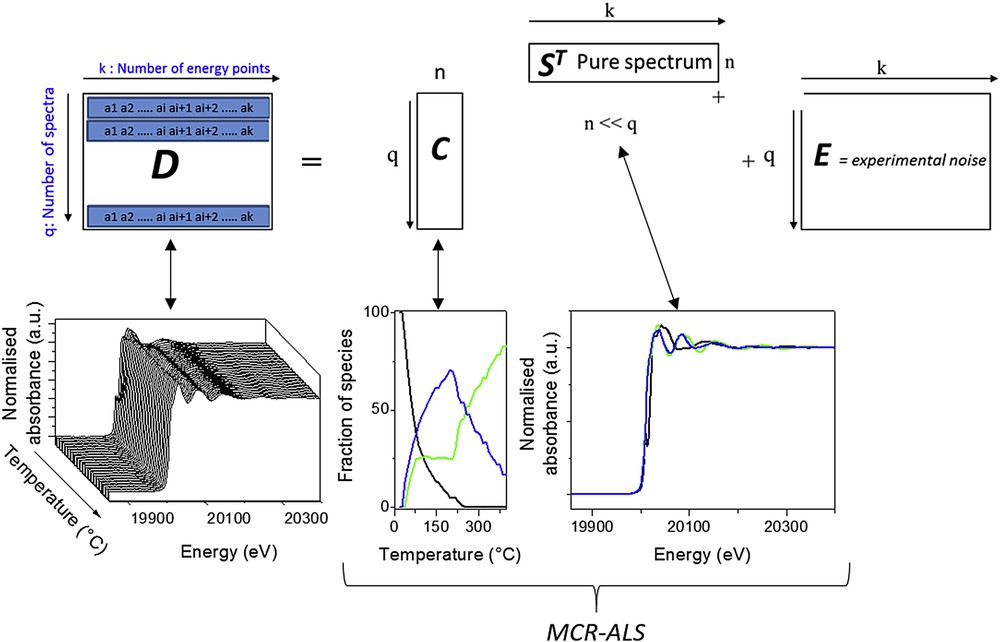
Schematic representation of the multivariate curve resolution analysis of the time-resolved experimental XAS data D. In the MCR-ALS method C and ST are the concentration matrix of the pure species and the pure XAS spectra matrix, respectively. In the PCA analysis, C is the column matrix corresponding to the weight of each principal component described in the row matrix ST.
In the Principal Component Analysis (PCA) approach, the row-vectors corresponding to the absorbance of the set of data are represented mathematically as a linear sum of a minimum set of uncorrelated row-vectors ST called principal components weighted by the proportion of this component loaded in the column vector C. Such a PCA analysis is possible if the number of spectra is larger than the number of components. Every component makes a maximum contribution to the sum of the variances of the variable under the constraint that each component is orthogonal to the preceding components. Each orthogonal PCA component is associated with an eigenvalue which is used to sort the components by the amount of variance explained. Thus, PCA allows the reduction of a large set of data to a controllable set of spectra. It is noteworthy that the set of PCA components so-determined are not spectra of chemical species. The identification of chemical species involved in the D matrix dataset can be achieved through the so-called target transformation method as explained in [11]. This requires that the XAS spectrum of the chemical species submitted to the target transformation test has already been experimentally measured.
The so-called Multivariate Curve Regression-Alternating Least Square (MCR-ALS) iterative method will provide a meaningful estimation of C and ST in which those matrices take a chemical signification: for the ith column vector of C the profile of concentration of the ith chemical species is described by its pure spectrum represented by the ith row-vector of ST. Such decomposition into meaningful matrices is in the case of absorption spectroscopy a transcription of the Beer–Lambert law that XAS spectroscopy obeys. The convergence of the MCR-ALS algorithm towards C and ST matrices is greatly helped by the use of physically meaningful constraints such as the non-negativity of both the concentration and absorbance spectrum and the closure and/or unimodality of concentrations. It means that the sum of concentrations (proportion of species) is equal to the total concentration of the absorbing atom (100%) and that only one maximum can describe the concentration profiles of the species. The number n of components which has to be used as the starting guess of the iterative fitting has to be determined before starting the regression, using for instance PCA. The MCR-ALS methodology applied to XAS can be found in more detail in [7] and [12].
The use of those chemometric methods for the determination of speciation (concentration profiles and pure spectra) by Quick-XAS upon monitoring of the reaction is nowadays the indispensable method to handle the huge amount of data that a Quick-XAS beamline delivers for several hours of kinetics. It's the reason why we note a remarkable increase of recent publications using such methods in different scientific fields as energy storage, catalysis, materials and environmental sciences [7,10,12,13]. Both methods will be herein illustrated with the Mo speciation of the Mo/Al2O3 and bimetallic CoMo/Al2O3 catalysts. We used the Singular Value Decomposition available on the Matlab® platform (R2011b) to carry out PCA of the normalised Quick-XAS spectra at the Mo K edge. This allows us to determine the minimal number of components [14] required to satisfactorily reproduce the set of experimental Mo K edge XAS data. We also performed PCA on the first derivative of the Quick-XAS data. No PCA has been used for the Co K edge data since no evidence of intermediate species has been observed. The MCR-ALS fitting on the Quick-XAS data was carried out using the als2004 toolbox developed by Roma Tauler and his group [15] on the Matlab® platform.
The first six PCA components obtained for the CoMo/Al2O3 catalyst are presented as example in Fig. 4. The distinction between the components describing the dataset and those which are related to experimental noise can be done using the so-called scree plot which displays the successive eigenvalues ordered by diminishing the value against the number of the corresponding component. A break in the slope of this scree plot is usually ascribed as the minimum number of components to consider in the system. Such scree plots obtained on the XAS dataset and their corresponding derivatives are represented in Fig. 5 for both catalysts considering the first 10 components. The log-scale representation of the eigenvalues extracted from the PCA is sometimes more convenient than the traditional linear scree plot to better visualise the first break slope with the variation of eigenvalues as a function of component numbers. Then, in Fig. 5, the scree plot obtained from PCA performed on the XAS data is presented on a log scale (left) whereas the one obtained with the PCA on derivatives is presented with a linear scale (right). Both representations of the XAS and derivative datasets lead to the same conclusion with a break slope occurring at the third and fourth components for the CoMo/Al2O3 catalyst and Mo/Al2O3 catalyst, respectively. Corresponding cumulative explained variances considering the increasing number of components are specified for the first components obtained with the PCA on derivatives. The variance information extracted from the analysis of the derivatives appears more discriminating than the one reported for the PCA analysis of XAS. This behaviour results from the peculiar shape of normalised XAS data. The first PCA component is essentially the average of all the sample data and then leads to more than 99% of explained variance. The other PCA components account for the small fluctuations between the experimental spectra (as shown in Fig. 4). At the opposite, the derivative spectra with positive and negative peaks moving towards the energy position depending on the species oxidation state lead to PCA components with marked increase of explained variance when considering successive PCA. For instance, for the Mo/Al2O3 catalyst, the first component obtained from derivative analysis explains 80.47% of variance, the second explains some more, 15.50% and the two other components 1.28 and 0.18%, respectively. The fifth component and the next ones allow for explaining only 0.07% and less than 0.06% of additional variance which becomes significantly too small to be considered as correlated in the information contained in the D matrix and should remain in the E matrix corresponding to the noise (see Fig. 3).
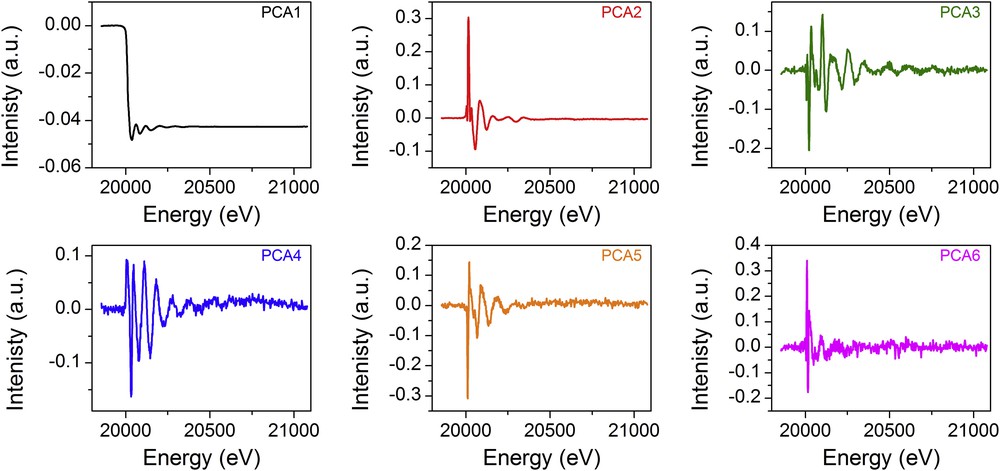
Plot of the first six PCA components obtained during the study of the sulphidation process of the bimetallic dried CoMo/Al2O3 catalyst. The respective eigenvalue of each component is: 148.232 for PCA1, 3.012 or PCA2, 0.301 for PCA3, 0.250 for PCA4, 0.209 for PCA5 and 0.105 for PCA6.
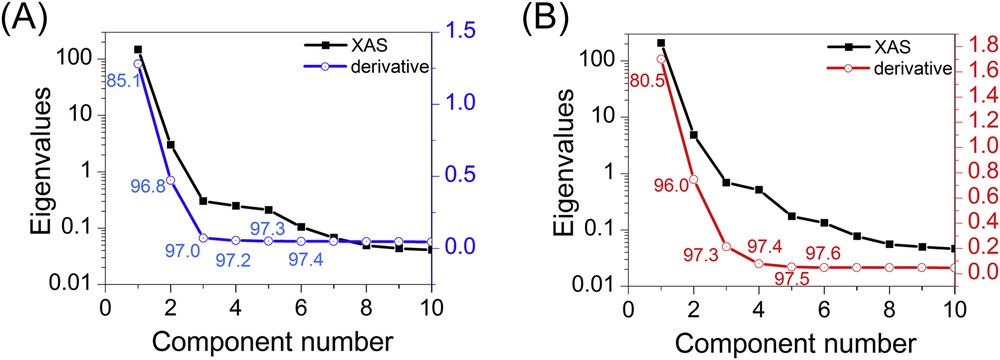
Scree plot of the eigenvalues obtained by PCA of the Mo K edge data for the bimetallic CoMo (A) and monometallic Mo (B) supported catalysts. The eigenvalues are presented with a linear scale (right scale) for the PCA performed on the derivatives spectra and with a log scale (left scale) for the XAS data. Corresponding cumulative explained variances considering the increasing number of components are specified for the first components obtained with the PCA on derivatives.
The respective rank orders obtained by PCA analysis are then used for the MCR-ALS analysis of datasets related to both catalysts. For minimisation, the used constraints were the non-negativity of both absorption and concentration, the closure condition for the concentrations and the unimodality for the concentrations during the entire sulphidation process.
5 Results and discussion
5.1 Structure of the oxidic dried catalysts
Both dried oxidic catalysts were at first characterised as-prepared before any treatment. Fig. 6 compares the Raman data recorded for the as-prepared dried catalysts. For the monometallic Mo/Al2O3 catalyst, only the data recorded in the 750–1050 cm−1 are presented because a strong fluorescence background measured for this sample below 700 cm−1 hinders the resolving of lines with small intensity (inset in Fig. 6(A)). The 800–1000 cm−1 Raman shift range is informative on the oxygen-molybdenum stretching vibrations of polyoxomolybdates. Whatever the Positions of Interest (POIs) investigated for the Mo/Al2O3 catalyst, a broad band is obtained with the emergence of defined peaks at 944, 902, 878 cm−1 and a shoulder at 850 cm−1. This peculiar shape suggests the overlapping of broad lines, characteristic of different molybdenum based species.
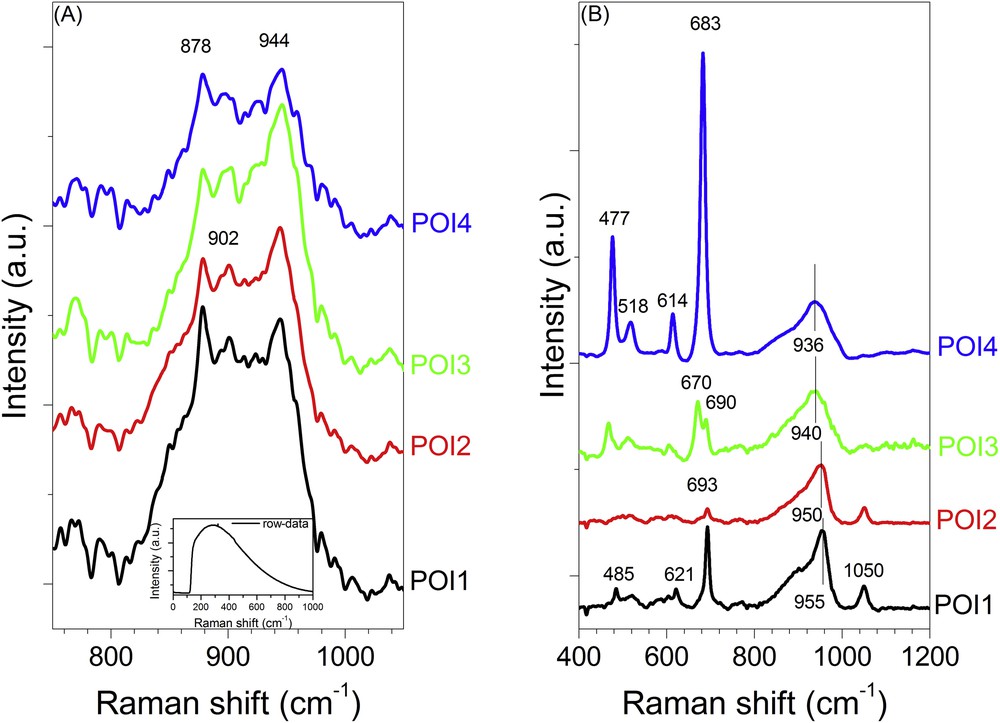
Raman spectra of the oxidic monometallic Mo/Al2O3 (A) and bimetallic CoMo/Al2O3 (B) catalysts at different Positions of Interest.
At the opposite, the spectra recorded for the bimetallic CoMo/Al2O3 catalyst at different POIs display well-defined lines in the Raman shift below 700 cm−1 and well-shaped lines in the 800–1000 cm−1 together with the characteristic symmetric stretching vibrational mode of the nitrate anions introduced with the promoter at 1050 cm−1 (Fig. 6(B)). Some of the lines below 700 cm−1 are clearly consistent with the formation of Co3O4 (lines at 693, 621 and 485 cm−1) [16] whereas the other lines at 683, 614, 518 and 477 cm−1 are assigned to the formation of amorphous CoAl2O4 spinel aluminate [17]. It is noteworthy that spectra recorded for POI3 and POI4 were recorded on a few black crystallites dispersed on the surface of the support and present before laser irradiation. The number of those black crystallites is low compared to the overall white crystallites composing the sample. We assume that the formation of those cobalt based-oxides is related to the strong oxidative and etching conditions of the preparative route used herein and based on the use of hydrogen peroxide. Partial dissolution of aluminium ions from the support and partial oxidation of Co2+ ions occur leading to these mild conditions and after drying at 110 °C to nucleation and growth of a few black crystallites [18].
On both catalysts, but mainly on the Mo/Al2O3 one, the lines at 944, 900 cm−1 and the tail toward 850 cm−1 could be ascribed to the presence of heptamolybdate and molybdate species in interaction with the support [19].
The well-shaped lines with intensity maximum moving from 936 to 955 cm−1 clearly observed on the CoMo/Al2O3 catalysts are the characteristic fingerprints of different polyoxomolybdate species dispersed on the surface of the support. The presence of the intense line at 950–955 cm−1 with a shoulder at 902 cm−1 (POI1 and POI2) could be tentatively ascribed to the precipitation of the 6-molybdoaluminate Anderson-type heteropolyanion (AlMo6O24H6)3- (also referred to as AlMo6) [20]. The lines peaking at lower Raman shift positions (936–940 cm−1) could have resulted from the precipitation of heptamolybdate species [20]. These findings point out that in agreement with the previous observations reported in the literature [21], CoMo/Al2O3 catalysts are complex materials with dispersion of various cobalt and molybdenum-based species.
The Mo K edge XANES, EXAFS spectra and corresponding Fourier transforms (FT) of the dried catalysts are compared in Fig. 7 to those of selected references such as AlMo6 (with ammonium as the counter-anion), AHM (ammonium heptamolybdate (NH4)6[Mo7O24]) and the dimeric molybdate compound (NH4)2[Mo2O7]. For all the samples, an intense pre-edge peak on the XANES data is observed (Fig. 7A). It arises from transition from 1s towards molecular orbitals in which 4d Mo orbitals are hybridised with p Mo orbitals due to the presence of a non-centrosymmetric environment for Mo [22]. The less the environment is centrosymmetric, the more intense is the pre-edge peak, as clearly observed by comparing the pre-edge feature of the corner sharing tetrahedra of the dimeric (NH4)2[Mo2O7] molybdate reference and those of the more centrosymmetric AHM or AlMo6 references. A quite similar shape to that of XANES spectra is observed for both catalysts with nevertheless a slight intensity increase of the pre-edge feature and bump located at 20044 eV for the Mo/Al2O3 sample compared to the CoMo/Al2O3 one. These features are related to the presence of tetrahedral molybdate species [23] in agreement with the previously discussed Raman results.
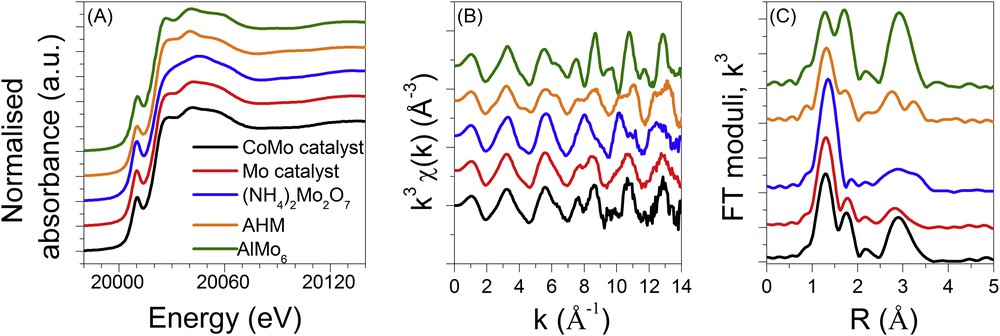
Mo K edge XANES (A) and EXAFS spectra (B) and corresponding Fourier transform moduli (C) at RT of the oxidic bimetallic CoMo (black) and monometallic Mo (red) supported catalysts compared to reference samples.
Both Mo/Al2O3 and CoMo/Al2O3 catalyst EXAFS data and their corresponding FT display significant differences (Fig. 7(B) and (C)). It is important to note that the in-phase shape of the EXAFS oscillations and corresponding FT of the CoMo/Al2O3 catalyst and AlMo6 reference are in agreement with the presence of the Anderson-type heteropolyanion (HPA) suggested by Raman. Such an observation has already been done in the case of dried NiMo catalysts supported on alumina and prepared by a similar method [24].
These qualitative descriptions for both catalysts are confirmed by the structural parameters determined by the EXAFS fits presented in Table 1 (and Fig. S2 in supporting information). A large distribution of Mo–O distances are found in the first coordination shell in agreement with a non-centrosymmetric environment for Mo whereas the presence of a Mo–Al contribution at 3.40 (0.05) Å for fitting the catalysts is in good agreement with the dispersion of the AlMo6 at the surface of alumina. It is noteworthy that the presence of a Mo–Al path contribution at 2.65 (0.05) Å is required to get the best fit for both catalysts. Such a contribution might be due to interactions between the support and Mo species, as already noted for dried NiMo catalysts supported on alumina [24].
Parameters obtained from the fit of the Mo K edge EXAFS spectra of the oxidic bimetallic CoMo and monometallic Mo supported dried catalysts at the Mo K edge (Δk = 3.5–12.5 Å−1, S02 = 0.96, E0 + ΔE = 20019.4 eV).
| Backscatterer | N | R (Å) | σ2 (Å2) × 10−3 | R-factor | |
| Fresh dried CoMo (RT) | |||||
| O | 3.1 ± 0.8 | 1.74 ± 0.01 | |||
| O | 1.7 ± 0.7 | 1.96 ± 0.03 | |||
| O | 0.5 ± 0.6 | 2.29 ± 0.07 | |||
| Al | 0.5 ± 0.3 | 2.65 ± 0.05 | 3.6 ± 2.0 | 0.0031 | 76 |
| Mo | 0.6 ± 0.6 | 3.34 ± 0.04 | |||
| Al | 1.2 ± 0.8 | 3.39 ± 0.06 | |||
| Fresh dried Mo (RT) | |||||
| O | 3.4 ± 0.5 | 1.75 ± 0.01 | |||
| O | 1.5 ± 0.4 | 1.97 ± 0.02 | |||
| O | 0.3 ± 0.4 | 2.26 ± 0.06 | |||
| Al | 0.6 ± 0.2 | 2.65 ± 0.05 | 4.6 ± 2.0 | 0.0021 | 66 |
| Mo | 0.3 ± 0.4 | 3.31 ± 0.08 | |||
| Al | 1.1 ± 0.4 | 3.38 ± 0.03 |
Due to the strong differences in the shape of EXAFS oscillations of both catalysts and references (Fig. 7B), we tentatively fit by least square minimisation the EXAFS spectra of catalysts using linear combination fittings (LCF) of reference EXAFS data. Even if such linear combinations must be taken with care due to the fact that we are building EXAFS spectra of dispersed species in interaction with the support with those of bulk ones; the results give insights into the mixtures of molybdenum species on the surface of the support.
Table 2 gathers the results of the linear combinations presented in Fig. 8. The striking conclusion is the dominant presence of AlMo6 HPA and molybdate-based species in the CoMo/Al2O3 catalyst and the Mo/Al2O3 catalyst, respectively. It is noteworthy that such proportions are in agreement with the Raman discussion aforementioned.
Results of the linear combination fittings of Mo K edge EXAFS spectra of the oxidic bimetallic CoMo and monometallic Mo supported dried catalysts.
| Sample | AlMo6 | (NH4)2[Mo2O7] | AHM | R-factor | |
| CoMo catalyst | 58.7% | 26.6% | 14.7% | 0.08346 | 0.31251 |
| Mo catalyst | 35.8% | 47.2% | 17.0% | 0.02851 | 0.08799 |
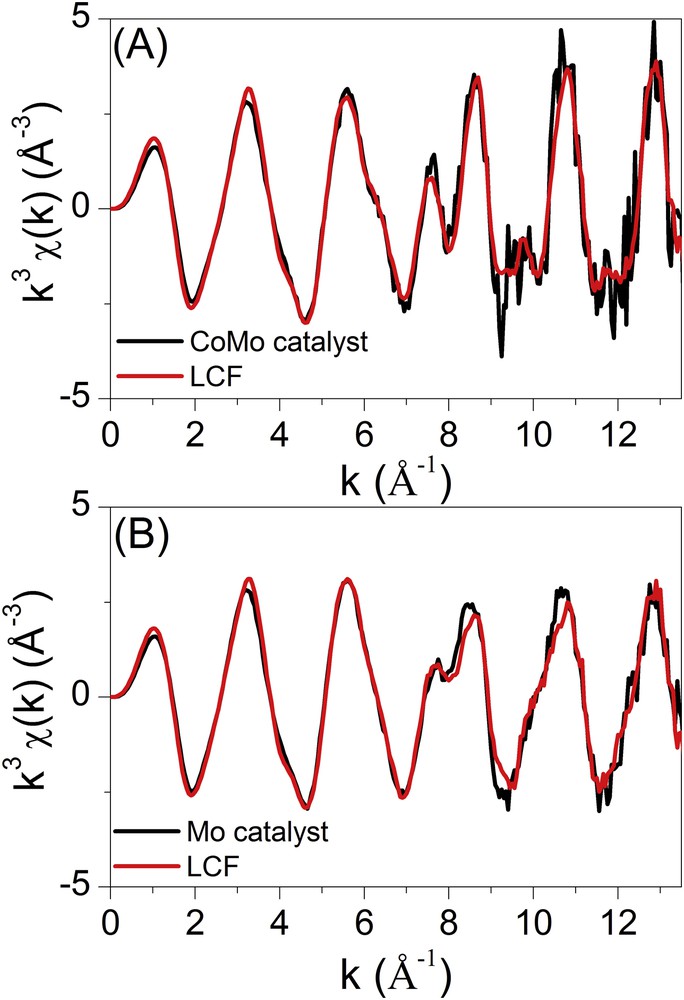
Linear combination fittings of the Mo K edge EXAFS spectra recorded for the oxidic bimetallic CoMo (A) and monometallic Mo (B) supported catalysts.
The data measured at the Co K edge of the CoMo bimetallic supported catalyst are presented in Fig. 9 and are compared to the ones of the Co3O4 and Co(NO3)2·6H2O references. The shape of the XANES spectrum of the CoMo sample is close to that of the cobalt nitrate but not perfectly stackable suggesting that the local order around Co in the catalyst is different from the one characterising the solid Co(NO3)2·6H2O reference. On Fourier transform, the CoMo/Al2O3 catalyst presents only one main contribution around 1.5 Å. It corresponds to well dispersed oxidic Co species on the surface of the alumina support. The characteristic shape of the white line and its position in energy suggest the presence of octahedral divalent oxo-hydroxo cobalt species that is confirmed by the EXAFS fitting results with 6.1 (1.3) oxygen neighbours at 2.05 (0.05) Å (RF = 0.0183, = 219). The presence of Co3O4 or CoAl2O4 pointed out by its characteristic Raman lines for some of the POIs on the bimetallic sample (Fig. 6) is not confirmed by the XAS results. On one hand, as already mentioned, the black crystallites ascribed to the formation of cobalt based-oxides are small in number and then are not representative of the main part of the samples; on the other hand, as Co3O4 is a strong Raman backscatter, it can give a strong Raman signal for concentrations which are not detectable by XAS data measured in transmission mode.
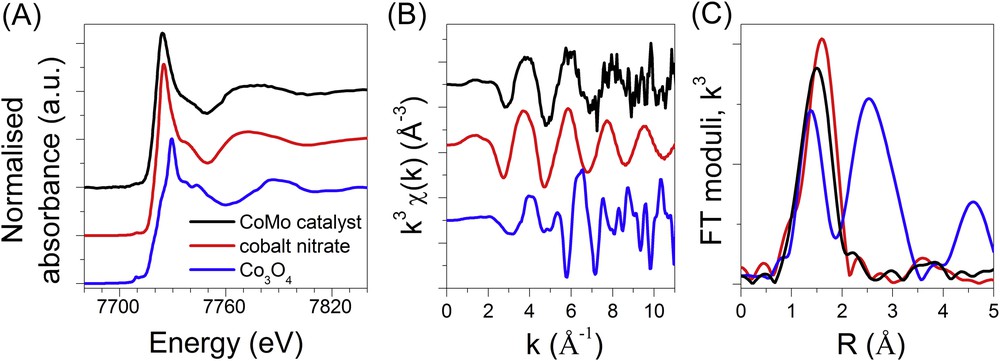
Co K edge XANES (A), EXAFS spectra (B) and corresponding Fourier transform moduli (C) at RT of the oxidic bimetallic CoMo supported catalyst compared to reference samples. The EXAFS and FT signals of the Co3O4 reference are multiplied with a factor of 0.5 for the sake of clarity.
5.2 Identification of species involved during sulphidation of oxidic dried catalysts
The monitoring of the sulphidation process for both dried Mo/Al2O3 and CoMo/Al2O3 samples is presented in Fig. 10. Fig. 10(A) and (B) correspond to the data measured at the Mo K edge of the respective catalysts whereas Fig. 10(C) displays the data measured at the Co K edge of the bimetallic catalyst. While the first spectrum (black) is of the fresh sample, the others are obtained during the increasing time (i.e. increasing temperature) upon treatment under H2S/H2. During the plateau at 400 °C, the shape of the Mo K edge XAS spectra of both catalysts is similar to the spectrum of MoS2. Since for the bimetallic catalyst the XAS measurements have been done with the edge jumping mode, less spectra at the Mo K edge have been recorded compared to the ones of the pure Mo sample. For both catalysts, the change in the shape of the Mo K edge XANES spectra with the disappearance of the pre-edge feature and the shift at lower energy of the rising edge are characteristic of an exchange of oxygen ligands by sulphur ones accompanied by a reduction of the Mo oxidation state.
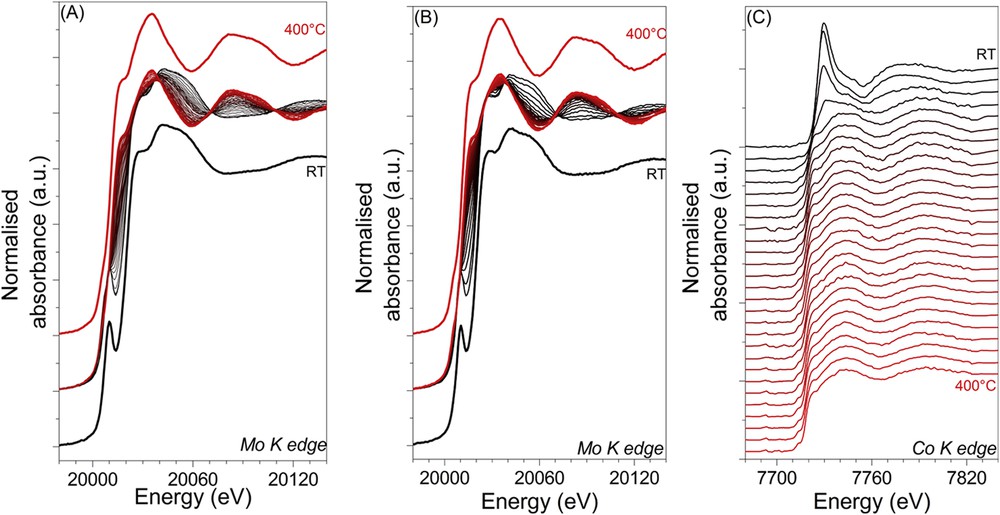
In situ monitoring of the sulphidation by Quick-XAS at the Mo K edge of the monometallic Mo/Al2O3 catalyst (A) and at the Mo K edge (B) and Co K edge (C) of the bimetallic CoMo/Al2O3 catalyst.
The Co K edge XANES spectra present a decrease of the white line intensity with increasing temperature (Fig. 10(C)). At the end of the sulphiding treatment, the white line totally disappears, as already observed in other studies for sulphided cobalt species [25].
The moduli of the Mo K edge Fourier transforms obtained during the sulphidation process are presented in Fig. 11 for the bimetallic and monometallic catalysts.
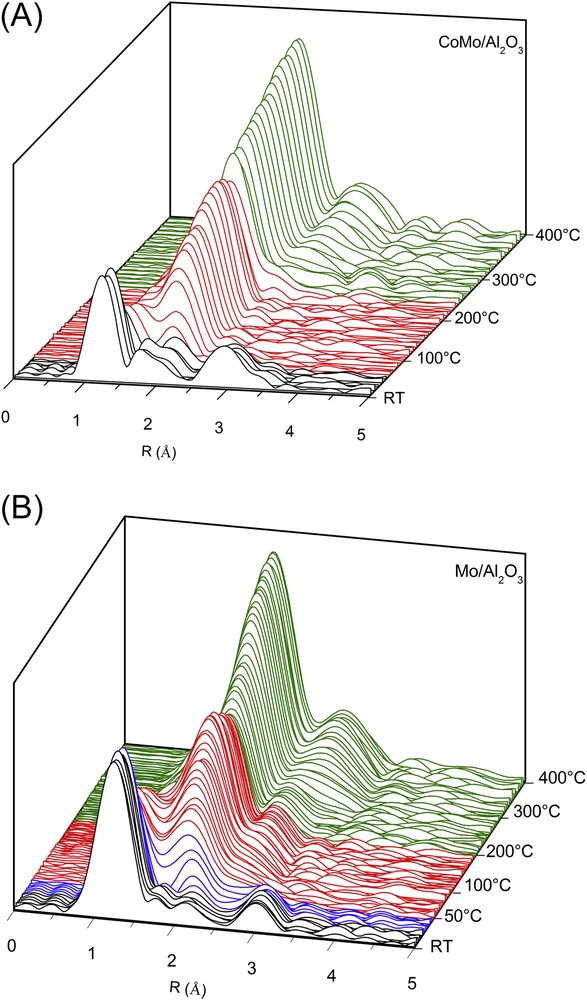
In situ monitoring of the sulphidation by Quick-XAS at the Mo K edge of the bimetallic CoMo/Al2O3 catalyst (A) and the monometallic Mo/Al2O3 catalyst (B): Fourier transform moduli.
The effect of the sulphidation on the bimetallic catalyst (Fig. 11A) is observed around 75 °C when the signal centred around 1.2 Å disappears and a contribution around 1.9 Å appears. This new signal has already been observed by Nicosia et al. [25] and has been attributed to the Mo–S contribution of a MoS3-like species. The shoulder around 2.4 Å could be attributed to the Mo–Mo contribution as observed in other studies [25] and [26]. It is noteworthy that the intensity of this contribution centred around 1.9 Å increases with the temperature. At 237 °C, the Mo–S contribution is shifted toward lower distances (centred on 1.8 Å) and just after this fast change, a new contribution around 2.8 Å appears. Those contributions are attributed to Mo–S and Mo–Mo signals of MoS2, respectively. The amplitude of the Mo–S and Mo–Mo contributions increases with increasing temperature, showing the growth of the MoS2 crystallites (Fig. 11(A)). Thus for the bimetallic CoMo catalyst, as already observed in other studies [25], the sulphidation of the molybdenum species seems to be composed of three stages, roughly marked on the Fourier transforms by the different colours.
For the monometallic catalyst (Fig. 11B), the molybdenum environment is affected by the sulphiding treatment at lower temperature (∼35 °C) compared to the bimetallic sample. Besides the broad contribution corresponding to the first oxygen coordination shell, a new contribution located around 2.1 Å can be observed at temperature below 50 °C. Between 50 and 200 °C, one can see a strong contribution centred at 2.0 Å. The intensity of this contribution increases up to 111 °C while the Mo–O signal disappears. While the temperature keeps increasing, the intensity of this contribution located at 2.0 Å decreases and the peak continuously shifts towards lower distances up to 1.8 Å. Then this distance value remains constant until the end of the treatment. It corresponds, as for the bimetallic CoMo/Al2O3 catalyst, to the distance of the first coordination shell in the MoS2 crystallites. Simultaneously a contribution around 2.8 Å, attributed to Mo–Mo signals of MoS2 appears. As observed for the bimetallic catalyst, the amplitude of the Mo–S and Mo–Mo contributions get stronger with increasing temperature, showing again the growth of the MoS2 crystallites during the last period of the heating ramp. Thus for the monometallic Mo catalyst, the sulphidation process seems to be composed of four stages contrary to the three ones previously observed for the bimetallic sample.
The structure of the pivotal species involved in the 3 or 4 stages characterising the sulphidation of the bimetallic and monometallic catalysts was then analysed in-depth, thanks to the MCR-ALS method applied to the respective dataset. It is noteworthy that the optimal number of PCA components allowed to describe the time-resolved dataset collected during sulphidation and discussed previously in the experimental section is equal to the number of distinct stages evidenced by the qualitative analysis of the Fourier transform changes.
According to the matrix rank previously determined by PCA, the MCR-ALS minimisation of the CoMo/Al2O3 catalyst was done with three components. The obtained spectra corresponding to these pure components are presented in Fig. 12 and named hereafter MoCo-comp.1, MoCo-comp.2 and MoCo-comp.3. For the monometallic Mo/Al2O3 catalyst, the matrix rank for the MCR-ALS was set to 4 and the four identified species, named hereafter Mo-comp.1, Mo-comp.2, Mo-comp.3 and Mo-comp.4, are presented in Fig. 13.
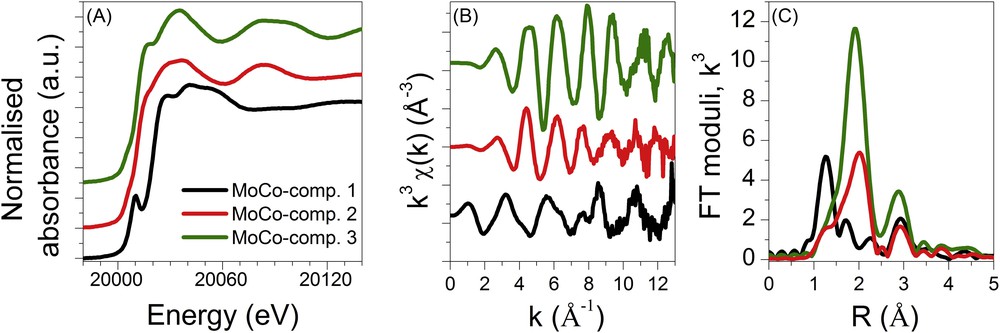
Mo K edge XANES (A) and EXAFS spectra (B) and corresponding Fourier transform moduli (C) of the intermediate species determined by MCR-ALS for the bimetallic CoMo supported catalyst.
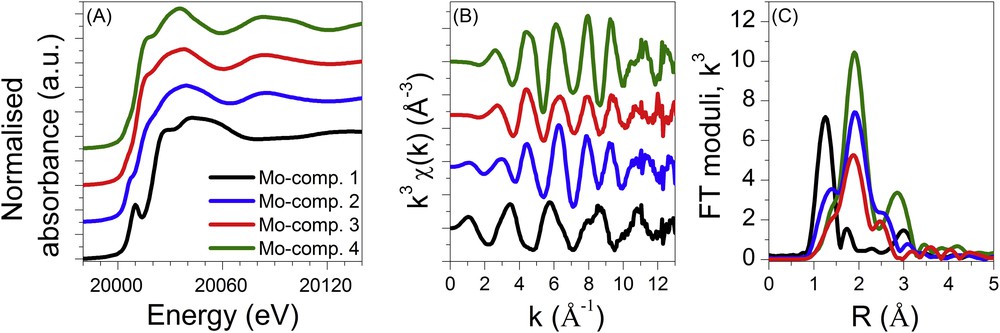
Mo K edge XANES (A) and EXAFS spectra (B) and corresponding Fourier transform moduli (C) of the intermediate species determined by MCR-ALS for the monometallic Mo supported catalyst.
The spectra of the first (MoCo-comp.1 and Mo-comp.1) and last components (MoCo-comp.3 and Mo-comp.4) determined by MCR-ALS each catalyst are superimposable to the respective oxidic catalysts and fully sulphided catalysts (as presented in supporting information, Fig. S3). It is noteworthy that the oxidic catalysts have been identified as a mixture of HPA and molybdate-based species. However the chemometric methods used herein identify only one component for this initial state. This strongly suggests that the initial phases are concurrently transformed in the same manner.
The XANES spectra obtained for the MoCo-comp.2 species and for the Mo-comp.3 species do not display the pre-edge feature characteristic of oxidic species presenting a non-centrosymmetrical environment around Mo. This feature suggests that those species are fully sulphided species. Actually the spectrum of MoCo-comp.2 is similar to the one published in [27] for the amorphous MoS3 compound whereas the faintly marked shoulder at the top of the rising edge observed for the Mo-comp.3 seems to be a fingerprint of the MoS6 phase [27] prepared from oxidation by iodine of a solution of ammonium thiodimolybdate ((NH4)2Mo2S12) [28]. The structure of the later phase is similar to that of MoS3 but containing more abundant S–S bonds [28]. The XANES spectrum of the Mo-comp.2 species is at the opposite characterised by a pre-edge feature shifted by ∼1.8 eV to lower energies compared to that of the first component Mo-comp.1 (as emphasized in supporting information, Fig. S4) suggesting the formation of oxysulphide molybdenum-based species [29]. As a matter of fact, Mo K edge spectra of some molybdenum sulphite oxidase species recently reported in the literature [30] display XANES and EXAFS features similar to the one reported for Mo-comp.2 in which the terminal oxo ligand and disulphide ligand are bonded to Mo at 1.7 Å and 2.4 Å, respectively.
The MCR-ALS determination of the spectra of pure species over the full collected energy range of the experiment allows us to treat them as a conventional absorption spectrum and then extract their EXAFS spectra and corresponding Fourier transforms as we did with raw experimental data. The EXAFS spectra obtained from MCR-ALS and corresponding FT of both catalysts are presented in Fig. 12(B,C) and Fig. 13(B,C).
Results of the least square fittings of the EXAFS spectra for Mo-comp.3 and MoCo-comp.2 are presented in Table 3 and supporting information (Figs. S5 and S6).
Parameters obtained from the fit of the Mo K edge EXAFS spectra determined by MCR-ALS for the pure intermediate species involved during sulphidation of both mono- and bimetallic supported catalysts (Δk = 3.5–12.2 Å−1 for Mo-comp.2 and Δk = 2.3–10.0 Å−1 for Mo-comp.3 and MoCo-comp.2, S02 = 0.96, E0 = 20012.2 ± 1.2 eV).
| Backscatterer | N | R (Å) | σ2 (Å2) × 10−3 | R-factor | |
| Mo-comp.2 | |||||
| O | 1.0 ± 0.7 | 1.68 ± 0.02 | 4.4 ± 8.7 | 0.0033 | 698 |
| S | 4.0 ± 1.0 | 2.40 ± 0.01 | 6.7 ± 3.0 | ||
| Mo | 0.5 ± 0.8 | 2.86 ± 0.03 | 0.4 ± 9.0 | ||
| Mo-comp.3 | |||||
| S | 4.7 ± 0.6 | 2.39 ± 0.01 | 12.2 ± 1.9 | 0.0059 | 471 |
| Mo | 1.6 ± 0.7 | 2.79 ± 0.03 | |||
| MoCo-comp.2 | |||||
| S | 5.6 ± 0.8 | 2.46 ± 0.01 | 12.3 ± 2.3 | 0.0063 | 265 |
As suggested by the qualitative analysis of the XANES, the structural parameters determined by the least square fitting procedure for the Mo-comp.3 species fully confirm the formation of MoS3-like species at this stage of the sulphidation process with the characteristic Mo–Mo distance around 2.80 Å [28,31]. Nevertheless, as our analysis is centred on the local order around molybdenum, the distances found for the first sulphur coordination shell of Mo do not allow us to conclude on the enrichment of disulphide ligands of Mo-comp.3 compared to MoS3 as suggested by the comparison of XANES spectra reported in the literature [27].
The best fit of the MoCo-comp.2 EXAFS data is also based on a Mo–S first coordination shell at 2.46 (0.01) Å. The fitting of the contribution at longer distances is less straightforward. As expected for MoS3 a contribution of 2 Mo neighbours at 2.79 Å has been considered but does not satisfactorily reproduce the signal centred at 3 Å. Adding a refined contribution of 1 Al neighbour located around 3.41 Å, also observed on the pristine AlMo6 HPA phase, improves the fit result. However due to the out-phase shift of the Mo–Mo and Mo–Al contributions, their simultaneous refinement is not allowed. Then, we limit the description of the local order around Mo for this intermediate species to the first coordination shell (Table 3 and Fig. S6, supporting information). Hereafter those components will be represented as MoS3-like species.
Finally, as suggested by the closeness of the spectrum recorded for Mo-comp.2 and the spectra reported in the literature for sulphite oxidase of molybdenum [29], this component is satisfactorily described by a mixed O and S coordination shell at a distance of 1.68 Å and 2.41 Å, respectively, together with a Mo–Mo contribution at 2.86 Å (Table 3 and Fig. S5 in supporting information). Such Mo–Mo distances at ∼2.85 Å are commonly found in pentavalent molybdenum oxysulphides [32]. It is noteworthy that Mo–S distances at 2.40–2.45 Å are characteristic not only of sulphide bridging ligands but also of disulphide chelating ligands. Unfortunately, due to the lack of complementary information about the nature of sulphur ligands, the structure of the Mo-Comp.2 species at this stage of our study cannot be more detailed.
5.3 Evolving profile concentration of metallic species and reactants upon sulphidation
Besides the determination of the pure spectra of intermediate species involved during the sulphidation processes of both catalysts, the MCR-ALS methodology directly provides the concentration profile of those species upon reaction. The concentration profiles so-obtained are presented in Fig. 14, top and compared to the gas profile (bottom) simultaneously monitored by TPS (Temperature Programmed Sulphidation)-Raman spectroscopy.
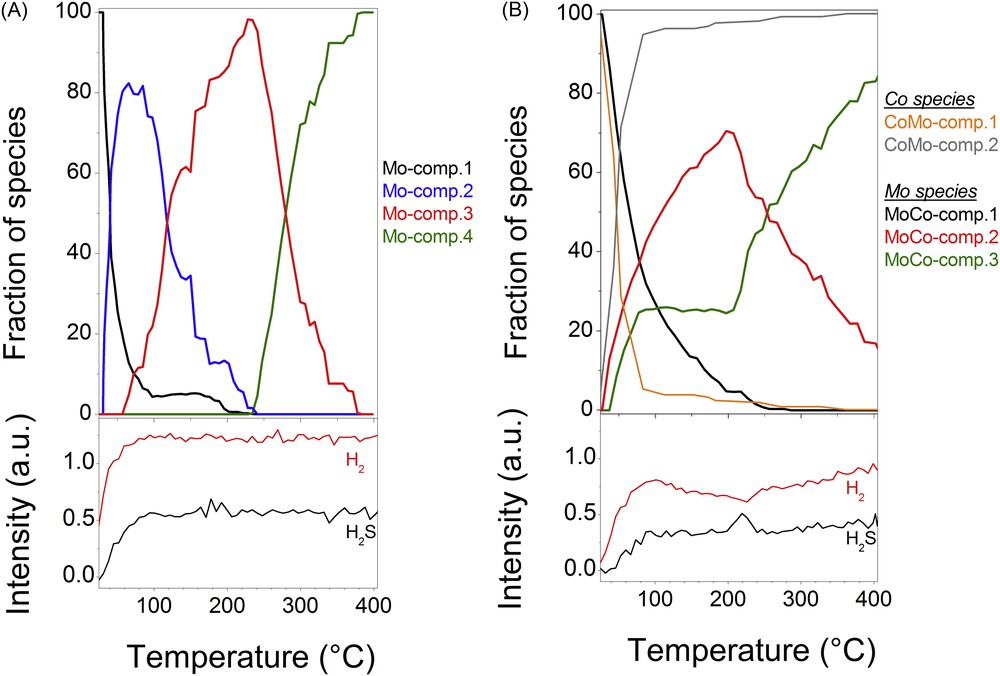
Top: Concentration profile of components determined by MCR-ALS as a function of the temperature during sulphidation of the monometallic Mo (A) and bimetallic CoMo (B) supported catalysts. Bottom: Corresponding Raman gas profiles of H2 and H2S signals obtained during the sulphidation process of both catalysts.
For the monometallic sample, the intermediate oxysulphide Mo species (Mo-comp.2) appears as soon as the temperature starts to increase (Fig. 14(A)) and its concentration reaches a maximum at ∼55 °C. At this temperature, the intermediate species (Mo-comp.3) identified as MoS6, a MoS3-like phase enriched in disulphide bonds [27,28], starts to be formed whereas a small amount of the initial oxidic catalyst (5%) is still observed and remains present up to ∼200 °C. In contrast to the fast transformation of Mo-comp.1 to Mo-comp.2, i.e. from the oxidic catalyst into the oxysulphide species, the transformation of Mo-comp.2 to Mo-comp.3 is slow with a temperature ranging from 55 °C to 230 °C. Then it is only at this temperature that the final MoS2 species appears, by transformation of MoS6 into MoS2. It is noteworthy that this last step in the sulphidation process of the Mo catalyst occurs only after the total transformation of the oxidic species into sulphided ones.
For the bimetallic catalyst, the sulphidation behaviour is different (Fig. 14(B)). Only three molybdenum-based species have been revealed by chemometric methods. The formation of the species identified as MoS3 and the final MoS2 phases starts from room temperature and around 50 °C, respectively, with a quite similar formation rate. But when the proportion of MoS3 like species (MoCo-comp.2) is still increasing above 80 °C, that of the MoS2 species (MoCo-comp.3) remains constant up to ∼200 °C. At the end of this plateau (∼200 °C), while the initial oxidic catalyst is almost vanished, the transformation of MoS3 into MoS2 occurs. For the Co species, only two species were evidenced by XAS during the monitoring of the sulphidation: the oxidic catalyst (referred to as CoMo-comp.1) and the final sulphided (CoMo-comp.2) species. Comparably as for the first transformation of the Mo-based oxidic catalyst into MoS3, the transformation of the oxidic cobalt species into the final one starts around room temperature. The transformation of the Co oxidic species (1.74%/°C) is slightly faster than that of Mo (1.43%/°C) at the early stage of the heating (T < 50 °C). It is noteworthy that about 20–25% of molybdenum and cobalt species are concomitantly sulphided between 28 and 42 °C. Then at the MoS2 formation onset, the sulphidation of cobalt and molybdenum species slows down with a conversion rate of 0.78%/°C and 0.53%/°C (for MoS3), respectively. It is worth noting that at the early stage of the formation of MoS2 (up to 77 °C), about 14–19% of molybdenum and cobalt species are also concomitantly sulphided. At 80 °C, more than 95% of sulphided cobalt and molybdenum species are present. Above this temperature the transformation of the 5 remaining per cent of cobalt species is slow with a conversion rate of 0.02%/°C. It is noteworthy that the plateau of concentration observed for cobalt species starts at the same temperature as that of the one observed for the final species MoCo-comp.3. It is recognised that the order of occurrence of formation of sulphide species is of paramount importance to lead to the formation of the CoMoS active species in which Co decorates the edges of MoS2. The sulphidation of molybdenum species, and, in particular the formation of MoS2, should be concomitant or posterior to the sulphidation of cobalt species to make possible the interaction of Mo sulphide species with Co ones. Herein, the simultaneous characterisation of sulphidation of both metals unambiguously evidences that concomitant sulphidation of Mo and its promoter occurs for about 40% of both metals. Then we can infer that a part or all of those 40% of metals leads to the formation of the active CoMoS species.
For each catalyst, the gas profile obtained by TPS-Raman spectroscopy presents the change in H2S concentration in the effluent stream of the reactor (lower black signal) and the change in the H2 signal (upper red curve). A negative peak corresponds to consumption and a positive peak corresponds to production of either H2S or H2. Before the circulation of H2S/H2 a short portion of gas lines at the cell inlet and outlet is filled with nitrogen, the change in the gas concentration observed at the lowest temperatures is partly due to a dilution effect and then does not allow to quantify any consumption or release of gases in the temperature range lower than 80 °C.
However different behaviours are observed for TPS-Raman monitoring of both catalysts. For the bimetallic supported catalyst, from ∼80 °C to ∼220 °C, a continuous consumption of H2 is observed whereas the level of H2S seems to be constant at the cell outlet. Around 220 °C, a peak due to H2S release is clearly observed with an increase of consumption of H2. After this event, both H2 and H2S concentration profiles slightly increase. At the temperature of H2S release, while the Co species is almost stable, the MoS3-like phase is transformed into the final MoS2 phase as shown in the concentration profile in Fig. 14(B). Those TPS-Raman results are well in line with those reported in the literature for TPS characterisation of supported molybdenum based catalysts [33,34]. On the one hand, the continuous consumption of H2 during the transformation of oxidic molybdenum based species into MoS3 (∼80–220 °C) results from redox reactions involving Mo as suggested by the energy position shift observed for the Mo XANES evolution. On the other hand, the peak release of H2S is characteristic of H2S desorption following the reaction pathway MoS3 + H2 → MoS2 + H2S usually proposed for the decomposition of amorphous trisulphide [35]. It is noteworthy that the strong interdependency observed between the Raman gas profile (production/consumption of H2S/H2 phenomenon) and the concentration profile of the Mo species determined by MCR-ALS gives reliability to the chemometric methods to determine concentration profiles and reveal spectra of pure species.
For the monometallic catalyst, neither consumption nor production of H2 or H2S is directly detected by TPS-Raman. The quite long sampling of Raman (3 min) required for detecting gases at atmospheric pressure might be responsible for the non-observation of fast H2S release for this catalyst. As a matter of fact, the transformation rate of MoS3 into MoS2 for the monometallic supported catalyst appears (Fig. 14(A)) faster than the one observed for the bimetallic supported catalyst (Fig. 14(B)).
5.4 Characterisation of the final sulphided species
The Mo K edge XAS data of the molybdenum species during the temperature plateau at 400 °C are compared with a bulk MoS2 reference phase in Fig. 15. The structural parameters determined by the EXAFS fits are presented in Table 4 (Fig. S7 in supporting information). A well-resolved shoulder around 20017 eV is observed on the spectra of the final molybdenum phases. This is characteristic of the MoS2 phase (Fig. 15(A)). The slight smoothing of the structures above the main resonance located at 20035 eV compared to the bulk MoS2 phase, and well evidenced in the EXAFS signal, arises from the formation of nanocrystalline MoS2 slabs. In agreement with the literature [33], this is confirmed by the smaller coordination numbers found for the Mo–Mo contribution compared to that of the MoS2 reference (6 Mo as second neighbours). The identification of the presence of Mo–Co bonds, characteristic of the CoMoS phase for the bimetallic sample, might be difficult due to the inherent damping of the EXAFS oscillations mainly caused by the high temperature (400 °C). Furthermore as the slabs are only partially promoted by cobalt, Mo–Co bonds contribute only for a minor extent to the total EXAFS signal at the Mo K edge. The metrics of the EXAFS fittings of the sulphided CoMo/Al2O3 catalyst without (Fit A) or with a Mo–Co contribution (Fit B) fixed at the usual distance found in the literature for such a contribution are equivalent as presented in Table 4 (Fig. S7, supporting information). This does not allow us to conclude from the Mo K edge results the formation of the CoMoS active species.
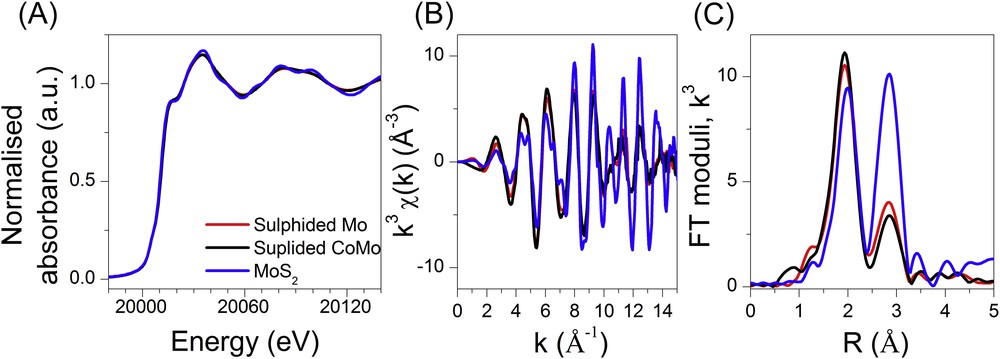
Mo K edge XANES (A) and EXAFS spectra (B) and corresponding Fourier transform moduli (C) obtained during the plateau of temperature (400 °C) of the monometallic and bimetallic catalysts. The MoS2 reference data (RT) are presented for comparison purpose. The EXAFS and FT signals of the MoS2 reference are multiplied with a factor of 0.5 for the sake of clarity.
Parameters obtained from the fit of the Mo K edge EXAFS spectra of the sulphided CoMo and Mo catalysts during the plateau of temperature (400 °C) (Δk = 3.2–13 Å−1, S02 = 0.96, E0 = 20012.2 ± 1.2 eV).
| Backscatterer | N | R (Å) | σ2 (Å2) × 10−3 | R-factor | |
| Suphided CoMo (400 °C) – Fit A | |||||
| S | 6 | 2.41 ± 0.01 | 6.7 ± 0.5 | 0.0085 | 269 |
| Mo | 2.6 ± 1.2 | 3.17 ± 0.01 | 7.4 ± 3.0 | ||
| Suphided CoMo (400 °C) – Fit B | |||||
| S | 6 | 2.41 ± 0.01 | 6.8 ± 0.5 | 0.0081 | 237 |
| Mo | 2.5 ± 0.5 | 3.17 ± 0.01 | |||
| Co | 0.2 ± 0.3 | 2.77 | |||
| Sulphided Mo (400 °C) | |||||
| S | 6 | 2.41 ± 0.01 | 7.2 ± 0.7 | 0.0138 | 2542 |
| Mo | 2.6 ± 1.4 | 3.17 ± 0.01 | 6.2 ± 3.2 |
The Co K edge data obtained at the end of the suphidation are presented in Fig. 16 with the average of the data measured at 400 °C. The Co9S8 data are presented for comparison purpose. Even if the EXAFS oscillations between the samples and the sulphided reference are in phase, Fig. 16 clearly shows that the sulphided species is not only composed of Co9S8 since the XANES shape and the distance of the first coordination shell are different (Co-S contribution at 2.41 Å for the catalysts compared to a distribution of distances of 2.09–2.24 Å for the Co9S8 reference). As presented in Table 5 (Fig. S8, supporting information), it is noteworthy that the best EXAFS fitting for the bimetallic sample is obtained with a Co-Mo contribution (0.9 (1.0) Mo at 2.76 (0.06) Å), characteristic of the CoMoS phase [33]. Then at the opposite of the fitting carried out at the Mo K edge of the final sulphided sample, the EXAFS analysis of the bimetallic catalyst carried out at the Co K edge leads to the conclusive formation of the CoMoS species. This finding supports very well the conclusion of the simultaneous monitoring of sulphidation of Co and Mo centres for the bimetallic catalyst discussed in the previous section.
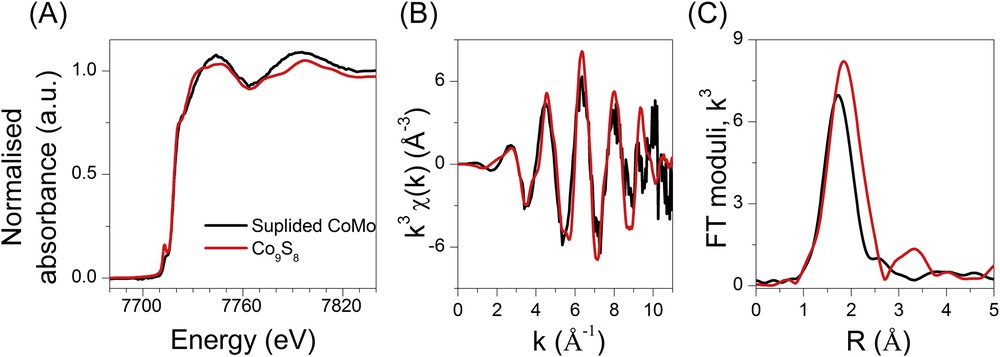
Co K edge XANES (A) and EXAFS spectra (B) and corresponding Fourier transform moduli (C) obtained during the plateau of temperature (400 °C) of the bimetallic catalysts. The data of Co9S8 (RT) are presented for comparison purpose.
Parameters obtained from the fit of the Co K edge EXAFS spectra of the sulphided CoMo/Al2O3 catalyst during the plateau of temperature (400 °C) (Δk = 2.9–9.5 Å−1, S02 = 0.48, E0 + ΔE = 7719.6 eV).
| Backscatterer | N | R (Å) | σ2 (Å2) × 10−3 | R-factor | |
| Sulphided dried CoMo (400 °C) | |||||
| S | 5.2 ± 1.2 | 2.22 ± 0.01 | 5.8 ± 3.2 | 0.01074 | 100 |
| Mo | 0.9 ± 1.0 | 2.76 ± 0.06 |
6 Conclusion
In this paper we demonstrated how powerful are the chemometric tools, such as PCA and MCR-ALS methods, for solving the speciation of evolving catalysts under realistic conditions with two examples of hydrodesulphurisation catalysts. Thanks to the good time-resolution provided by the Quick-EXAFS monochromators at SOLEIL, the speciation of Mo-based phases for the two Mo/Al2O3 supported catalysts has been analysed in-depth upon activation. The simultaneous monitoring of sulphidation by TPS-Raman gives complementary information emphasizing how reliable is the time-resolved speciation of Mo species determined by MCR-ALS.
It has been shown that the introduction of the cobalt promoter changes the molybdenum sulphidation pathway, accelerating the formation of the fully sulphided phase, everything else being equal. Namely, a 3-stepped route has been evidenced for the bimetallic CoMo supported catalyst involving the transformation of the oxidic catalyst into an assumed MoS3-like phase and then to a MoS2 phase. The sulphidation of the monometallic Mo-based catalyst involved a 4-stepped mechanism, with first the transformation of the oxidic catalyst into an oxysulphide species, then to a MoS3-like phase and finally to the final MoS2 phase. It is noteworthy that the lack of complementary information on the chemical nature of sulphur ligands forming the oxysulphide species does not allow us to propose a model for this intermediate. Such limitation will be overcome with a future work in which, for the catalyst characterisation, Raman and Quick-XAS spectroscopies will be used, giving us more insight into the formation of such oxysulphide species [36]. Using the edge jumping capability of the SOLEIL's quick-EXAFS monochromators, it was also pointed out, comparing the concentration profiles of Co- and Mo-based species, that about 40% of metals are concomitantly sulphided providing good conditions to form the CoMoS active species. As a matter of fact the formation of the CoMoS active species is confirmed by the Co K edge fitting of the final sulphide species with the presence of a Co–Mo contribution fitted at 2.76 Å.
Acknowledgement
The authors are grateful to SOLEIL committees for beam time allocated on the SAMBA beamline. Élodie Devers and Antoine Hugon are grateful for fruitful discussions.