

1 Introduction
Lignans are a class of secondary plant metabolites produced by oxidative dimerization of two phenylpropanoid units. The term lignan is applied to the optically active dimers of phenylpropanoids linked by the central carbon atoms of their side chains.
Lignans are mostly present in nature in the free form, while their glycoside derivatives create only a minor form. They are widely distributed in the plant kingdom and have been found in species belonging to more 70 families being represented in pteridophytes, gymnosperms and angiosperms. Lignans are found in roots, rhizomes, stems, leaves, seeds, fruits and trees. The extraordinary high concentrations of lignans (6–24%) have recently been found in wood knots of Picea abies [1].
Because of potent antimicrobial, antifungal, antiviral, antioxidant, insecticidal and antifeeding properties of some of them, lignans play an important role in plant defense against various biological pathogens and pests. Furthermore, they may participate in plant growth and development [2]. In addition to their purpose in nature, lignans also possess significant pharmacological activities, including antitumor, antiinflammatory, immunosuppressive, cardiovascular, antioxidant and antiviral actions [3–5].
Lignans increase the glutathione status in the cellular tissue and hence preserve the cells from the oxidative damage.
The aim of this work is to study and elucidate the origin of brown discoloration in oak staves for barrel making (not knots but diffuse colored marks).
Firstly, we characterized the lignans present in oak wood and we determined their concentrations. The research of their presence in the oak wood is very interesting, because lignans have characteristic colors; for example, the lyoniresinol presents a red vermilion color [6]. Compounds were extracted with an organic solvent and their separation, quantification and identification were carried out by gas chromatography spectrometry (GC/MS). The mass spectral data of these compounds are found in the literature; these data may be useful in the study of the presence of compounds of this nature in foods.
Secondly, we characterized by SEC the fraction “ellagitannins” of each sample, and studied the polymeric ellagitannins part.
2 Materials and methods
2.1 Plant material
The oak samples (Quercus petraea) were made up of heartwood from approximately 175-year-old trees, from homogeneous and appropriately maintained forest compartments. Only the first quarter of the trunk, the cooperage grade timber, was used for the study. The wood was chopped or sawed and then naturally dried for 24 months.
We studied five different staves of Q. petraea heartwood presenting diffuse brown marks (N1–N5) and a control stave (without marks). We scraped depth at 7 mm until disappearance of the brown marks. The different samples (control and five staves) were planed and then crushed to sawdust in liquid nitrogen, before being strained so as to keep only particles smaller than a 60 mesh size. The samples were freeze-dried, stored and analyzed within a period of 2 months. The macromolecules were fractionated (fraction A: lignins; fraction B: polysaccharides; fraction C: ellagitannins) according to the method proposed by Nonier et al. [7].
2.2 Fractionation method
Macromolecules (lignins, polysaccharides and ellagitannins) were fractionated according to the method that we developed and described in a previous work [7]. The fraction “ellagitanin” was thus obtained.
Each sample was fractionated in order to extract components of their corresponding fraction “ellagitannin”.
2.3 Color measurements
Measurements of the absorbance at 520 nm (brown-red hue), at 420 nm (yellow hue) and at 280 nm of the solutions were made in a liquid medium (200 mg of ellagitannin fraction in 5 ml of distillated water) with an ANTHELIE SECOMAM™ spectrophotometer.
2.4 Analysis by size exclusion chromatography (SEC)
Study of the Mp distribution of fraction ellagitannin was performed using the acetyl derivatives. Samples (10 mg) of freeze-dried material were acetylated with pyridine–acetic anhydride (1:1; v/v) for 3 days at room temperature. The precipitate obtained by pouring the mixture into cooled water was recovered by centrifugation. This precipitate was then washed with distilled water, methanol and finally chloroform. It was dried and dissolved in 0.5 ml THF and filtered before analysis by gel permeation chromatography.
SEC analysis was performed using a Thermo Quest™ instrument equipped with three columns (300 × 7.8 mm): TSK™ Gel G 1000 HXL, TSK™ Gel G 2000 HXL, TSK™ Gel G 2500 HXL, in series, protected with a guard column of the same material. The analysis conditions were: THF as the eluent, flow-rate: 1 ml/min, injection volume: 20 μl and analysis time: 45 min. The calibration curve was obtained with polystyrene, and peracetylated ellagic acid was used as a standard. Detection was made at 280 nm with a UV detector (SPECTRA SERIES™ UV-150) and a refractometric detector (SPECTRA SERIES™ RI-150). PL Caliber™ software was used for data acquisition.
2.5 Extraction and GC/MS analysis of lignans
2.5.1 Free lignans
Two hundred milligrams of the fraction “ellagitannin” were dissolved in 5 ml of distillated water. Three milligrams of cholesterol were added (internal standard).
The components of each fraction “ellagitannin” were extracted by liquid–liquid extraction three times with 15 ml of dichloromethane. The dichloromethane extracts were dried over anhydrous sodium sulphate, filtrated and evaporated to dryness under vacuum in a rotary apparatus at room temperature to avoid the loss of volatile compounds.
The final residue was redissolved in 0.5 ml of dichloromethane and silylated using 1 ml of N,O-bis(trimethylsilyl)trifluoroacetamide (BSTFA + 1% TMCS) and 800 μl of GC-grade pyridine in a 2-ml reaction vial fitted with a Teflon-lined screwcap placed at 70 °C for 30 min. The silylated extract was then analyzed by GC/MS.
Gas chromatography/mass spectrometry analysis. GC analysis was performed on a DBXLB column (30 m × 0.25 mm i.d. × 0.25 μm). The temperature was programmed from 60 °C (1 min) to 120 °C at a rate of 50 °C/min, to 200 °C at a rate of 4 °C/min and to 320 °C at a rate of 2 °C/min. Injector temperature: 250 °C; 1 μl was injected in splitless mode. Detection was accomplished with a magnetic spectrometer: VG-Autospec EQ™, operating in electron mode with an ionization energy of 70 eV and temperature of transfer line at 230 °C. Helium was used as the gas carrier. Components were identified by comparison of their retention times and their mass spectra with those found in the literature.
Quantification was carried out by measurement of the relative areas under each peak. Compounds in very small proportions whose peaks were difficult to integrate correctly are indicated as “traces” in Table 3.
Proportion of each fraction (1: polymerized fraction; 2: dimers; 3: monomers) obtained by SEC from the six fractions C
| Fraction 1 (%) | Fraction 2 (%) | Fraction 3 (%) | |
| Ellag. control | Traces | 37 | 57 |
| Ellag. N1 | 21 | 54 | 25 |
| Ellag. N2 | 29 | 41 | 32 |
| Ellag. N3 | 25 | 42 | 33 |
| Ellag. N4 | 28 | 40 | 31 |
| Ellag. N5 | 24 | 41 | 35 |
Each stage of this experiment section was performed three times in order to obtain accurate results.
2.5.2 Lignan glycosides
According to the method of Sicilia et al. [8], 200 mg of the fraction “ellagitannin” was extracted with 30 ml of ethanol/water (80:20, v/v) for 4 h at 55 °C in a shaking water bath. The ethanolic extract was filtered and concentrated to about 10 ml by rotary evaporation.
Lignan glycosides were hydrolyzed in general either with enzymes or with acid. Acid hydrolysis was chosen. Three millilitres of the concentrated extract were incubated with 270 μl of concentrated HCl for 1 h at 95 °C in a shaking water bath, diluted with 3 ml of water, and centrifuged at 3000 rpm for 3 min.
The resulting supernatant was extracted three times with 10 ml of ethyl acetate/n-hexane (1:1, v/v), and the organic phases were collected. After each extraction, the samples were centrifuged at 4000 rpm to accelerate phase separation. The combined organic phases were evaporated to dryness by rotary evaporation.
The final residue was redissolved in 0.5 ml of acetonitrile and silylated using 1 ml of N,O-bis(trimethylsilyl)trifluoroacetamide (BSTFA + 1% TMCS) and 800 μl of GC-grade pyridine in a 2-ml reaction vial fitted with a Teflon-lined screwcap placed at 70 °C for 30 min. The silylated extract was then analyzed by GC/MS.
Gas chromatography/mass spectrometry analysis. GC analysis was performed on a DBXLB column (30 m × 0.25 mm i.d. × 0 25 μm). The temperature was programmed from 60 °C (1 min) to 120 °C at a rate of 50 °C/min, to 200 °C at a rate of 4 °C/min and to 320 °C at a rate of 2 °C/min. Injector temperature: 250 °C; 1 μl was injected in splitless mode. Detection was accomplished with a magnetic spectrometer: VG-Autospec EQ™, operating in electron mode with an ionization energy of 70 eV and temperature of transfer line at 230 °C. Helium was used as gas carrier.
3 Results and discussion
3.1 Extraction and GC/MS analysis of lignans
After extraction of the fraction C compounds, each extract was analyzed by GC/MS. Fig. 1 shows the chromatogram obtained in case of a control sample. The chromatographic profile was the same for each sample studied (control and N1–N5 staves).
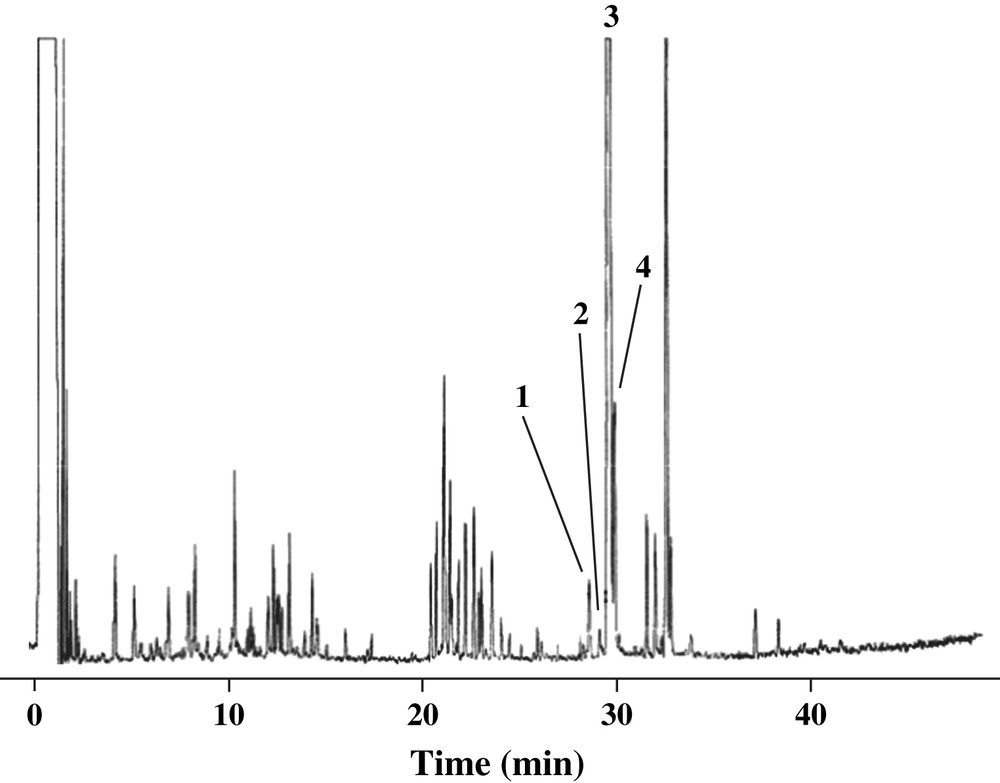
GC chromatogram of lignan extracts from Quercus petraea oak wood (control stave). (For peaks 1–4 identification, see Fig. 2.)
The mass spectra of some trimethylsilyl derivatives (see Fig. 2) were compared with those published in the literature in order to identify them [8,9].
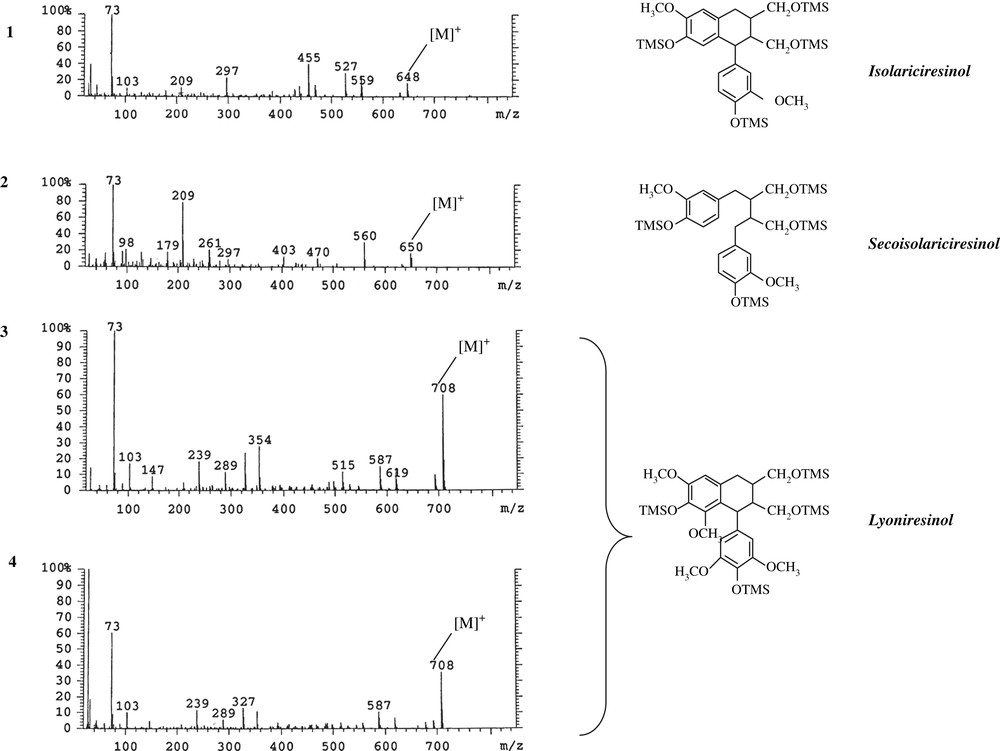
Mass spectra and structures of four lignans extracted from Quercus petraea staves.
These fractions contained a lignan tentatively identified as isolariciresinol (peak 1 in Fig. 1). No reference compound was available, but the mass spectrum of its TMS derivative (Fig. 2) exhibited the same characteristic ions at m/z 648, 558, 527, 468, 455, 437, 424, and 209 as reported in the literature [9–11].
Another lignan was identified as secoisolariciresinol (peak 2 in Fig. 1) by its mass spectrum (Fig. 2), with ions at m/z 650, 560, 470, 424, 350, 261, 209, 179. The same fragment ions of secoisolariciresinol were also described by Sicilia et al. [8].
The fragment ion at m/z 209 is attributable to the stable substituted tropylium ion structure. This ion is strong and is often the base peak in lignans containing two methoxytrimethylsilyl ether benzylic moieties with either C-7 or C-7′ containing one or two hydrogens. The ion m/z 209 shifts to 239 with the addition of a second methoxy group to aromatic rings.
Peaks 3 and 4 in Fig. 1 were, respectively, lyoniresinol and its isomer by comparison of GC/MS data [6,8,9]. Their ions (Fig. 2) at m/z 708, 619, 587, 515, 354, 289, 239 were characteristic of this lignan. The lyoniresinol was identified by Seikel et al. [12] in Quercus rubra wood and by Nabeta et al. [13] in Quercus robur wood. Vivas characterized this lignan in extracts of Q. petraea wood [6] and also demonstrated the presence of two forms of lyoniresinol in these extracts.
We have thus demonstrated the presence of four lignans in the six extracts of Q. petraea. But the quantitative study (results summarized in Table 1) showed that the content of lignans was higher in the five staves N1–N5 than in the control one. The control stave has a lyoniresinol content near 26.4 mg/g of dry wood, and the other staves (N1–N5) have a total lyoniresinol content between 45.8 and 74 mg/g of dry wood (Table 1).
Lyoniresinol content in different oak wood Q. petraea (control and five samples with brown marks) (results are expressed in mg/g of dry wood)
| Ellag. control | Ellag. N1 | Ellag. N2 | Ellag. N3 | Ellag. N4 | Ellag. N5 | |
| Lyoniresinol 1 | 25.0 | 43.0 | 47.0 | 70.0 | 58.0 | 66.0 |
| Lyoniresinol 2 | 1.4 | 2.8 | 2.9 | 4.0 | 3.0 | 4.2 |
| Isolariciresinol | 0.46 | 0.93 | 0.96 | 1.1 | 1.0 | 1.2 |
| Secoisolariciresinol | 0.16 | 0.30 | 0.33 | 0.38 | 0.34 | 0.38 |
| ∑Lyoniresinol | 26.4 | 45.8 | 49.9 | 74.0 | 61.0 | 70.2 |
Some lignans as lyoniresinol have a vermilion red color [6], and they probably contribute to oak wood color. In this study, staves N1–N5 present a lyoniresinol content which allows us to suppose that they are more colored than the control sample.
Table 2 presents the absorbance values at 520 nm obtained for each sample. The control sample has a lyoniresinol content lower than that of the five other staves, but also an absorbance at 520 nm lower than that of the other samples. Staves with brown marks have important lyoniresinol contents, but also absorbances at 520 nm relatively higher than that of the control.
Total lyoniresinol content (results are expressed in mg/g of dry wood) and absorbance values at 520 nm (red color) in different oak wood Q. petraea (control and five samples with brown marks)
| Ellag. control | Ellag. N1 | Ellag. N2 | Ellag. N3 | Ellag. N4 | Ellag. N5 | |
| ∑Lyoniresinol | 26.4 | 45.8 | 49.9 | 74.0 | 61.0 | 70.0 |
| Abs. 520 | 0.055 | 0.110 | 0.115 | 0.122 | 0.119 | 0.120 |
These results allow us to show that the Q. petraea wood color is closely linked to the lignan content and particularly to that of lyoniresinol. The other identified lignans (secoisolariciresinol and isolaricerisinol) were present in the oak wood extracts (control and staves with marks), but with contents lower than those of the two lyoniresinol isomers.
We failed to extract glycosylated lignans in the wood extract. However, we have not found such compounds. So, the lignans found in oak wood are only present under their free form (the same results were observed by enzymatic way).
3.2 SEC analysis of ellagitannin fraction
Ellagitannin fractions of the six samples (Ellag. control, Ellag. N1, Ellag. N2, Ellag. N3, Ellag. N4, Ellag. N5) were analyzed by SEC.
We noted (Fig. 3 and Table 3) that the profiles (N1–N5) were different from the control one. They presented an important polymerized fraction (high degree of polymerization) noted fraction 1 (21% at 29% according to the sample), whereas the control stave did not present this fraction 1; it presented only monomeric and dimeric fractions.
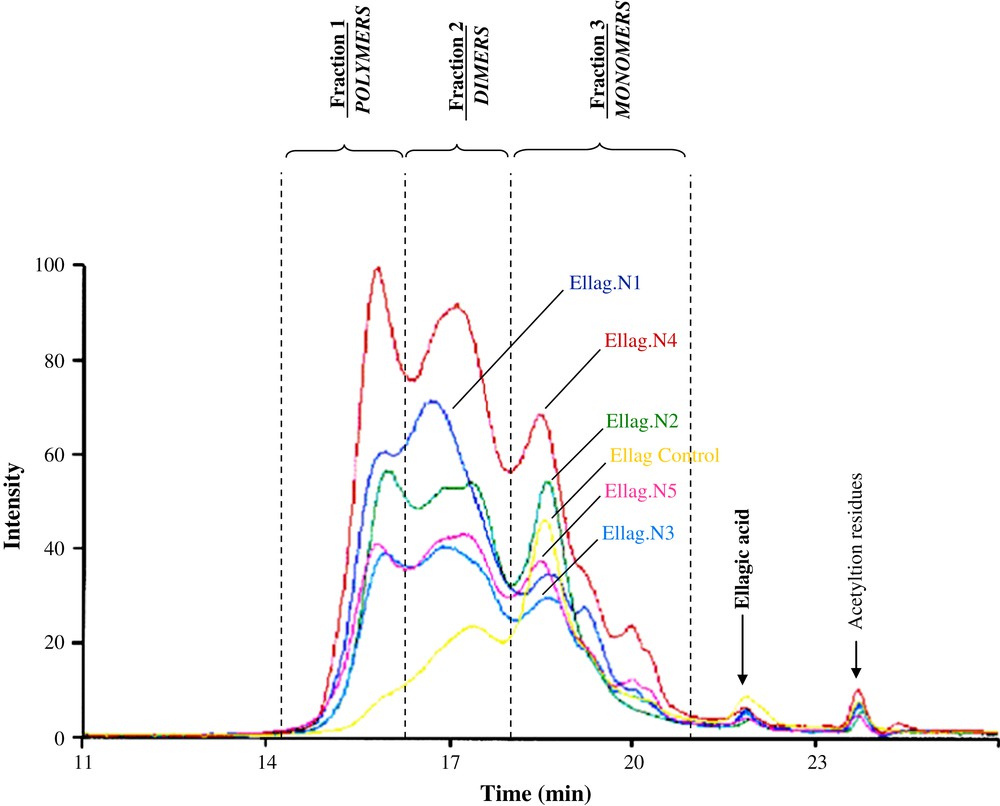
SEC chromatogram of fraction “ellagitannins” (fraction C) from the six staves (Ellag. N1–N5: discolored parts of staves, Ellag. control: non-discolored stave). For visualizing colors, see the web version of this article.
We noted that the higher the values of the molar masses (Mw) (Ellag. N1–N5), the higher the absorbances at 280 and 420 nm. Conversely, the lower the Mw (Ellag. control), the lower the absorbances at 280 and 420 nm (Table 4).
Values of the molar mass (Mw) obtained by SEC and values of the absorbances at 280, 420 nm (yellow color) for the six fractions C
| Abs. 280 | Abs. 420 | Mw | |
| Ellag. control | 0.161 | 0.43 | 2144 |
| Ellag. N1 | 0.237 | 0.64 | 5641 |
| Ellag. N2 | 0.369 | 0.70 | 3711 |
| Ellag. N3 | 0.606 | 0.79 | 3805 |
| Ellag. N4 | 0.556 | 1.12 | 4703 |
| Ellag. N5 | 0.746 | 1.15 | 7106 |
We can also explain the presence of brown marks on the staves N1–N5 by the apparition of very polymerized ellagitannins. These chromophores increased the content of total polyphenols and accentuated notably the yellow color on the marked parts of the staves.