

1 Introduction
It is well known that aero- or xerogel networks pressurised in a mercury porosimeter are compressed, but no mercury intrusion is observed [1–4] except in special cases such as certain sono-aerogels [5]. Pirard et al. [6] and Alié et al. [7] observed Hg intrusion in xerogels and, more recently, Mosquera et al. [8] also observed this. In those cases where no intrusion is observed, the experiment results in an isotropic compression of the gel. Therefore, porosimetry is considered a suitable tool for characterising the compression behaviour of aerogels.
One important observation from the application of porosimetry (actually, isotropic compression) is a plastic behaviour in these gels, whereas other more common techniques such as sound velocity measurements [9], uniaxial compression [10], diametral compression [11], or three-point bending [12] describe them as elastic materials. The general agreement obtained from these procedures is that inorganic aerogels are brittle materials (like glasses) with an elastic behaviour that evolves toward a catastrophic fracture.
Actually, the network of a gel shows two different kinds of compression behaviour under isotropic pressure: the gel network is first linearly elastic under small strains, and then exhibits yield followed by densification and plastic transformation. During this process, the associated structural change could lead to a stiffening of the material (an increase in the network connectivity). However, this is not always the case and, during plastic transformation, the structural changes could result in a decrease in the connectivity through the breaking of structural links and a decrease in the associated elastic modulus. This mechanism is a “plastic softening” often observed in metal, polymers or composite materials. Consequently, the plastic region (and the yield point) is defined by a permanent deformation and not by the increase in the elastic modulus. Woignier et al. [13] demonstrated that his plastic behaviour depends on OH content and pore volume, macroporosity favouring the irreversible shrinkage.
Characterisation of the plastic behaviour conditions of the derived sol–gel is important for several reasons. First, a main objective of sol–gel synthesis is to obtain, at ambient temperature, rigid materials with applications similar to those of glasses. Therefore, an important consequence of this plastic shrinkage is the possibility of densifying and stiffening these gels at ambient temperature by a simple compression process.
A constant Young Modulus (E) fundamentally characterises the elastic regime. It is a very narrow domain for most gels. The bulk modulus (K) is related to E by:
| (1) |
In terms of the bulk modulus, the elastic regime is followed by a regime in which K is decreasing but is reversible and finally by a regime where K decreases or increases with the density of gel and is not reversible. The yield point is the beginning of the plastic deformation. A priori, the yield point is easily identifiable since it is associated with the inflection point of the curve of pressure versus apparent volume of the sample obtained from a mercury porosimetry run. In the case of compliant materials like light aerogels, the initial part of the curve corresponding to an elastic regime is concave downwards, and then for a plastic regime the curvature clearly reverses [3]. However, in the compression curves for more rigid gels like xerogels obtained from TEOS [8], it is not possible to determine this typical change in curvature from a simple inspection. In these specimens, the yield point must be calculated from tedious sequential compressive experiments in which the pressure is progressively increased. The yield point is calculated as the pressure value at which the compression curve becomes irreversible.
The application of ultrasound (sonocatalysis) to the precursors gives rise to materials with genuine characteristics, known as sonogels. The absence of additional solvent and, principally, the effects of ultrasonic cavitation create a unique environment for sol–gel reactions leading to particular features of the resulting gels: high density, fine texture, homogeneous structure, and so on [14]. These properties feature the behaviour of sonogels and sonogel based composites under mechanical stresses. A previous study on nanostructured sono-xerogels hosting silica colloidal particles in different proportions [8] showed that the curves of pressure versus sample volume did not correspond exactly to those reported for classic xerogels. One of the main structural characteristics of sonogels is that the pore size distribution is typically below the 2 nm radius that confers an elastic behaviour along a wide pressure range. This is because, as Pirard et al. have shown [1,6], during compaction, the isostatic mercury pressure P crushes completely pores of size larger than a limiting size L, and leaves the smaller size pores unaltered. The relation between L and P has been determined as L = k/P0.25, according to a mechanism of the pores modelled as the buckling of the brittle filaments of mineral oxide under an axial compressive strength. The k value is a function of E, the elastic modulus of the mineral oxide filaments.
The curves did not show the typical change in curvature attributed to the transition from elastic to plastic regime. Therefore, the yield point could not be distinguished. The analysis of the curves obtained from the sequential compression experiment of every specimen exhibited an elastic response at lower pressures, which means that volume is fully retrieved after depressurisation until the pressure is increased beyond a determined value. This pressure was obviously associated with the yield point value. Results reveal that this value was progressively lower for gels containing colloid in the range 0 to 54% by weight, remained constant for gels containing 65% colloid by weight.
Secondly, an idea put forward by Scherer et al. [3] was that the compression curve can be used to infer the pressure history of the gel. Specifically, the yield point may characterise the maximum pressure that the material has previously supported. Therefore, this point can be used to estimate the maximum pressure supported by a xerogel during drying.
On the other hand, structurally inhomogeneous materials could behave with either a plastic hardening or a softening depending on the increase or decrease in the network connectivity with the pressure increase. It is likely that gel materials can be initially deformed by a plastic softening followed by a plastic hardening. Once a particular plastic process is complete, the system may return to an elastic behaviour until a new plastic process arises. Thus, more than one yield point would be observed. This possibility could remain unnoticed in a standard sequential compressive experiment.
I present in this article an easy way to characterise the plastic regime interval in sonogel derived material. Although the plastic region (and the yield point) is only defined by a permanent deformation, with this approach it is possible to describe the plastic regime by using the data obtained from one single mercury porosimetry run.
2 Description of the approach
The curve of pressure (P) versus the specific volume reduction (v) from Hg porosimetry runs of a sample is used to obtain information about the behaviour of gels under isotropic pressure, when intrusion does not occur. In the case of those samples in which intrusion is possible, this is achieved by wrapping the sample in a latex membrane.
The bulk modulus, K, has been evaluated as:
| (2) |
The inverse of the bulk modulus is the compressibility.
The bulk density increases with pressure according to
| (3) |
| (4) |
Consequently, from Eq. (4), the relative variation in K can also be expressed as:
| (5) |
Thus, there are two terms which are concurrent with the variation in K: the relative change in the slope P(v) is balanced by the relative variation in the sample volume or density. A is related to the network compliance: if a large increase in the pressure does not result in a volume reduction, this indicates that the network stands. In the reverse case, if a slight change in the pressure leads to a reduction in volume, this indicates a compliant material. Hence, during compression, a negative value of dA (i.e., ) indicates that the material compliance is increasing.
Consistently with Eq. (5), K necessarily decreases when increasing pressure is applied, since both terms are negative. On the contrary, denotes that compliance is decreasing. Hence, a decreasing K(v) is always consistent with the situation depicted in Fig. 1(a). However, an increasing K(v) it is not necessarily consistent when the curve P(v) behaves as shown in Fig. 1(b), because K(v) decreases if
| (6) |
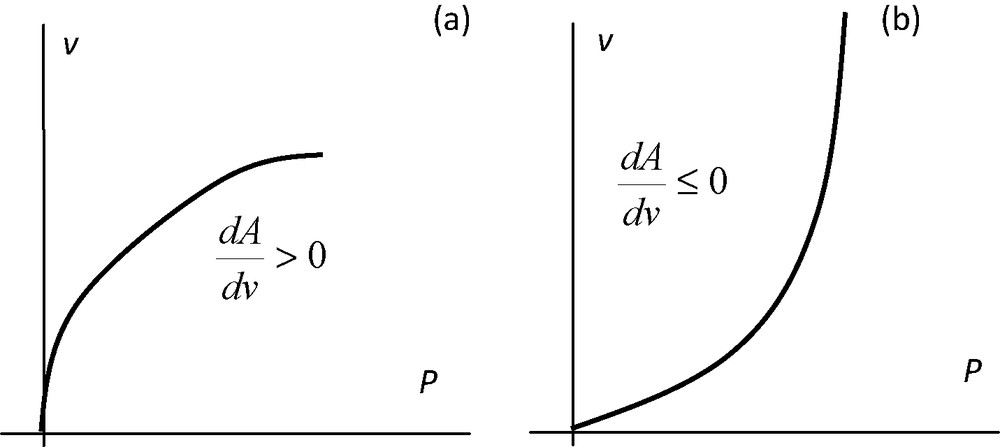
Standard plot of an Hg porosimetry run. (a) The second derivative of P with respect to the specific volume reduction of the sample is not positive. K necessarily decreases as applied pressure increases. (b) This second derivative is positive. In this case, K may increase or decrease depending on the magnitude of Δρb in the interval under consideration.
On the other hand, defining a second order bulk modulus K’ as:
| (7) |
| (8) |
Since, from Eq. (3), . Hence,
| (9) |
The physical meaning of K’ is the variation in the resistance to uniform compression with the changing sample volume, indicating the degree of stability of K.
As |K’–K| decreases, the resistance to uniform compression increases at a rate directly proportional to the density and to (K’–K). The positive or negative sign of K’–K indicates that the sample is more or less resistant, respectively, as it shrinks. A decrease in this difference indicates a diminution in this trend. Thus, K’ serves as a sensitive indicator of the type of process that is taking place at a determined pressure.
Eq. (9) expressed in terms of finite increments becomes:
| (10) |
| (11) |
| (12) |
In this case, the material becomes more or less resistant to isotropic compression depending on whether (Fig. 1 (a)) or (Fig. 1 (b)), respectively.
When K’ ≈ 0
| (13) |
The relative variation in the bulk modulus in terms of the relative variation in density results in:
| (14) |
Then, according to Eq. (5), .
In this case, the decrease in K is equal to the pressure increase in the interval considered and the relative bulk modulus variation is equal to the relative increment in density caused by this pressure. Thus, as represents a decreasing compliance, a decreasing K can only result from a decrease in the network connectivity through the breaking of structural links, that is to say, a plastic softening mechanism.
3 Experimental section
3.1 Synthesis of the gels
The method was applied to samples whose processing was described in earlier papers. They will be referred to in each particular case.
3.2 Mercury intrusion porosimetry
K and K’ values were obtained from P(v) outputs of standard runs of mercury intrusion on a degassed monolithic sample according to the procedure already described [8]. Samples were pressurised to atmospheric pressure in steps of 0.2 to the fitting of the mercury to the irregularities on the surface larger than 0.1 mm. Then, the Hg pressure varied from 0.1 to 390 MPa (1 MPa = 106 Pa = 106 N/m2 = 9.86923 atm). To determine the volume exclusively due to intrusion, runs were compared with results from specimens encapsulated in a rubber membrane, which prevents the entry of mercury. It is the data from these cases that were employed in the analysis. To eliminate errors associated with the encapsulation, a blank of a rubber membrane without a sample was run, and the curve obtained was subtracted from all data corresponding to the encapsulated samples.
4 Application
Firstly, I applied this approach to samples of a titania-silica sono-aerogel. This aerogel (TiO2 molar 1%) was processed as described by Esquivias and Ramírez-del-Solar [15], and is referred to in this paper as the T1S sample. To find the yield point, runs were performed on different samples of this gel up to two different maximum pressures: the difference between the run carried out up to 10 MPa and the one carried out up to 15 MPa showed that plasticity begins near this pressure (Fig. 2).
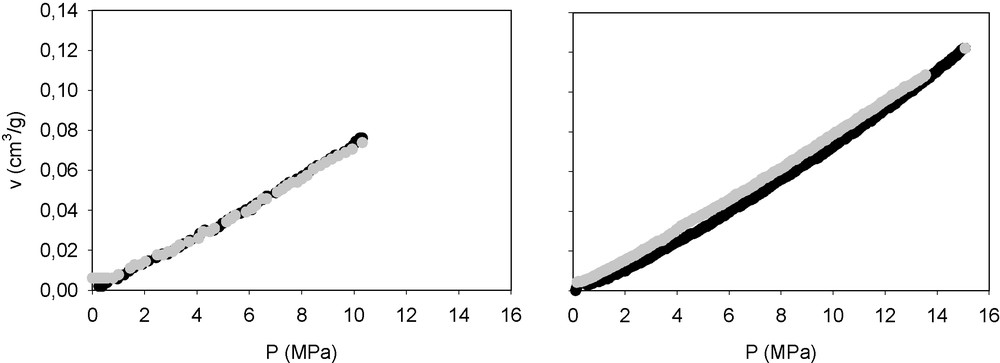
Compression–decompression paths of the T1S sample whose yield point is calculated as 13 MPa by the method described in this paper. The maximum pressures applied were 10 MPa (left) and 15 MPa (right).
In Fig. 3, the corresponding K and K’ are represented. A representation of P(v) is included as well. Hg does not intrude into this sample. This means that r < 750/P = 1.9 nm, in which the pore radius (r) is expressed in nanometers when P is given in MPa, that indicated by the relation from the classic Washburn interpretation [16].
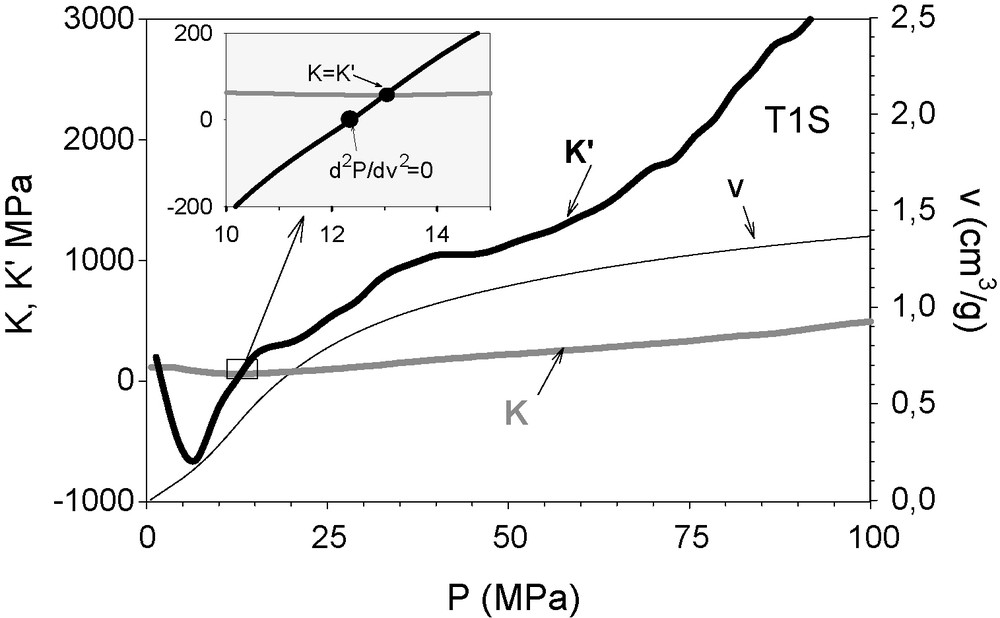
K’ (black bold line) and K (grey line) of titania doped (1 molar %) silica sono-aerogel sample, represented against the applied isotropic pressure. They were calculated from the recorded compression curve P(v) (v scaled at the right abscissa). At P = 13 MPa, K’ crosses the a line, identifying the yield point. The inflection point of the curve P(v) is found at 12.2 MPa (see inset).
First, a decay in K’ can be observed from atmospheric pressure up to P ≈ 6 MPa (r ≈ 125 nm), which corresponds to the filling of the irregularities of the surface. For pressures higher than 13 MPa, the sample hardens plastically. K’ increases monotonically. When the increasing K’ approaches 0, the sample softens plastically. Above the pressure at which this condition is satisfied, the determined pores yield or collapse, thus modifying the structure. Having surpassed the yield point, which occurs at dA/dv ≈ 0, that is, K’ ≈ 0, an increase in K indicates plastic hardening.
The method was also applied to a hybrid organic–inorganic aerogel from TEOS, 20 wt% of silanol-terminated poly-dimethyl-siloxane (with a quoted average molecular weight of 400–700) prepared according to the process previously described [17]. For this run, the Hg pressure varied from 0.1 to 2 MPa (Fig. 4). No Hg intrusion was observed. In the experimental curve, an inflection is observed although the exact point is hard to see. K and K’ values of a sample of this material are also shown in Fig. 4. The yield point appears to be 0.8 MPa, which is found in the inflection interval.
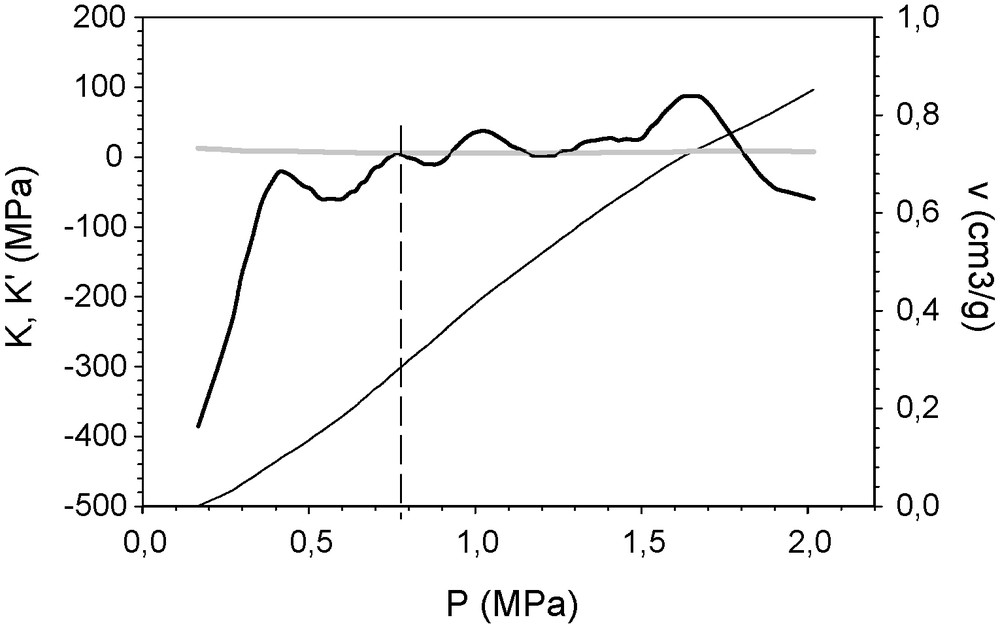
K’ (thick black line) and K (grey line) of a hybrid organic–inorganic aerogel sample represented against the applied isotropic pressure, calculated from the recorded compression curve P(v) (scaled at the right abscissa). At 0.8 MPa, K’ = K. This identifies the yield point.
Fig. 5 (left) is the compression–decompression curve of this material submitted to a maximum pressure of 400 kPa in which the elastic behaviour is notable. In contrast, when a maximum pressure of 1 MPa is applied, a permanent deformation occurs, confirming that the yield point has been surpassed (Fig. 5, right).
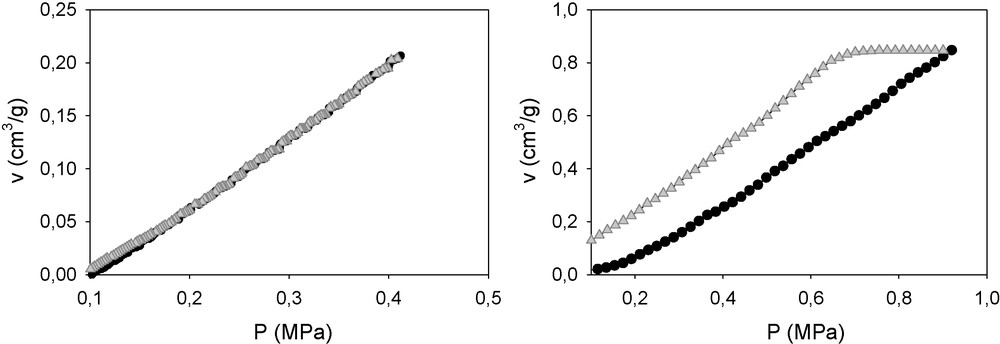
Compression–decompression paths of a sample whose yield point is estimated to be close to 1 MPa by the method described in this paper. The maximum pressures applied were 0.4 MPa (left) and 1 MPa (right).
Finally, we applied this approach to a series of colloid–polymer mixed xerogels and then compared the results with the previously reported values of the yield point, calculated sequentially [8]. These materials present a mechanical behaviour different from that of other gels. Mesoporous gels, such as light aerogels, are usually highly compliant materials with a pore structure that collapses when they are severely compressed under Hg isotropic pressure. In the case of these xerogels, although they are mesoporous, they are also sufficiently resistant to uniform compression to allow intrusion from certain colloid particle concentrations, thus combining large pore size and low compliance. The compression brings about structural changes. They were examined by constructing models from their pore size distribution obtained from N2 adsorption–desorption data, on the basis of random close packing (RCP) premises [18]. We found that the behaviour under compaction of the sonogel phase, which exhibits a significant degree of microporosity, depends on the relative concentration of the colloidal phase. The presence of the colloid particles affects the aggregation kinetics of the sonogel nuclei. The size of the elementary particles (1.3 nm radius) – and their aggregates – of the sonogel phase increases from a radius of 1.6 to 1.8 nm by increasing the colloidal phase content from 30 to 65% by weight [18]. The bulk moduli of this set of compounds as a function of the applied pressure can be seen in Fig. 6. In all the cases, there can be observed a softening mechanism (whether elastic or plastic) followed by hardening for pressure higher than 260 MPa (370 MPa for the sample free of colloidal phase).
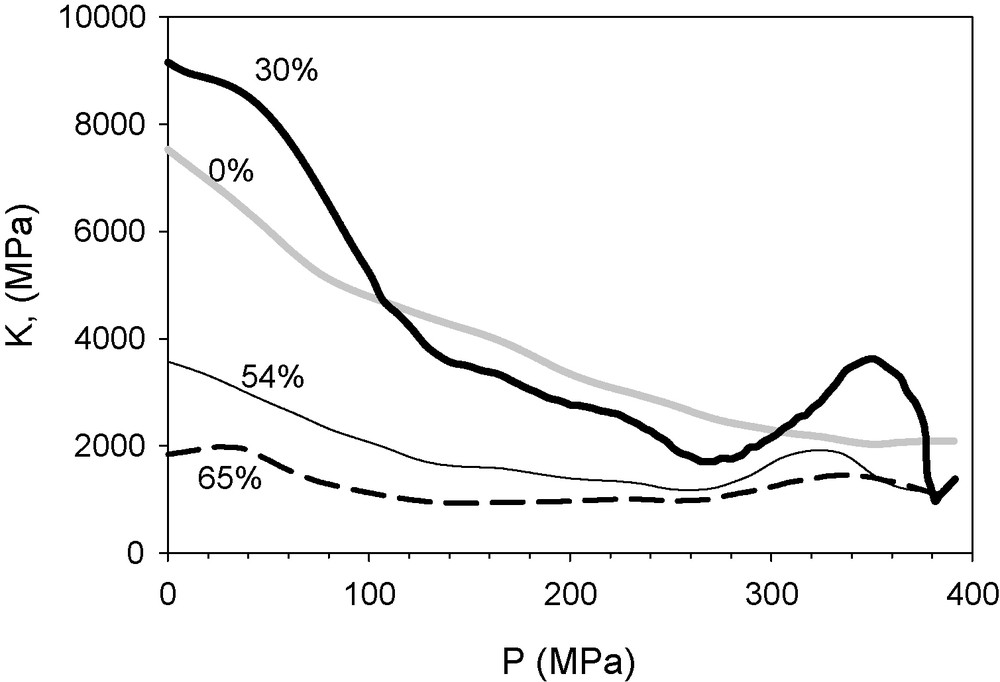
The bulk moduli as a function of the applied pressure of the series of sono-xerogels hosting silica colloidal particles in different proportions in the range 0 to 65% by weight.
Fig. 7 shows K and K’ values of a simple silica sono-xerogel, (i.e., prepared exclusively from TEOS). Hg does not intrude into this sample, as previously reported. The material becomes more compressible as it is compressed (that is to say, K’ < K) at a rate that decreases with decreasing pressure (this is the physical meaning of K’ approaching K). For P = 360 MPa, K’ = 0, the structure yields and the material becomes more resistant as the value of P increases (K’ moves away from K). The yielding is caused by elimination of the microporosity.
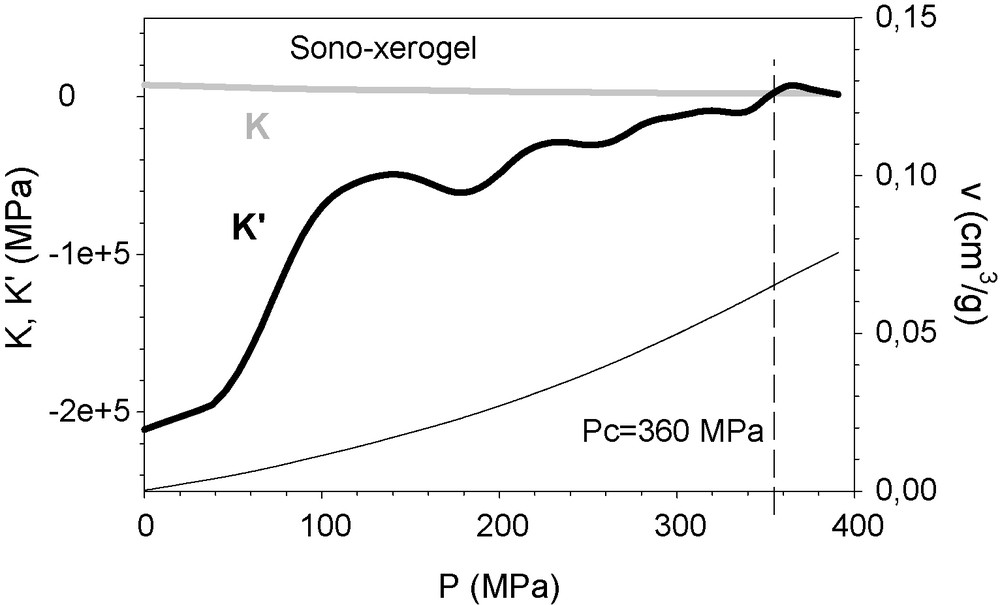
K’ (continuous thick line) and K (grey line) of the silica sono-xerogel sample, represented against the specific compacted volume. The curve of P(v) (continuous thin line, scaled at the right abscissa) is included.
In the case of the colloid–polymer composite xerogel, the method exactly matches the yield point value obtained by sequential runs for the sample containing 30 wt% of colloid, which was found at 295 MPa (Fig. 8). As in the former case, the material becomes more compressible as the pressure increases. According to the structural study, yielding may be attributed to the reduction in microporosity and compaction of the structure and the sonogel elementary particles.
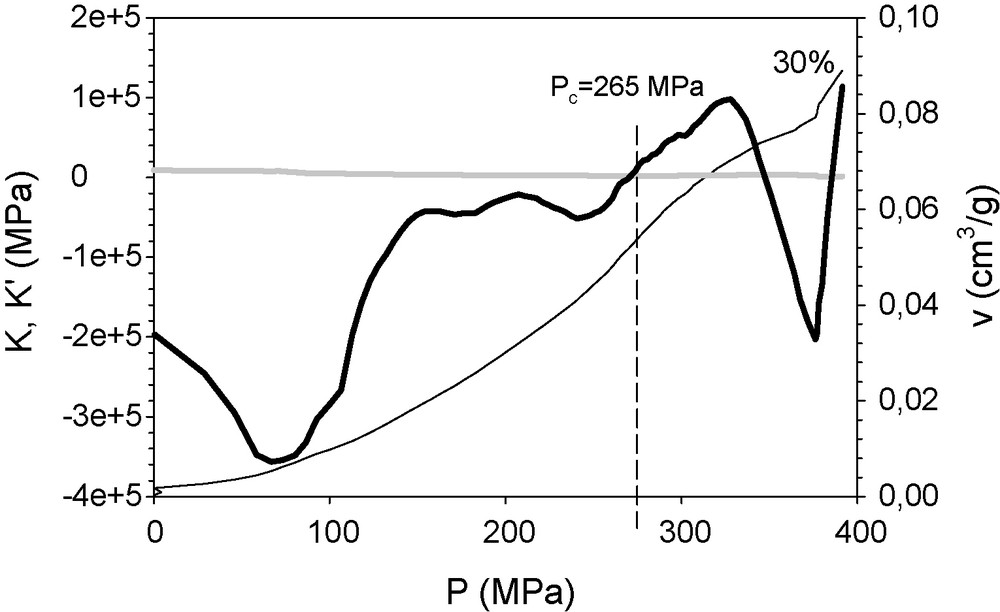
K’ (continuous thick line) and K (grey line) of the mixed colloid–polymer xerogel, containing 30 wt% of colloid particles, represented against the applied pressure. The curve P(v) (continuous thin line) is included too. The specific volume reduction is scaled in the right ordinate.
Fig. 9 shows the calculated K and K’ curves for the composite colloid-polymer xerogels with 54 and 65% colloid content by weight. Also represented is the K’ curve of the counterparts without the latex membrane that prevents mercury intrusion (dashed lines). Both curves overlap up to a certain pressure, beyond which they diverge. From this point, K’ values of the free samples continue growing sharply, crossing the K line at 60 and 45 MPa for the samples with 54 and 65% colloid content, respectively. This fake yielding actually responds to the beginning of the intrusion process a few MPa lower. However, the K’ of the encapsulated sample deviates to cross K at 140 and 150 MPa for the 54 and 65 wt% samples respectively; this may correspond to the yielding of the colloid phase by accommodation between those particles. Above this pressure, K and K’ take similar values and stay constant for a large pressure interval. This indicates that the material does not change its performance during this pressure interval. In both cases, K’ > K at pressures above 255 MPa, probably featuring yield points which were not described in our previous study [8]. They correspond to the collapse of the polymer gel since, as stated in the structural study, with an intermediate colloid content, 50% of the volume reduction is caused by compression of the sonogel phase at the micropore level.
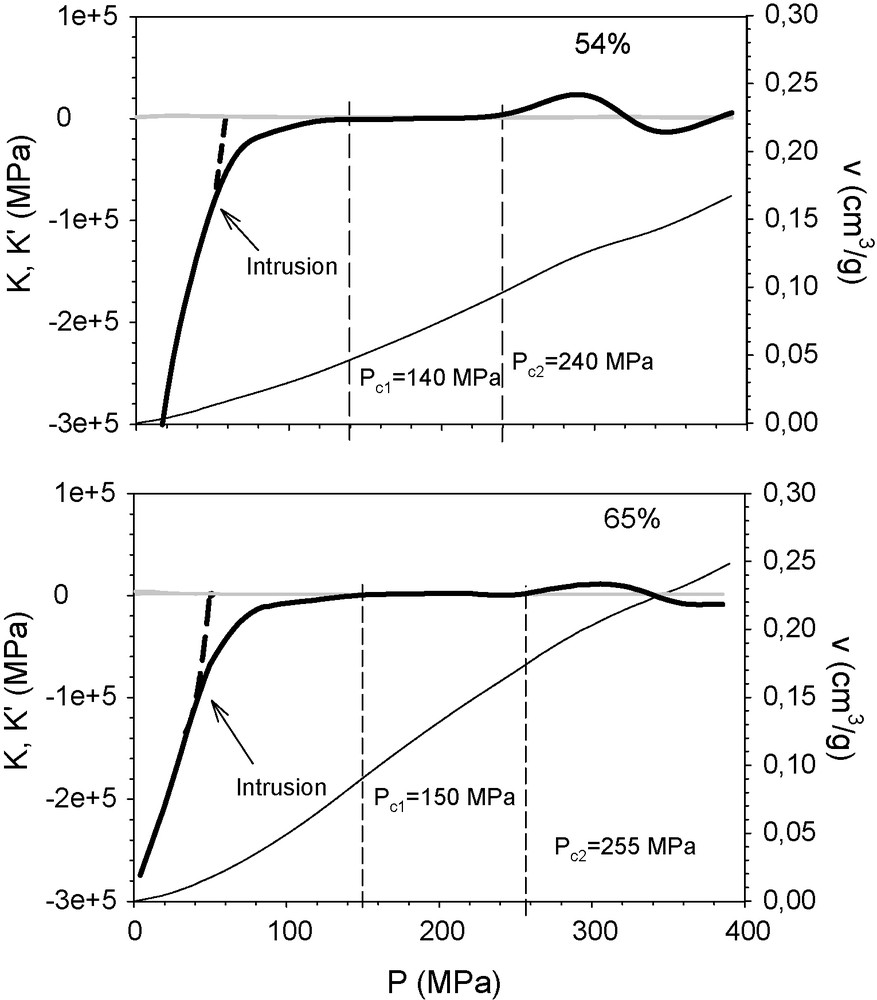
K’ (continuous thick line) and K (grey line) of the mixed colloid–polymer xerogel, containing 54% (above) and 65% (below) colloid particles by weight, represented against the applied pressure. The samples were encapsulated in a latex membrane to prevent intrusion. The dashed lines correspond to the K(P) of the non-encapsulated sample. The curve P(v) (continuous thin line) is included too. The specific volume reduction is scaled in the right ordinate.
Table 1 presents the values calculated from the analysis of the curves obtained from the sequential compression experiment, for comparison. The accuracy of those experiments is limited by the maximum pressure between two consecutive experiments.
A comparison of the yield points calculated by the two methods.
| 0 | 30% | 54% | 65% | |
| Sequential runs | 370 | 300 | 125 | 125 |
| Our approach | 360 | 295 | 140 | 150 |
Thus, this strategy is experimentally limited by the accuracy of the raw data. Smooth curves are obtained from slow runs. K(v) obtained from wider ΔP and Δv are noisier against continuous monitoring of Δv in steps. Accurate data are especially difficult to obtain for low pressures because Δv could correspond to the filling of the open pores on the surface rather than to a real volume reduction. In the case of a sample with a smooth surface or wrapped in an impermeable smooth material, it is possible to obtain precise and reliable data for K0.
5 Conclusion
A procedure that makes it possible to discern the interval of elastic and plastic behaviours from a single Hg porosimetry run was devised.
A second order bulk modulus K’ was defined and, from the pressure at which K’ = 0, the sample yields. The physical meaning of K’ is the variation in the resistance to uniform compression with the pressure applied.
This method simplifies the standard procedure and it provides complementary information about changes in the behaviour of the materials under study.
Acknowledgements
The author is grateful for financial support from the Spanish Government through the project MAT2005-01583. I would also like to thank the Consejería de Innovación Ciencia y Empresa of the Junta de Andalucía (Spain) for the annual grant (TEP115), Manuel Piñero for kindly providing the organic modified silicate sample, and Diego Gómez for discussion.