

1 Introduction
Oxidative dehydrogenation of alkanes offers an alternative to thermal pyrolysis and catalytic dehydrogenation as a route for the production of alkenes. Oxidative dehydrogenation of alkanes is potentially much more economical since the reaction is exothermic and does not need an external heat input and avoids equilibrium limitations. However, the production of olefins by the oxidative dehydrogenation of alkanes is not generally successful, due to the low reactivity of these compounds. The catalysts developed up to now are not efficient enough for an industrial application and the discovery of new active and selective catalysts is a major challenge of the petrochemical industry.
The literature demonstrates that phosphorus, and surface-phosphorus in particular, plays a crucial role in phosphate based catalyst systems. There is as yet no consensus on the precise nature of the role that surface phosphorus plays in these catalytic systems, but the results presented in the literature suggest that adding phosphorus to certain phosphate-based catalysts may improve their catalytic performances [1–3]. Consistent with this, it was found [4–7] that catalytic activity could be significantly improved by adding phosphate to certain oxide catalyst surfaces through pretreatment with triethylphosphate, phosphoric acid or ammonium phosphate, but there are not many studies reported in the literature in this direction up to now and the role of surface phosphorus is yet not totally understood. Thus, for explaining the enhanced dehydrogenation reaction of ethane over tin(IV)-phosphorus catalysts, Argent et al. [4] considered that highly nucleophilic surface phosphorus oxide sites favor hydrogen abstraction. Maiti et al. [5] also showed that, in the oxidative dehydrogenation of ethane over phosphated silica and alumina, the activation barriers for the rate-limiting steps were lowered by ∼10 kcal/mol in the presence of P. Kaddouri et al. [6] showed that the addition of P2O5 to the Ni-Mo-O system increased its performance in terms of propene selectivity and conversion of propane. They claimed that phosphorus acts as a promoter preventing propene degradation. El-Idrissi et al. [7] showed that the addition of phosphorus to Cr/TiO2 resulted in a remarkable increase in the activity and ethylene selectivity. They attributed these improvements to the fact that phosphorus contributes to the stabilizing octahedral Cr3+ species in a well-defined environment and adjusts in an advantageous way the acid properties of the active surface.
On the other hand, CeO2 is an important active component of combustion catalysts due to its large concentration of oxygen vacancies, fast exchange of surface oxygen with gas phase oxygen and high diffusion rates of bulk oxygen toward the surface [8–10]. For selective oxidative dehydrogenation, the mobility of the lattice oxygen in the catalyst must be low to inhibit the successive oxidation of alkene. The phosphatation of ceria could have as an effect a substantial increase of the selectivity for oxidative dehydrogenation at the expense of the total oxidation. This could be explained by a reduction of the mobility of the lattice oxygen as a result of the interaction of ceria with the phosphate phases formed at the catalyst surface. In this manner, particularly selective catalysts could be obtained. This is in line with the results obtained by Larese et al. [11,12] which showed that the amount of labile surface and bulk oxygen and the bulk oxygen diffusion rates were significantly reduced and the reduction of Ce(IV) present in the CeO2 solid was affected when ceria was contaminated with phosphorus. The monazite phase present in the surface and subsurface region of the solid has been proposed to be responsible for these effects.
In this article, we report the study of the oxidative dehydrogenation of isobutane over phosphated ceria catalysts containing two different amounts of phosphorus. The catalytic performances of the phosphated ceria were compared with those of pure ceria.
2 Experimental
2.1 Catalysts preparation
The P/CeO2 samples were synthesized by adding to the fine grounded ceria (Merck) a 1.1 M or 2.2 M NH4H2PO4 solution adjusted to pH of 7 with NH4OH (two parts, by volume, of the phosphate solution (6 cm3) were added to one part of ceria (3 cm3 = 4.4 g)). After stirring for about 20 min, the solution was drained from the solid which was than dried at 100 °C and finally calcined in air for 2 h at 400 °C followed by 3 h at 700 °C. This phosphatation procedure was inspired from a method described by Maiti et al. [5]. The P-containing samples were labeled as 1.1P/CeO2 and 2.2P/CeO2, respectively. It is important to point out that pure ceria was subjected to similar calcining procedures prior to reaction testing. Therefore, differences in the chemical behavior of the solids must be interpreted as due to P incorporation in the solids and not to differences in the calcination procedure – calcination temperature and calcination time – applied. It is also worthy to note that the same ceria source was used for all three samples.
2.2 Catalysts characterization
Powder X-Ray diffraction (XRD) spectra were obtained using a Siemens D5000 Diffractometer and monochromatic Cu-Kα radiation. They were recorded with 0.02° (2θ) steps over the 3–70° angular range with 1 s counting time per step.
BET surface areas of the samples were measured at liquid nitrogen temperature using a Micromeritics ASAP 2010 apparatus. Before recording the nitrogen adsorption/desorption isotherms, the sample was degassed at 250 °C for 8 h.
Scanning electron microscopy (SEM) was performed on a Philips XL 30 Environmental Scanning Electron Microscope in order to study the morphology of the catalysts. The chemical composition of the samples was evaluated by EDX microprobe on the same apparatus which was equipped with an EDX analyzer.
XPS was used to observe the surface element compositions. The experiments were performed in a Kratos XSAM-800 system using Al-Kα excitation and 40 eV pass energy in FAT mode. The catalysts were examined in powder form. The 2.2P/CeO2 sample was also examined after hydrogen treatment (1 bar H2, 50 ml/min flow rate) inside the spectrometer at 600 °C for 30 minutes. Charging of catalysts samples was corrected by setting the binding energy of adventitious carbon (C1 s) at 285 eV. The VISION program of the manufacturer was used for the quantification.
Hydrogen temperature-programmed reduction (TPR) studies were carried out using a Micromeritics Autochem model 2910 instrument. Fresh calcined samples (100 mg), placed in a U-shaped quartz reactor, were pretreated in air at 700 °C before reduction. After cooling down to room temperature and introducing the reduction gas of 3% H2/Ar with the total flow rate of 100 cm3/min, the sample was heated at a rate of 10 °C/min from room temperature to 800 °C. The hydrogen consumption was estimated from the area under the peak after taking the thermal conductivity detector response into consideration. Calibration of the TCD signal has been done with an Ag2O standard (Merck, reagent grade) as follow: a known amount of Ag2O was placed in the U-shaped reactor which was heated at a rate of 10 °C/min under the reduction gas (3% H2/Ar). The area under the peak observed corresponds to the hydrogen consumption supposing the reduction of all the amount of Ag2O considered.
2.3 Catalytic testing
The oxidative dehydrogenation of isobutane was performed in a fixed bed reactor operating at atmospheric pressure. The apparatus and the conditions have been described elsewhere [13]. A gas feed with an air to alkane stoichiometric molar ratio (air/isobutane = 2.5) and a volume hourly space velocity (VHSV) of 1000 h-1 with respect to isobutane were used. In a typical reaction run, the reactor containing 2 cm3 (∼ 3 g) of catalyst was heated to the desired temperature, ranging from 450 to 610 °C, in the flow of reactants. The system was allowed to stabilize for about 1 h at the reaction temperature before the first product analysis was made. Each run was carried out over a period of 2–3 h, until three consecutive analyses were identical. The catalysts were recovered after catalytic test by cooling them down rapidly in the flow of reactants. The catalytic reactor was in all the experiments fulfilled with inert quartz particles to minimize potential gas phase reactions. Blank tests have been done without a catalyst (with quartz instead of the catalyst bed) to confirm that homogeneous reaction was negligible in the testing conditions. The reaction products were analyzed by gas chromatography. Chromatograph separation was accomplished with an alumina column for hydrocarbons, a CTR I column for methane and carbon oxides, and a DB-5 column for confirming the absence of oxygenates. The major products formed under these reaction conditions were isobutene, CO, CO2 and cracking products (methane and propylene). Carbon balance based on the products listed was satisfactory in all runs to within ± 3%. Only the isobutane conversion was experimentally measured and calculated based on the number of carbon atoms observed in the product effluent as follows:
The calculated oxygen conversion, based on the products listed and the isobutane conversion, was in all runs larger under the limit of consumption.
The selectivity for product i was calculated as follows:
where ni = number of carbon atoms in the product i; Ci = concentration of product i in the product stream; C4 = concentration of isobutane in the product stream.
3 Results and discussion
3.1 Catalysts characterization
The XRD patterns of pure ceria and phosphated samples are displayed in Fig. 1. For all the solids, reflections corresponding to well crystallized cubic CeO2 fluorite structure were observed (PDF # 34-0394). In the case of phosphated samples, much weaker reflections corresponding to cerium (III) phosphate, CePO4 (PDF # 83-0652), were also observed.
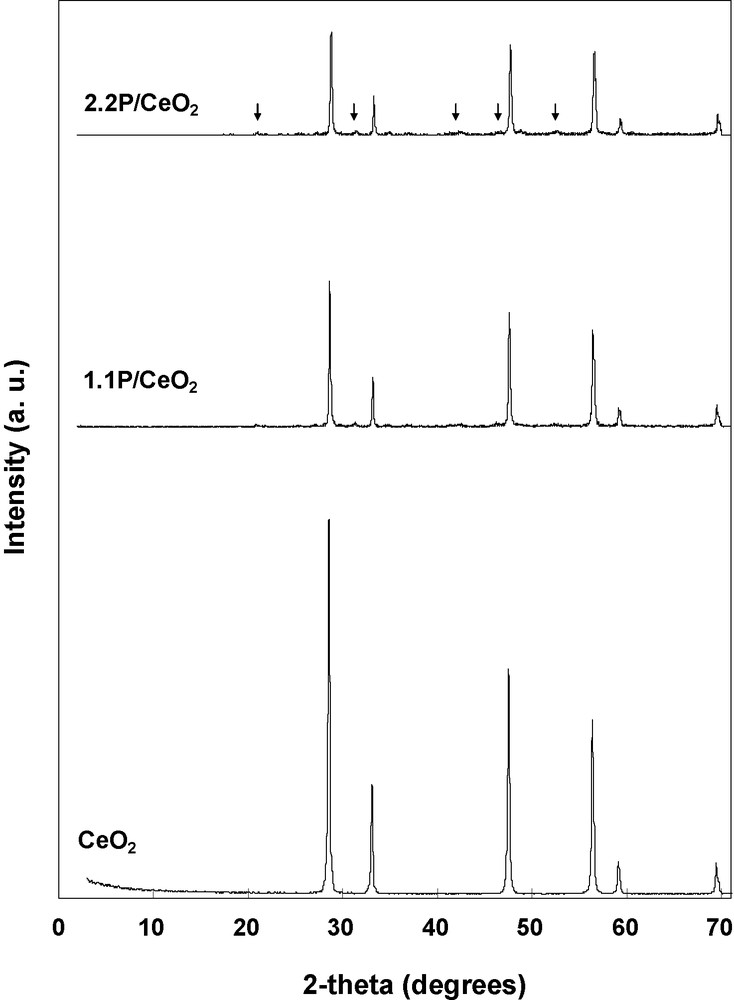
XRD patterns of the CeO2, 1.1P/CeO2 and 2.2P/CeO2 catalysts (↓, peaks corresponding to CePO4 phase).
The physicochemical characteristics of the catalysts are presented in Table 1. The specific surface areas were low and decreased when phosphorous was added to ceria. This result agrees with what has been reported in the literature [12]. Moreover, the specific surface area decreased with increasing phosphorous content in the solid. Fig. 2 shows nitrogen adsorption isotherms for the three samples studied. A perusal of the isotherms clearly demonstrates that incorporation of P in the CeO2 sample and increasing its content results in a modification of the surface texture. Although the type of the isotherm and its hysteresis loop do not change by P addition or by increasing its content, the amount of nitrogen adsorbed is reduced because of the decrease of the specific surface area (Table 1). It is noted that according to the BDDT classification [14], the isotherms presented in Fig. 2 are of type IV and show a hysteresis loop of type H3 due to the existence of interparticle mesoporosity.
Specific surface areas and chemical compositions of the catalysts.
| Catalyst | BET surface area (m2/g) | Atomic composition evaluated by EDX (%) | ||
| P | Ce | O | ||
| CeO2 | 6.4 | – | 35.4 | 64.6 |
| 1.1P/CeO2 | 3.3 | 2.6 | 43.1 | 54.3 |
| 2.2P/CeO2 | 2.6 | 6.9 | 33.5 | 59.6 |
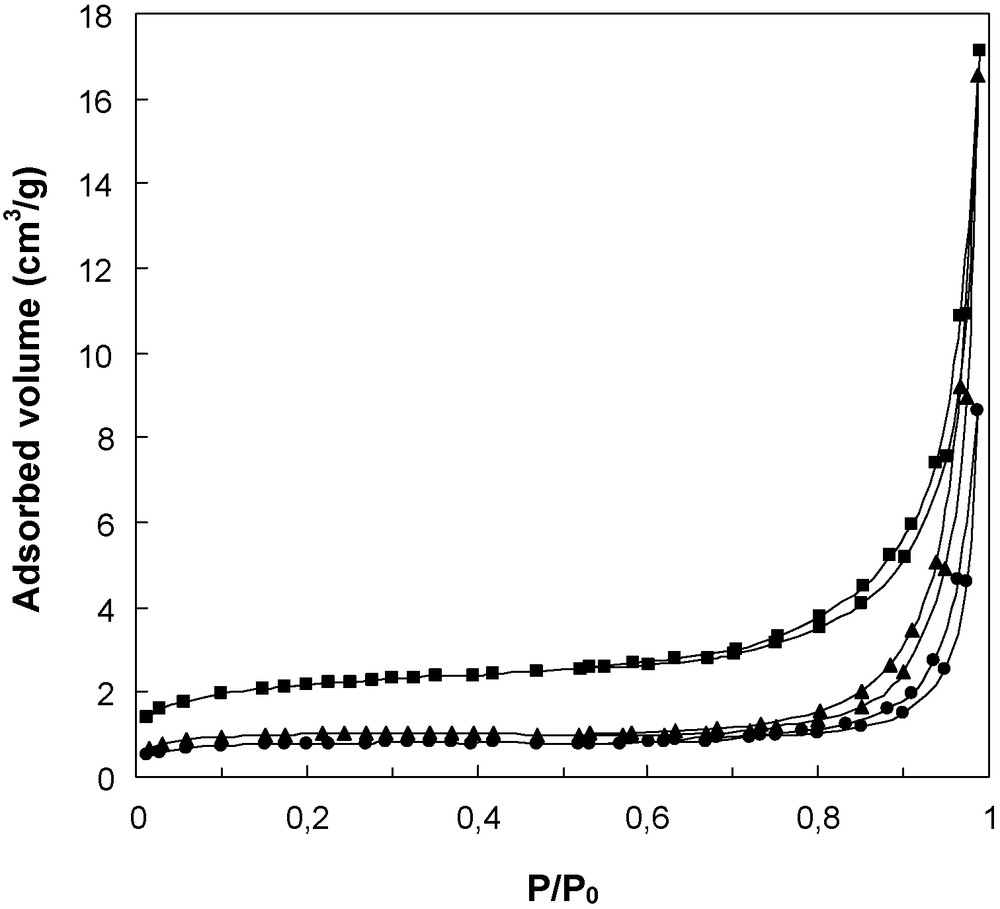
Nitrogen adsorption/desorption isotherms obtained at liquid nitrogen temperature over the CeO2, 1.1P/CeO2 and 2.2P/CeO2 samples.
EDX analysis was made upon several parts of the samples observed by scanning electron microscopy, to measure the chemical composition. The mean of the analyses was taken and are given in Table 1. As expected, the phosphorous content in the catalysts was higher for the sample phosphated with a more concentrated NH4H2PO4 solution. On the other hand, we observe an important excess of Ce with respect to oxygen in the ceria sample and in both phosphated samples. This suggests a strong reduction of ceria and the existence of a high concentration of oxygen vacancies in both phosphated and non phosphated materials. Indeed, the formula describing our ceria sample may be written . This corresponds to a large deviation of stoichiometry. On the other hand, we did not observe any suboxide phase, neither in ceria sample nor in phosphated ones, by XRD analysis. The literature data [15] show that under some circumstances CeO2 can exhibit large deviations from stoichiometry giving CeO2-x, where x can be up to 0.3. On the other hand, the suboxides of cerium can be prepared in strongly reduction conditions but they are unstable in air, readily converting to the dioxide [15]. So, the high degree of reduction observed in our samples may be due, at least partially, to the exposition of the samples to the electron beam in EDX analysis.
The results of the scanning electron microscopic investigation are shown in Fig. 3. They show a round-shaped morphology of the oxide particles and the agglomeration of the particles for the phosphated materials, in line with the observed decrease of the specific surface area.
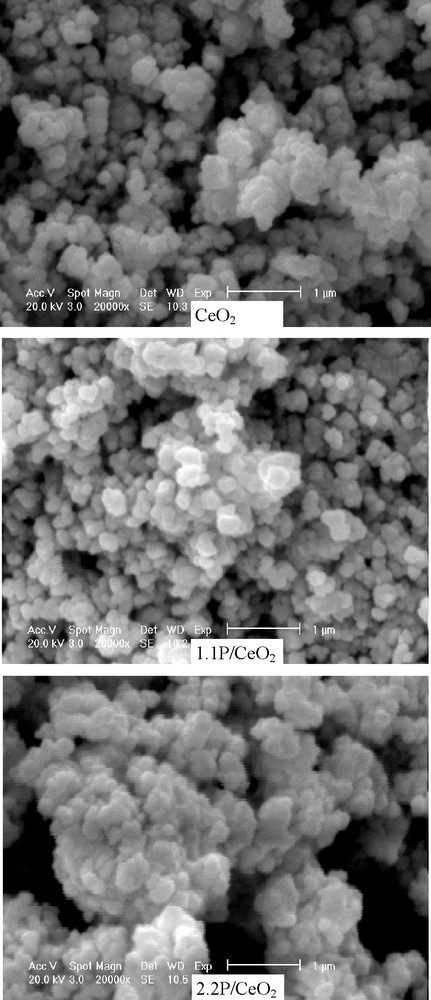
Scanning electron micrographs of the catalyst samples.
Fig. 4 presents X-ray photoelectron spectra of the Ce3d core level for CeO2, 1.1P/CeO2, 2.2P/CeO2 samples as prepared and for 2.2P/CeO2 sample after reduction in hydrogen at 600 °C. The X-ray photoelectron spectrum of Ce3d in Ce(IV) oxide shows six peaks (three pairs of spin-orbit doublets), three corresponding to Ce3d5/2 level, labeled V, V” and V”’, and three corresponding to Ce3d3/2 level, labeled U, U” and U”’ [11]. This is the case for the CeO2 sample where no peaks corresponding to Ce(III) oxide were observed. The Ce(III) oxide exhibits four peaks (two pairs), V0 and V’ for the Ce3d5/2 level, and U0 and U’ for the Ce3d3/2 level [11]. These features are observed in the case of both phosphated samples which also show the Ce(IV) U”’ peak. This Ce(IV) feature could be taken as a semi-quantitative index of the degree of reduction of the sample [11]. After reduction in hydrogen of the 2.2P/CeO2 sample, the Ce(IV) component completely disappeared. The surface composition of these samples, obtained by XPS analysis, is resumed in Table 2. The surface phosphorus content was higher and the surface cerium content was lower so that the P/Ce atomic ratio was higher for 2.2P/CeO2 sample than for 1.1P/CeO2 sample. Phosphorus was in all samples as phosphate, the slight changes in the binding energies observed being not significant. Ce(IV)/Ce atomic ratio, calculated as the ratio between the relative area of the Ce(IV) satellite at 916.8 eV (U”’ peak) and the total Ce area, shows that the surface cerium in CeO2 is Ce(IV), Ce(III) cations, whose existence was suggested by EDX analysis, being probably bulk point defects. When phosphorus was added to ceria, the Ce(IV)/Ce atomic ratio strongly decreased showing the existence of a high surface Ce(III) content, probably as CePO4 phase, as suggested by XRD analysis. On the other hand, after reduction in hydrogen of the 2.2P/CeO2 sample, the Ce(IV) component disappeared and some oxygen was also removed from the sample so that the P/Ce atomic ratio decreased. This suggests that all the surface Ce(IV) cations are reducible in the phosphated samples.
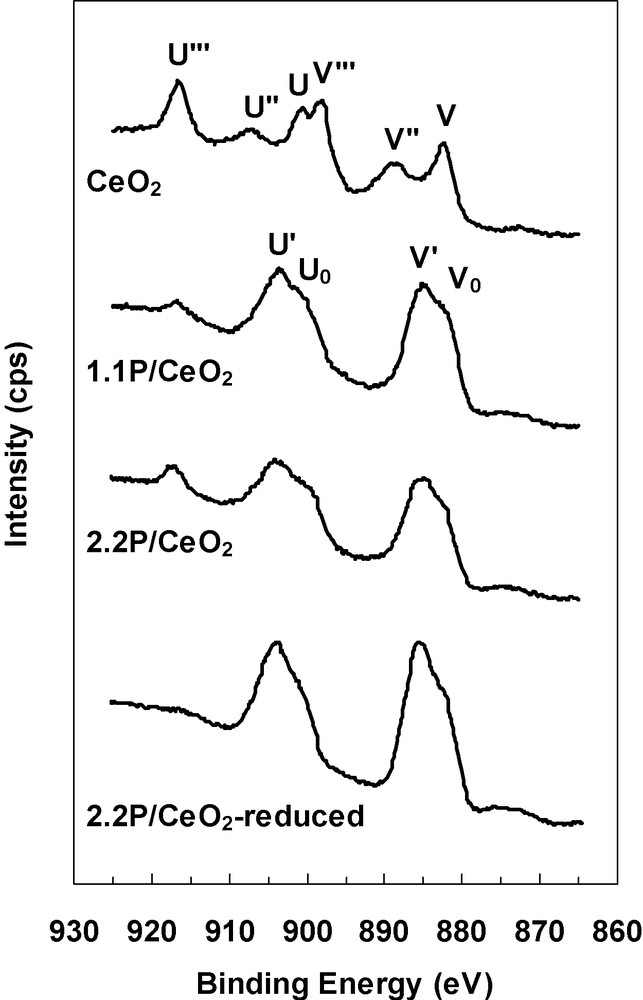
X-ray photoelectron spectra of Ce 3d core levels corresponding to CeO2, 1.1P/CeO2, 2.2P/CeO2 and H2-reduced 2.2P/CeO2 samples.
Surface analysis of the catalysts samples evaluated by XPS.
| Sample | P | Ce | O | C | Atomic ratio | ||||
| B. E.a (eV) | At. (%) | B. E. (eV) | At. (%) | B. E. (eV) | At. (%) | At. (%) | P/Ce | Ce(IV)/Ce | |
| CeO2 | – | – | 882.5 | 26.1 | 529.5 | 64.9 | 9.0 | – | 1.00 |
| 1.1P/CeO2 | 133.2 | 10.9 | 885.2 | 19.1 | 531.7 | 59.2 | 10.9 | 0.57 | 0.36 |
| 2.2P/CeO2 | 133.7 | 11.9 | 885.3 | 14.2 | 531.1 | 60.0 | 13.8 | 0.83 | 0.47 |
| 2.2P/CeO2 reduced | 133.5 | 12.4 | 885.5 | 20.4 | 531.0 | 55.1 | 12.1 | 0.61 | 0 |
a Binding Energy. Reference binding energy: C1 s = 285 eV.
TPR experiments have been carried out over pure ceria and phosphated samples in order to study the influence of phosphorous content on the redox properties of the catalysts. The TPR patterns of the phosphated catalysts, including pure oxide sample, are presented in Fig. 5.
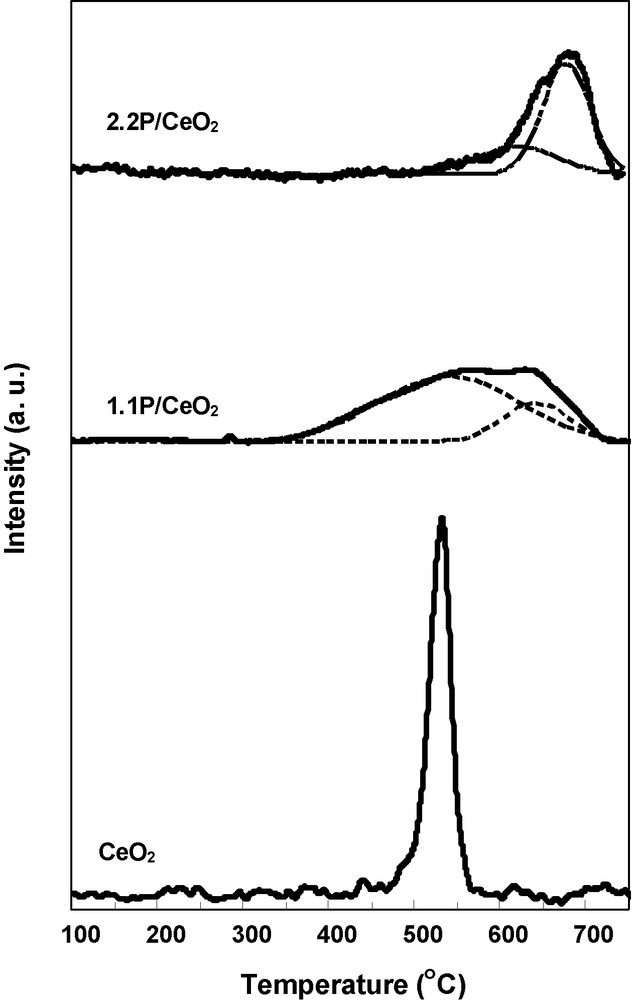
TPR profiles for the CeO2, 1.1P/CeO2 and 2.2P/CeO2 catalysts.
The pure ceria displayed one well-defined reduction peak at 530 °C attributed to easily reducible surface Ce(IV) species [16]. Note that the amount of Ce(IV) reduced in the CeO2 sample is about 6.6% of the total amount of Ce in the sample. When phosphorous was added to ceria a large pattern was observed which was decomposed in two reduction peaks. We consider that, in both phosphated samples, the peak at lower reduction temperature corresponds to the same reducible surface Ce(IV) species as in the pure ceria sample, while the peak at higher reduction temperature corresponds to the reducible surface Ce(IV) species in interaction with surface phosphorous. This hypothesis is based on the observation that P(V) ions can enter the fluorite CeO2 structure by the substitution of Ce(IV) with P(V) [17]. Even though CePO4 phase was evidenced in the phosphated samples by XRD studies, this is a very stable phase that cannot be decomposed or transformed even at high temperatures [18,19]. Therefore, the assignment of the peak at higher reduction temperature to the reducible surface Ce(IV) species in interaction with surface phosphorus seems reasonable.
The peak corresponding to the lower reduction temperature of 1.1P/CeO2 sample is not as clearly well defined as in the pure ceria, suggesting stronger interaction between ceria and the phosphate phase. Moreover, this peak shift to 544 °C higher temperature indicating the reduction ability of Ce(IV) species decreased. The peak at higher reduction temperature has the maximum at 642 °C. In the case of 2.2P/CeO2 sample, the peak corresponding to the lower reduction temperature is very weak and shift to 617 °C higher temperature, and the peak corresponding to the higher reduction temperature shift to 678 °C higher temperature, indicating an additional decrease of the reduction ability of both types of Ce(IV) species, as defined above, with increasing the phosphorous content in the catalyst.
On the other hand, the TPR deconvolution analysis, presented in Table 3, shows that the relative hydrogen consumption corresponding to the peak at lower reduction temperature decreased with increasing phosphorous content in the catalyst. At the same time, the relative hydrogen consumption corresponding to the peak observed at higher reduction temperature increased, in line with our hypothesis that this peak corresponds to reducible surface Ce(IV) species in interaction with surface phosphorous.
TPR deconvolution analysis for the catalysts.
| Sample | H2 consumption (peak area %) corresponding to | |
| Low temperature peak | High temperature peak | |
| CeO2 | 100.0 | – |
| 1.1P/CeO2 | 78.6 | 21.4 |
| 2.2P/CeO2 | 29.1 | 70.9 |
3.2 Catalytic testing
The catalytic properties of ceria and the phosphated ceria catalysts in the reaction of isobutane have been determined in the temperature range of 450–610 °C with an air to isobutane molar ratio of 2.5 and a VHSV with respect to isobutane of 1000 h-1. The results obtained are presented in Table 4. The selectivity to propene, which is a valuable product, has also been reported. We observe that, for all three catalysts, the conversion of isobutane increased with the reaction temperature. At the same time, the isobutene selectivity passed through a maximum at 530 °C for CeO2 and constantly decreased for both phosphated samples. We note that, for all three catalysts at temperatures lower than 530 °C, the sum of the selectivities of CO, CO2 and CH4 was not equal to that of propene, but higher. This suggests that, in this temperature range, total oxidation products (COx) were formed not only from C1 species resulting from the cracking of isobutane, but also by the direct oxidation of isobutane or by further oxidation of isobutene.
Catalytic performances of the catalysts in the reaction of isobutanea.
| Catalyst | Reaction temperature (°C) | Isobutane conversion (%) | Selectivities (%) | |||
| Isobutene | CO | CO2 | Cracking | |||
| CeO2 | 450 | 7.0 | 24.2 | 5.1 | 54.1 | 16.6 (15.9)b |
| 490 | 8.0 | 34.2 | 6.1 | 40.1 | 19.6 (18.0) | |
| 530 | 9.0 | 42.0 | 8.6 | 25.9 | 23.5 (22.3) | |
| 570 | 10.5 | 35.2 | 12.4 | 16.8 | 35.6 (32.7) | |
| 610 | 11.8 | 26.1 | 16.6 | 10.2 | 47.1 (36.6) | |
| 1.1P/CeO2 | 450 | 4.5 | 72.7 | 6.0 | 10.9 | 10.4 (7.2) |
| 490 | 6.5 | 71.2 | 4.4 | 8.1 | 16.3 (11.0) | |
| 530 | 8.5 | 69.4 | 2.0 | 4.2 | 24.4 (15.5) | |
| 570 | 11.1 | 67.6 | 1.5 | 3.6 | 27.3 (16.5) | |
| 610 | 13.5 | 49.2 | 1.7 | 3.5 | 45.6 (25.2) | |
| 2.2P/CeO2 | 450 | 3.5 | 94.0 | 1.0 | 3.0 | 2.0 (1.2) |
| 490 | 5.5 | 90.0 | 3.3 | 4.1 | 2.6 (2.2) | |
| 530 | 8.0 | 88.0 | 3.9 | 3.8 | 4.3 (3.9) | |
| 570 | 11.0 | 87.0 | 3.0 | 2.7 | 7.3 (6.4) | |
| 610 | 14.7 | 68.4 | 2.6 | 2.5 | 26.5 (16.1) |
a Reaction conditions: air to isobutane molar ratio equal to 2.5, VHSV with respect to isobutane equal to 1000 h-1.
b Propene selectivity in the cracking products.
The data from Table 4 also show that, by adding phosphorus to ceria and with increasing the phosphorus content in the catalyst, the catalytic activity in the reaction of isobutane decreased, this decrease being less significant as the temperature increases in the range considered, so that at 570 °C the activity remained almost constant for the three catalyst samples. At higher temperatures, i.e. 610 °C, the catalytic activity in the reaction of isobutane increased by adding phosphorus to ceria and with increasing the phosphorus content in the catalyst. This corresponds to a compensation effect in catalysis [20] as shown in Fig. 6 where the Arrhenius plots for the isobutane conversion on the three catalysts are presented. The apparent activation energies on CeO2, 1.1P/CeO2 and 2.2P/CeO2 catalysts are increasing, i.e. 4.2 kcal/mol, 8.7 kcal/mol and 11.4 kcal/mol, respectively, and are comparable with those reported in the literature for the same reaction [21]. These results suggest that adding phosphorus to ceria new catalytic sites for the isobutane reaction are created but less strong. Phosphorus acts as a poison for ceria in the isobutane reaction at temperatures lower than 570 °C, point that corresponds to the isokinetic temperature. At temperatures higher than the isokinetic point, phosphorus acts as a promoter for ceria in the isobutane reaction, in line with the observed compensation effect.
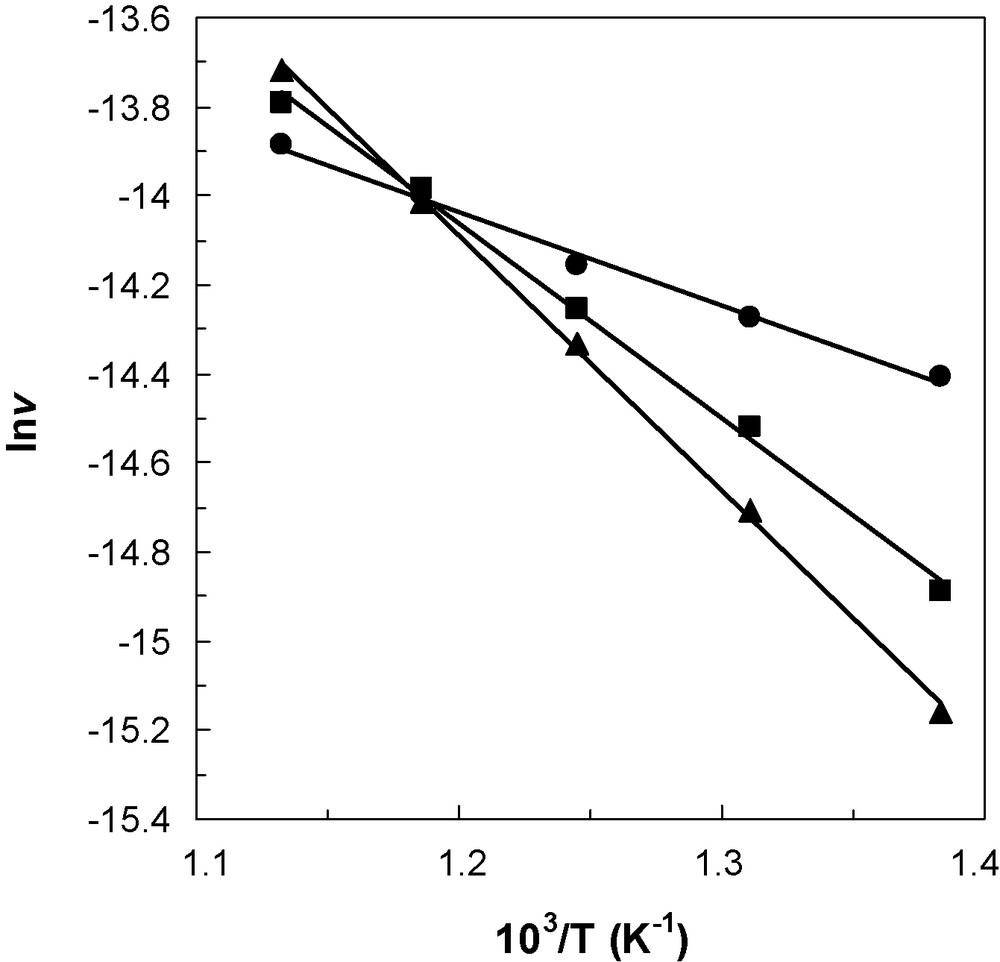
Arrhenius plots for the isobutane conversion on the CeO2 (), 1.1P/CeO2 () and 2.2P/CeO2 () catalysts.
It has already been shown [22] that surface Ce(IV) species in interaction with CePO4 are able to activate isobutane. Thus, we consider that low reducible Ce(IV) species in interaction with surface phosphorous evidenced in the H2-TPR experiments are the new catalytic sites formed at ceria surface that could explain the observed compensation effect in the catalytic reaction.
Moreover, the observed decrease of the isobutane conversion at temperatures lower than 570 °C by adding phosphorus to ceria and with increasing the phosphorus content is correlated with the observed shift of the reduction temperature to higher temperatures in the TPR experiments: lower the reduction ability of Ce(IV), lower the catalytic activity.
On the other hand, by adding phosphorus to ceria and by increasing its content, an important increase of the selectivity for isobutene (the oxidative dehydrogenation product) at the expense of the carbon oxides and the cracking products was also observed. This is well evidenced for the reaction at 570 °C where the conversion was almost constant and equal to approximately 11% for all three catalysts (isoconversion): the selectivity for isobutene passes from 35.2 to 67.6 and 87.0% for CeO2, 1.1P/CeO2 and 2.2P/CeO2 catalyst, respectively. At the same time, the selectivity for carbon oxides passes from 29.2 to 5.1 and 5.7%, and the selectivity for the cracking products, from 35.6 to 27.3 and 7.3%. This increase in isobutene selectivity can be correlated with the observed decrease of the H2-TPR cerium reducibility, in line with what has been postulated by Michalakos et al. for vanadium based catalysts [23].
4 Conclusion
Adding phosphorus to ceria, on the one hand, and increasing phosphorus content, on the other hand, result in a modification of the physicochemical characteristics of the catalyst. Among these, the redox ability of the catalytic material strongly decreases. In line with this, the catalytic activity decreases with an important increase of the selectivity for isobutene mainly at the expense of the combustion products. On the other hand, the formation of low reducible Ce(IV) species in interaction with surface phosphorous in the phosphated catalysts explains the compensation effect in catalysis observed.
Acknowledgements
The authors are grateful to Dr. Oravetz Dezso for his expert technical assistance with scanning electron micrographs recording and EDX analysis and to Dr. Zoltan Schay for his expert technical assistance with XPS analysis. This research was supported by the Romanian National University Research Council (CNCSIS) under the project No. 1064 A/2006–2008.