

1 Introduction
In the field of nuclear waste reprocessing, new solvent extraction processes have been developed in order to isolate minor actinides, responsible for the long-term radioactivity of nuclear waste. Malonamide extractants used in the Diamide Extraction (DIAMEX) process were developed by the French Commissariat à l’énergie atomique (CEA) [1–4]. These extractants contain lipophilic groups in order to be soluble in apolar solvents, as well as inherently polar chelating groups. Malonamide extractants are thus amphiphilic and show surface-active properties. The most frequently studied properties of amphiphilic molecules are aggregation, and the forms of micelles in binary solutions and of micro emulsions in ternary solutions [5]. This aggregation phenomenon was highlighted for the first time by Osseo Asare, who demonstrated the similarities between the behaviours of surfactant and of the tributyl phosphate (TBP) extractant used in the PUREX process [6]. He indicated that the occurrence of phase splitting was due to the formation of reverse micelles, or microemulsion, in the organic diluent by the aggregation of TBP complexes. The concept of a colloidal approach enabled a better understanding of the organic solution of extractants [7–22]. The first direct characterization of reverse micelles with interaction potential came from the modeling of small angle scattering intensities on absolute scale by Madic et al. [17–19]. Over recent years, the TBP-alkane system has been reexamined [7–13], and TODGA organic phases have also been studied [14–16].
As part of the DIAMEX process, organic phases of malonamide extractants have been studied using a colloidal approach. In 1992, NMR spectrometry was used to show that the malonamide molecule N,N′–dimethyl N,N′–dibutyl tetradecylmalonamide extractant (DMDBTDMA) contacted with water can be associated, and forms small aggregates (aggregation number about 4 to 6) [23]. A few years thereafter, Erlinger et al. [17–19] studied the small angle scattering (neutron or X-rays) data of an organic solution of DMDBTDMA diluted in alkane contacted with nitric acid aqueous phase. This was quantitatively linked to a dispersion of spheres associated with a short-range “sticky sphere” attractive potential. The analytical approximate expression of osmotic compressibility and the structure factor derived by Baxter is very useful in estimating the value of the attractive potential between w/o aggregates [24].
It is now well established that the organic phases involved in the DIAMEX process are not molecular solutions [20–22,25–29]. Malonamide extractants diluted in organic solvent self-organise in reverse micelles with low aggregation numbers (from 3 to 10). More recently, several supramolecular structures of organic phases have been identified and studied [20–22,25,26]. The presence of reverse micelles with a polar core is the keystone to understanding phase separation. In some cases, the structure of the aggregates can change from spherical to cylindrical or lamellae structures, which under different conditions can lead to the formation of a third phase [21,22,25,28]. This involves the splitting of the organic phase into a light phase, composed mostly of solvent, and a heavy third phase containing highly concentrated extractant and solutes (metal salt and mineral acid). The nuclear fuel reprocessing industry seeks to avoid this phenomenon, as high concentrations of fissile materials can create criticality problems.
The molecular structures of the diluent and the extractant are crucial for the organization of the organic phase and for third phase formation. Rao et al. [30–32] as well as Berthon et al. [20] showed the importance of the diluent and the extractant chain length effect on third phase formation. Abecassis et al. [26] studied the effect of n-octanol on the structure of malonamide extractant in n-dodecane at a supramolecular scale: the addition of small amounts of octanol does not perturb the organisation of the extractant, where it swells the reverse micelles. When n-octanol is added in larger quantities, a new microstructure appears and the solvent is structured via a transient network of hydrogen bonds. The structural signature is similar in nature to that of hydrotropes and could be dubbed “reverse hydrotropes” [26].
Here, we report the effect of the composition of the polar core on aggregation, and the consequences for organic phase stability. The aim of this work is to quantify the influence of the polar core on aggregation and third phase formation. The case of a specific extracting amphiphile (malonamide DMDBTDMA diluted in n-dodecane) is considered after the extraction of four different solutes: water, nitric acid, uranyl nitrate and neodymium nitrate. The DMDBTDMA concentrations varied between 0.2 and 1 mol/L in n-dodecane, thus using a concentration range where only spherical aggregates are formed [21,22,25] to be sure of the aggregate geometry. The organic phases of these ‘DMDBTDMA/n-dodecane/water/solute’ systems are studied at different levels:
- • on a macroscopic scale, by the determination of the phase transition boundaries quantified by the solute Limit Organic Concentration (LOC), before third phase formation;
- • on a supramolecular scale, by the analysis of the organisation of the species in the organic phases: measurement of the critical micellization concentration, aggregation number and effective attractive interaction between aggregates.
2 Experimental procedures
Different techniques were used to obtain: (i) the composition of the different phases; (ii) the interfacial tension between aqueous and organic phases; (iii) the monomeric concentration; (iv) the aggregation number; and (v) the energy of interaction between reverse aggregates. All the experimental procedures used in this study have already been described in different references and will not be given in detail in this article [20–22,25,26].
2.1 Reagents
DMDBTDMA was provided by Panchim, Lisses, 91, France, and further purified following the method described in [20]. The diluents were from Sigma-Aldrich (Lyon, France), 99% pure. Aqueous solutions were prepared with uranyl nitrate hexahydrate (RP Normapur Prolabo) 99% pure, neodymium nitrate hexahydrate (Aldrich) 99.9% pure, nitric acid (RP Prolabo reagent) and lithium nitrate (Aldrich), 99.99% pure. No further purification was carried out on these products before their use.
2.2 Procedure and apparatus
Equal initial volumes of an aqueous phase of nitric acid and salt and an organic phase containing extractants were shaken together in a thermostatically-controlled cell for 15 min. After separation by centrifuging, each phase was analysed following the procedures described in [20]. The density of the solutions was measured using a DMA 45000 density meter (Anton Paar).
2.2.1 Titration
Diamide concentrations and nitric acid concentrations were determined by pHmetric titration in the organic and aqueous phase, and the Karl Fisher method was used to determine water composition in the organic phases [20].
Uranyl nitrate concentration and neodymium nitrate concentration were determined by X-ray fluorescence spectroscopy. XRF analyses were performed with an X-MET 920 METOREX apparatus after dilution of the samples in 1 M LiNO3 adjusted to pH 2. For uranyl, reference solutions of uranyl nitrate in the 7 × 10⁻⁵ M to 3.5 × 10⁻⁴ M concentration range in 1 M LiNO3 adjusted to pH 2 media were used for calibration, while for neodymium, reference solutions of neodymium nitrate in the 10−3 M to 7 × 10⁻² M concentration range in 1 M LiNO3 adjusted to pH 2 media were used. Uranyl nitrate concentrations and neodymium nitrate concentrations in organic phase were analysed after back extraction in water (Vorg/12Vaq).
2.2.2 Tensiometry
The organic/aqueous interfacial tension measurements were carried out using the drop-weight technique on an in-house apparatus, as described in [20].
2.2.3 Vapour pressure osmometry (VPO)
Measurements were performed at 60 °C using a Knauer Model K7000 vapour pressure osmometer, as described previously in [20]. The aggregation number was determined from VPO measurements on organic solutions contacted with aqueous phase. The measurement principle is based on vapour pressure reduction in solutions (Raoult's law).
2.2.4 SANS and SAXS experiments
The small angle X-ray scattering experiments were performed with in-house cameras optimised to detect small intensities in excess, compared to pure solvent angle-independent scattering produced by the solvent and taken as a reference. The SANS experiments were performed at the laboratoire Leon-Brillouin (LLB), Saclay (France), using the Orphee reactor PAXE spectrometer, as described in [20]. All data were taken and modelled in terms of absolute scale, i.e., cross-section densities in cm2/cm3.
Quantitative analysis of both SAXS and SANS absolute scale data was obtained by separate modeling of the form factor P(q) and the structure factor S(q) for all the scattering objects present – i.e., the extractant molecular aggregates, composed of spherical particles interacting with each other according to a sticky hard sphere potential. Since all molecular volumes were known, as well as the volume of coextracted water, the only parameters required were the aggregation number, the concentration of monomers and the depth (in units of kBT) of the sticky hard sphere potential, assumed to be active in a range taken as R/10, where R is the radius of the micelle polar core.
3 Results and discussion
3.1 Macroscopic scale: third phase instability
The extraction of polar compounds from an organic phase can be limited by the well-known instability of that phase, also called ‘third phase formation’ [33,34]. The extraction of solutes such as nitric acid, neodymium nitrate, or uranium nitrate by DMDBTDMA in n-dodecane can lead to such a formation. The maximum amount of solute solubilised in the organic phase is usually described as the Limiting Organic Concentration (LOC) of solute in the organic phase. Fig. 1 summarises the LOC obtained for the different solutes versus the extractant concentration in the organic phases, using mol/L on both axes. These LOC also quantified the third phase transitions, except for water (no third phase formed during extraction).
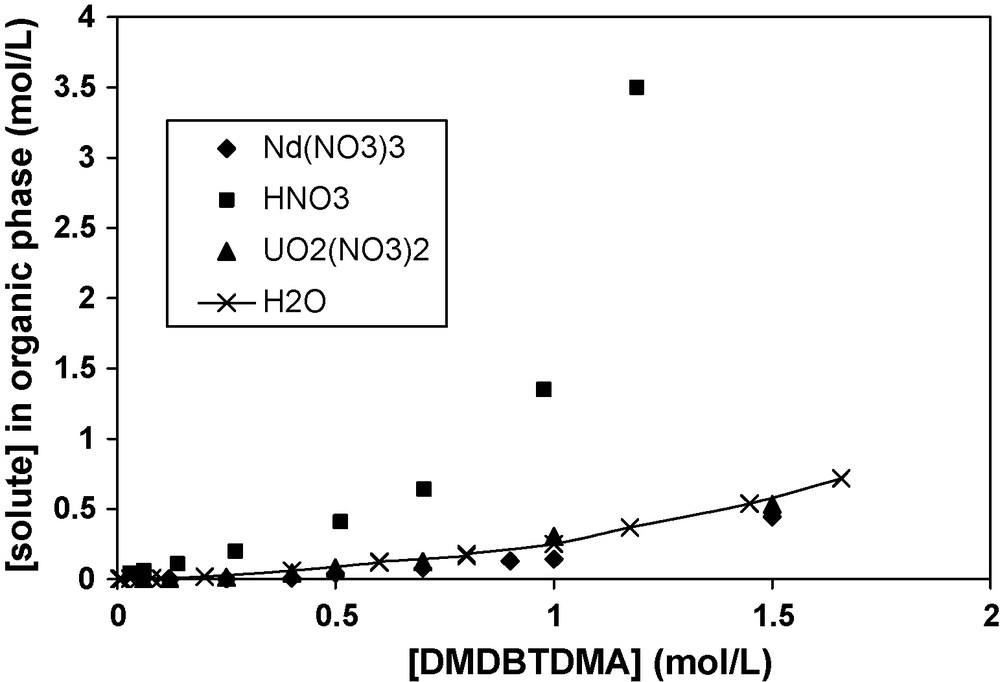
LOC of H2O, Nd(NO3)3, HNO3, UO2(NO3)2 for DMDBTDMA in solution in n-dodecane. The different organic phases are contacted with aqueous phases containing: (1) [Nd(NO3)3] variable, [LiNO3] = 1 mol/L, [HNO3] = 0.01 mol/L, (2) [HNO3] variable, (3) [UO2(NO3)2] variable, [LiNO3] = 1 mol/L, [HNO3] = 0.01 mol/L. The curve labelled as H2O corresponds to the equilibrium between organic phases and pure water; no third phase is observed in this case.
Curves are non linear and surprisingly became steeper for high concentrations of extractants. The order of efficiency for destabilizing the solvent phase from a Winsor-II to a Winsor-III type of equilibrium follows the order UO2(NO3)2 ≈ Nd(NO3)3 ≈ H2O >> HNO3. A Winsor II is a microemulsion in equilibrium with water in excess, while a Winsor-III is a microemulsion in equilibrium with both water and oil in excess [35].
The LOC clearly depends on the nature of the solute extracted. The maximal solubilization limits for the uranyl nitrate and neodymium nitrate solutes in organic phases are of the same order as for water. For nitric acid, the solubility is about 10 times higher than for the other solutes (Table 1).
LOC of Nd(NO3)3, HNO3, UO2(NO3)2 for two different concentrations of DMDBTDMA in n-dodecane contacted with aqueous phases with different compositions: (1) [Nd(NO3)3] variable, [LiNO3] = 1 mol/L, [HNO3] = 0.01 mol/L, (2) [HNO3] variable and (3) [UO2(NO3)2] variable, [LiNO3] = 1 mol/L, [HNO3] = 0.01 mol/L.
| Solute (aqueous phase) | [DMDBTDMA]org (mol/L) | [solute]org,eq (mol /L) | [solute]org,eq/[diamide]org,eq |
| HNO3 | 0.64 | 0.91 | |
| UO2(NO3)2 | 0.70 | 0.125 | 0.18 |
| Nd(NO3)3 | 0.077 | 0.11 | |
| HNO3 | 1.35 | 1.35 | |
| UO2(NO3)2 | 1.0 | 0.304 | 0.30 |
| Nd(NO3)3 | 0.142 | 0.14 |
Moreover, the maximum molar ratio [solute]org,eq/[Diamide]org,eq (last column in Table 1) before demixing depends on the extractant concentration (Table 1). This can be explained by a progressive change of the DMDBTDMA structural organisation in n-dodecane with increasing malonamide concentrations, as observed by P. Bauduin [21].
3.2 Supramolecular scale: formation, size and interactions of aggregates
3.2.1 Formation of aggregates: surface activity at the organic phase-aqueous phase interface and free energy of micellization
Surface-active molecules are characterized by their ability to decrease the surface tension of water or any solvent by adsorbing to the interface (solvent/aqueous phase). The surfactant properties of malonamide molecules were studied by measuring interfacial tensions for various concentrations of DMDBTDMA in n-dodecane at the malonamides–diluent/aqueous phase interface (Fig. 2).

Interfacial tension at the aqueous–organic interface for solutions of DMDBTDMA in n-dodecane at ambient temperature. H2O: water aqueous phase; HNO3: 2 mol/L nitric acid aqueous phase; Nd(NO3)3: 0.2 mol/L neodymium nitrate, 1 mol/L lithium nitrate, 0.01 mol/L nitric acid aqueous phase.
The interfacial tension decrease observed with increasing extractant concentration corresponds to the general pattern observed for classical surfactants. The malonamide molecules adsorb to the organic phase/aqueous phase interface, and thus decrease the interfacial tension. The change in slope observed in the curve γ = f(lnC) corresponds to the formation of aggregates in the organic phase, i.e., the critical micelle concentration (cmc) above which extractant molecules coexist as monomers and aggregates. The molecular area A0 (m2/mol) available at the interface is calculated from the Gibbs adsorption equation for neutral species (Eq. (1)):
| (1) |
The surface excess concentration is defined by Γ = 1/A0 (mol/m2) or 1/Na.A0 (molecule/Å2) with Na the Avogadro number. The apparent free energy of micellization can be derived from the value of the critical micelle concentration by the equation , with Xcmc being the molar fraction. Tensiometric data on malonamide-alkane systems contacted with different aqueous phases are summarized in Table 2.
Water–oil interfacial properties for solutions of DMDBTDMA in n-dodecane at ambient temperature. cmc: critical micelle concentration, Γ: interfacial adsorption excess of extractant, A0: area per polar head in the monomolecular interfacial film.
| Aqueous phase | Conc. (mol/L) | cmc (mol/L) | Xcmc | (kJ/mol) | (kBT) | Γ (mol/m2) | A0 (A2) |
| H2O | Pure | 0.25 | 0.061 | −6.9 | −2.8 | 1.73 × 10⁻⁶ | 96 ± 5 |
| 2 | 0.23 | 0.056 | −7.1 | −2.9 | 1.64 × 10⁻⁶ | 102 ± 5 | |
| HNO3 | 3 | 0.1a | 0.023 | −9.3 | −3.8 | ||
| 4 | 0.05a | 0.011 | −11.1 | −4.5 | |||
| 5 | 0.01a | 0.002 | −15.1 | −6.1 | |||
| Nd(NO3)3 | 0.2 | ||||||
| LiNO3 | 1 | 0.16 | 0.037 | −8.1 | −3.3 | 1.51 × 10⁻⁶ | 110 ± 5 |
| HNO3 | 0.01 |
a [25].
The cmc of DMDBTDMA in n-dodecane contacted with water (cmc ≈ 0.25 mol/L) is close to that observed when it is contacted with 2 mol/L HNO3 (cmc ≈ 0.23 mol/L). With higher concentrations of nitric acid ([HNO3] ≥ 3 mol/L), the cmc decreases steeply. This can be correlated to the protonation of one of the carbonyl groups of the diamides, as demonstrated by IR measurements for high concentrations of nitric acid in organic solutions [23]. This protonation may well increase the surface active properties of the diamides, and therefore decrease the monomer concentration in solvent, as can be seen in Table 2. The contrary is observed with TBP, where the cmc increases with increasing concentrations of nitric acid [13]. This effect has not yet been explained, to our knowledge. The other solutes, such as neodymium nitrate, have little effect on cmc. The formation of neutral complexes between lanthanide nitrate or uranyl nitrate and malonamide in neutral media leads to a slight modification of the surface active properties of the DMDBTDMA, and thus of the cmc [36–40].
The apparent free energy of micellization given in Table 2 indicates the free energy of the transfer of a monomer to a micelle, i.e., a micelle composed of an average aggregation number, using the pseudo phase model. When the micellar solution is contacted with nitric acid, it takes less energy to swell a micelle by solubilizing a monomer. This effect increases in presence of lanthanide salt. Thus, micellization is favoured in the presence of an extracted solute such as nitric acid or neodymium nitrate.
The area per extractant head increases moderately in the order: H2O < HNO3 < Nd(NO3)3. As for TBP [13], this can result from the formation of complexes or solvates of different stoichiometries. It can also be linked to lateral electrostatic interactions [41,42]: nitrates are known to repel when adsorbed to the oil/water interface.
3.2.2 Size and attractive interactions between the aggregates formed
The size of aggregates in the organic phases is quantified by the aggregation number N determined from vapour pressure osmometry (VPO) measurements. Aggregate interactions are quantified by SAXS and SANS. Experimental X-ray and neutron scattering intensities were fitted simultaneously using Baxter's sticky hard-sphere approximation. The only fitting parameter is the strength of adhesion, which quantifies the interaction potential U/kBT.
3.2.2.1 Modelling of aggregation equilibrium from VPO data
The methodology developed to model the aggregation equilibrium (monomer concentration, aggregation number and free energy of micelle formation) has been described previously [20]. It is considered that fundamental molecular units or monomers associate to form multimers, and that aggregates obey the mass action law. Briefly, VPO enables the determination of the osmolality of the extractant S = Σ[BN] in the organic phase, i.e., the osmolality of objects present in solution, whether extractant monomers (B1) or micelles (BN).
The aggregation equilibrium is represented by the following equation:
| (2) |
At the approximation level within the phase or pseudo-phase separation model, all amphiphilic molecules are present in two classes: monomers and micelles of a given micellar aggregation number N [43,44]. The monomers and micelles are pseudo-phases in equilibrium, with fast (ns) exchanges between them. Hence, the monomer concentration is a direct indication of the free energy of micellization: “strong” surfactants have low monomer concentrations.
The activity of a solution is obtained by the classical calibration procedure [20]. The average number of aggregation is calculated from the ratio between “B”, the total molal concentration of molecules and “S”, the osmolality of the different species: B/S = ΣN[BN]/Σ[BN] for different S values. The monomer concentration b and the average aggregation number are then determined by the procedure proposed by Buch et al. [45], which ignores all the activity coefficients. This analysis enables the determination of the aggregation number N and the formation constant KN. This procedure is fully described in [20]. We must emphasise the difference between the average aggregation number , which includes the monomer form, and the aggregation number N, which is the average of existing aggregates as determined for example by the scattering method.
Fig. 3 summarizes the VPO analyses obtained for organic solutions of DMDBTDMA in n-dodecane at 60 °C after contact with three different aqueous solutions: firstly H2O, secondly 0.2 mol/L Nd(NO3)3, 1 mol/L LiNO3, 0.01 mol/L HNO3, and thirdly 2 mol/L HNO3. The signal is proportional to the osmolality of extractant in the solution in the form of monomers or aggregates of different aggregation numbers. It is thus evident that DMDBTDMA forms aggregates at above 0.2 mol/L, depending on the nature of the aqueous phase.
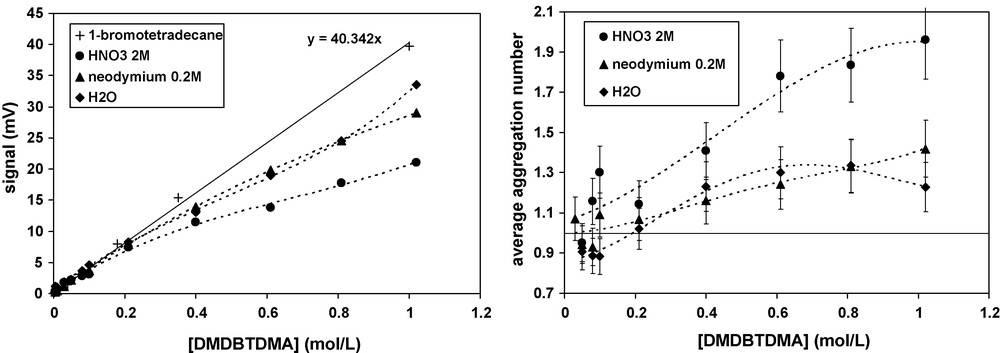
Intensity of VPO signal and average aggregation number (including monomers) as a function of DMDBTDMA concentration in n-dodecane at 60 °C contacted with different aqueous phases (♦) H2O; (▴) 0.2 mol/L Nd(NO3)3, 1 mol/L LiNO3, 0.01 mol/L HNO3, (•)2 mol/L HNO3. The calibration signal (+) of 1- bromotetradecane corresponds to monomers.
The values of N and KN obtained from VPO are summarized in Table 3, while the monomer concentration in organic solution is presented in Fig. 4.
Aggregation numbers ‘N’ and constant of formation ‘KN’ calculated from VPO measurements for DMDBTDMA solutions in n-dodecane contacted with several aqueous phases.
| DMDBTDMA in n-dodecane contacted with | N | KNa | (kJ/mol) |
| H2O | 4.4 | 8 | −0.57 |
| HNO3 2M | 5.5 | 153 | −2.25 |
| Nd(NO3)3 0.2M, LiNO3 1M, HNO3 0.01M | 4.8 | 10530 | −4.77 |
a KN is determined in molal scale (mol/kg of n-dodecane), is calculated using the relationship .
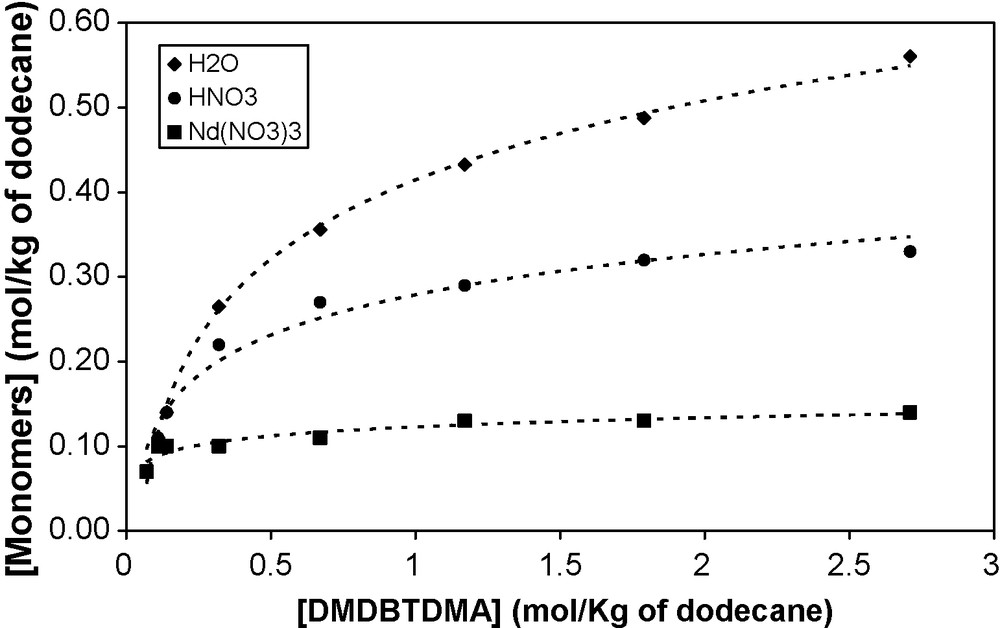
Molal concentration of monomer vs. total concentration of DMDBTDMA in n-dodecane contacted with different aqueous phases: (♦) pure water, (•) 2 mol/L HNO3, (■) 0.2 mol/L Nd(NO3)3, 1 mol/L LiNO3, 0.01 mol/L HNO3.
The aggregation number N is of the same order (≈ 4–5) whatever the extracted solute: water, nitric acid or neodymium nitrate. This indicates that the nature of the solutes does not modify the size of aggregate. On the contrary, the aggregation constant and the monomer concentration strongly depend on the nature of the extracted solutes. This is shown in Fig. 4, which presents the molal monomer concentration as a function of DMDBTDMA molality (mol/kg of n-dodecane) for the DMDBTDMA/n-dodecane solutions contacted with different aqueous phases.
Monomer concentration increases with the total concentration of the extractant. It is also worthy of note that at any concentration considered in the extraction, there is a significant fraction of the extractant that is still in a monomer form: the aggregation is progressive.
For a given domain of extractant concentration, the monomer concentration b depends on the extracted solute and follows the sequence: Nd(NO3)3 ≤ HNO3 ≤ H2O. This variation of the monomer concentration is linked to the cmc variation: cmc(Nd(NO3)3) ≤ cmc(HNO3) ≤ cmc(H2O). A critical concentration can be defined related to the concentration of monomers [46].
is the apparent free energy of a transformation, assembling isolated molecules in one step in a reverse micelle. In Table 3, this energy is expressed per molecule, i.e., it is divided by the aggregation number. The presence of extracted solute favoured aggregation following the order: water < nitric acid < neodymium nitrate.
3.2.2.2 Determination of the attractive interactions between aggregates
Knowing the monomer concentration and the aggregation number N, fitting the small angle scattering data gives access to the interaction of solutes in organic phases. To compare the effects of the extracted solutes on the interaction between reverse aggregates, one experimental condition was chosen: 0.7 mol/L of DMDBTDMA in n-dodecane and T = 23 °C. This aqueous phase was contacted with varying concentrations of solute (water, nitric acid, uranyl nitrate and neodymium nitrate). A set of samples obtained before third phase formation was analysed by SAXS or SANS (Figs. 5 and 6). The quantitative analysis of the spectra is presented in Table 4.
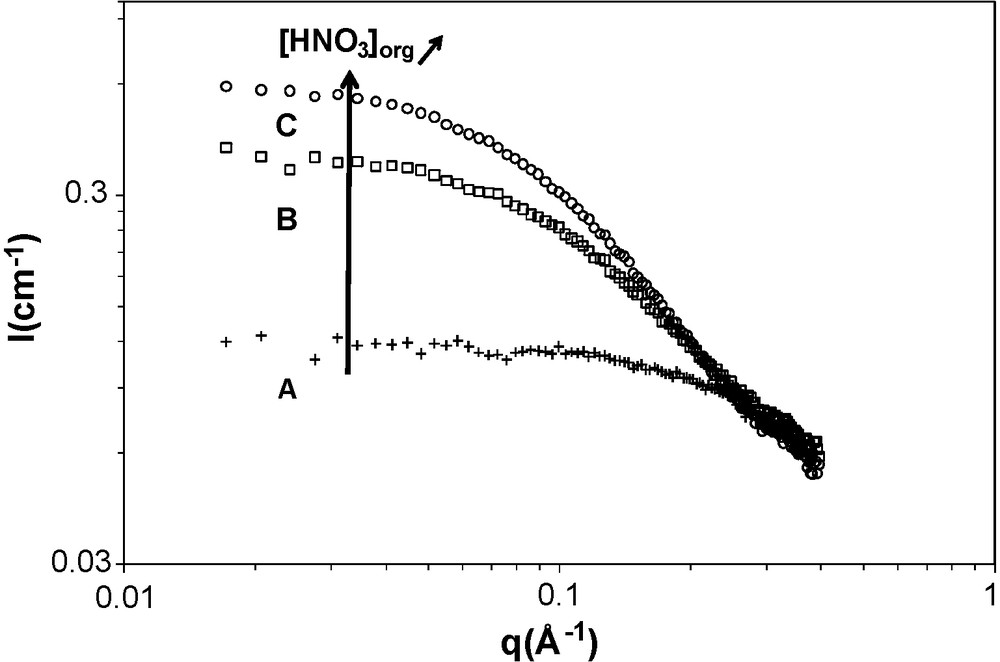
SAXS spectra of the samples ((A), (B), (C)) in a single phase: DMDBTDMA (0.7 mol/L) in n-dodecane after contact with nitric acid solution at T = 23 °C. The compositions of the sample are (A) 0 M (HNO3), 0.14 M (H2O); (B) 0.3 M (HNO3) and 0.42 M (H2O) and (C) 0.6 mol/L (HNO3) and 0.62 M (H2O), respectively.
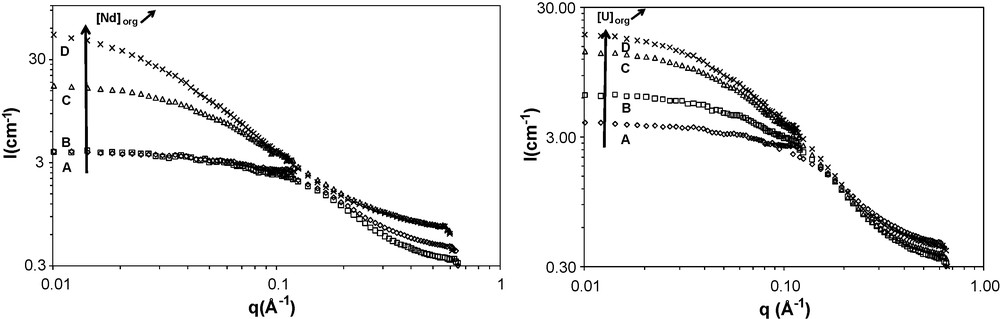
(Left) SANS spectra of the samples (A), (B), (C), (D) containing DMDBTDMA (0.7 mol/L) in n-dodecane and 0; 0.00; 0.033 and 0.056 mol/L respectively of neodymium nitrate and 0.15; 0.15; 0.20; 0.20 mol/L of water at T = 23 °C. (Right) SANS spectra of the samples (A), (B), (C), (D) containing DMDBTDMA (0.7 mol/L) in n-dodecane and: 0; 0.03; 0.08; 0.09 mol/L respectively of uranyl nitrate and water: 0.15; 0.15; 0.15; 0.15 mol/L at T = 23 °C.
Results of the SAXS and SANS spectra analyses of the organic phases containing 0.7 mol/L of DMDBTDMA in n-dodecane contacted with several aqueous phases at T = 23 °C. The only fitting parameter is U/kBT.
| Aqueous phase | [solute]aq,init (mol/L) | [solute]org (mol/L) | [H2O]org (mol/L) | R core (Å) | R agg. (Å) | [monomer] (mol/L) | N | U/kBT |
| Water | 0 | 0 | 0.15 | 7.56 | 9.5 | 0.35 | 4.4 | −1.6 |
| 2 | 0.3 | 0.42 | 8.54 | 10.5 | 0.30 | 5.5 | −1.8 | |
| HNO3 | 4 | 0.6 | 0.62 | 8.54 | 10.5 | 0.09 | 6.3 | −2.4 |
| 0.05 | 0.005 | 0.15 | 7.53 | 9.48 | 0.31 | 4.4 | −1.6 | |
| Nd(NO3)3 a | 0.25 | 0.033 | 0.20 | 7.80 | 9.79 | 0.18 | 4.8 | −2.1 |
| 0.28 | 0.056 | 0.20 | 7.79 | 9.78 | 0.14 | 4.8 | −2.2 | |
| 0.03 | 0.03 | 0.15 | 8.55 | 9.51 | 0.16 | 4.4 | −1.6 | |
| UO2(NO3)2 b | 0.08 | 0.08 | 0.15 | 7.51 | 9.47 | 0.16 | 4.4 | −2.0 |
| 0.09 | 0.09 | 0.15 | 7.63 | 9.54 | 0.16 | 4.4 | −2.1 |
a Aqueous phases of Nd(NO3)3 contained Nd(NO3)3 in 1 M LiNO3 and 0.01 M HNO3.
b Aqueous phases of UO2(NO3)2 contained UO2(NO3)2 in 1 M LiNO3 and 0.01 M HNO3.
For both SAXS and SANS spectra, the scattering spectra for samples far from third phase formation show a plateau in the interval [0.01 Å−1–0.1 Å−1], which corresponds to weak interactions. An increase of the solute in organic phase (nitric acid, neodymium nitrate or uranyl nitrate) led to an increase in intensity for the interval [0.01 Å−1–0.1 Å−1], which corresponds to an increase in the attractive interactions between aggregates. It is now well established that third phase formation is a consequence of the increase of attractive interaction between reverse micelles in extractant solutions [8,12–14,19,34]. This induces the increase of SAXS or SANS intensity observed in the low q-range. In this case, the quantitative analysis of SAXS patterns shows that attractive interaction increases with increasing solute concentrations in organic phase. The quantitative analysis of the spectra (Table 4) confirms the correlation of the supramolecular attraction to extracted salt concentrations.
The effects of the three inorganic solutes tested are roughly in increasing order, with 0.6 M HNO3 in solvent typically needed to produce −2kBT effective attraction, while neodymium nitrate is 10 times more efficient, i.e., only ≈ 0.06 molar is needed to induce sufficient attraction for demixing. Uranyl nitrate is a little less effective than lanthanides (0.09 molar is needed to produce −2kBT effective attraction). We are now able to link the effective attractive potential to the location of LOC at room temperature (23 °C). The interaction forces between aggregates measured by U/kBT increase with the solute concentration, and give the potential corresponding to the phase transition, experimentally measured by the LOC. This potential U/kBT can also be calculated from the Baxter sticky hard sphere model, using the analytical Percus-Yevick solution [47]. The main parameter is the volume fraction of aggregates Φ at the phase transition limit. The values obtained were respectively (U/kBT)eff = −2.6, −2.3 and −2.4 for nitric acid (Φ = 0.33), neodymium nitrate (Φ = 0.28) and uranyl nitrate (Φ = 0.27). These values are close to those obtained by Chiarizia et al. [12] for the extraction of different nitrate salts by 0.7 mol/L TBP in n-octane solutions. The general rule would appear to be that the interaction energy increases when third phase formation nears, and that phase splitting corresponds to a critical value of approximately 2 kBT.
For the same concentrations of ions and extractant in organic phases, the order of interaction potentials are: U/kBT(H) ≤ U/kBT(U) ≤ ∼U/kBT(Nd). This order is correlated to the maximal solubility of the ions in organic phases: LOC(Nd) ≤ ∼LOC (U) ≤ LOC (H). It is necessary to have about 7–10 times less of metal nitrates (Nd and U) than the amount of nitric acid in order to obtain the phase transition, biphasic to triphasic. Regarding the nitrate anion coextracted with the cation, Fig. 7 shows the interaction potential as a function of the nitrate concentration in organic phase for a 0.7 M DMDBTDMA solution in n-dodecane for each solute. The vertical lines give the LOC of the ions, corresponding to the maximal concentrations before phase transition. This emphasises the effect of metallic nitrate compared to that of nitric acid.
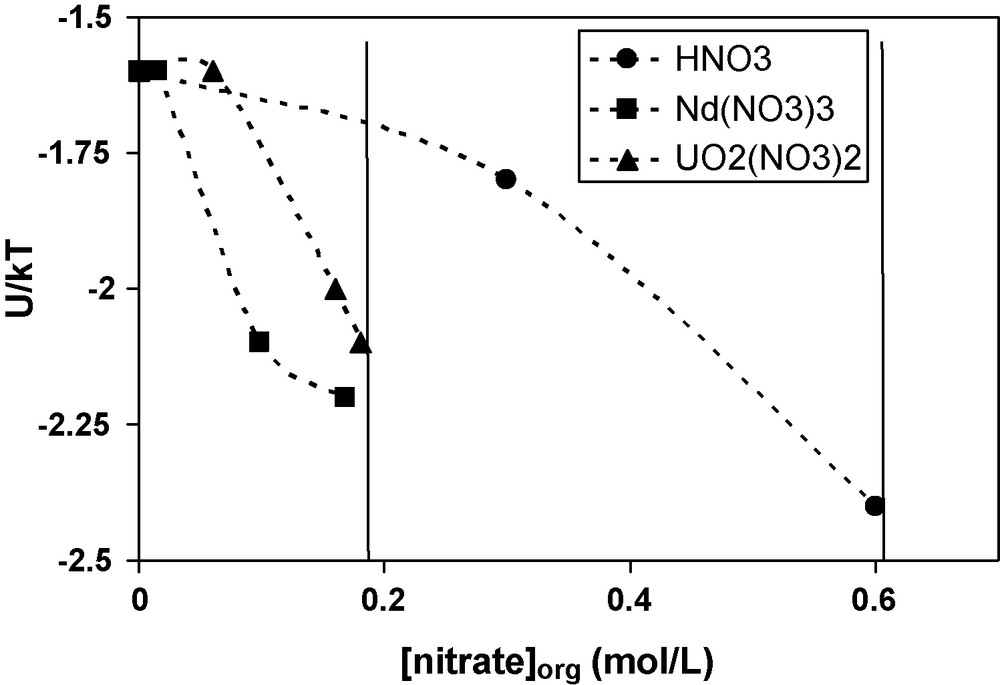
Interaction potential U/kBT as a function of the concentration of nitrate ions in organic phases. The organic phases contain 0.7 mol/L of DMDBTDMA in n-dodecane and neodymium nitrate (■), uranyl nitrate (▴), or nitric acid (•).
At the supramolecular scale, it is possible to interpret this difference, given that the attractive interactions between extractant aggregates are low when the extractant is engaged in a complex with nitric acid compared to the interactions of complexes with metal nitrates. At the molecular scale, this difference may be explained by the weak bonds between HNO3 and one carbonyl function of DMDBTDMA, and the strong bonds between the extractant and the metal nitrates [23,36–40]. Another explanation of the difference in third phase formation may well be the difference of cation polarizability. The addition of a given amount of metal nitrate is more efficient in increasing the attraction between micelles if the metal nitrate is more polarizable. Since the polarizability is much higher for uranyl than for protons, we suggest that the more polarizable the core of the micelles, the higher the attractive interactions between reverse micelles, and the lower the LOC. This point was underlined by Chiarizia et al. [12] for the extraction of nitric acid and different nitrate salts by TBP/n-octane solutions.
The extraction efficiency is thus related to the ability to extract selectively and to avoid phase instability. In this study, the more attractive interactions limit the extractant system stability domain. A practical solution is to add “reverse hydrotropes” to the solution, thus avoiding a reduction in extraction efficiency but inhibiting third phase instability by structuring the solvent [26].
4 Conclusion
DMDBTDMA forms reverse micelles in n-dodecane. When contacting with an aqueous phase (with or without solutes), the micelles formed by the extractant molecules contain less than 10 molecules. Polar cores have a diameter of less than 1 nm. The main driving force towards a liquid–liquid phase separation, i.e., when solvent is expelled and a dense phase is formed, is the van der Waals attraction between polar cores. The formation of and the interaction between the aggregates strongly depend on the valence of the extracted cation. However, the aggregation number remains almost constant whatever the nature of the extracted cation. The model of hard spheres in interaction is well adapted to extractant concentrations varying between 0.3 to 1 mol/L. The maximum of sticky potential of 2kBT is obtained at much larger [solute]/[extractant] ratios for nitric acid than for uranyl nitrate or neodymium nitrate. Once the metallic salts are embedded in the polar core, their volume and polarizability induces stronger long range interactions. All other factors being equal, chaotropic ions, with their high polarizability and easy destruction of the hydration shell, induce much more efficient “sticky sphere” attractions.
The next step towards understanding and predicting third phase formation will be the determination of the effective polarizability of these polar cores, in order to experimentally determine the values of the Hamaker constants.
Acknowledgements
The authors are grateful for the financial support provided by the Commission of the European Communities (Contract PARTNEW – FIKW-CT2000-00087).