

1 Introduction
The radioactive wastes, emerging from the power nuclear reactors and the application of radionuclides in medicine, agriculture, industry and researches, have adverse effect on the human health and the environment. High fission yield and long half-life of caesium and strontium make them as the two most significant radionuclides of fission products, therefore, their separation from the radioactive wastes is important. Ion exchange; precipitation, liquid-liquid extraction and adsorption technique are the traditional methods used for the removal of caesium and strontium from liquid wastes in which the ion exchange is the most effective method [1]. Zeolites, as inorganic ion exchanger, pose high ion exchange capacity, thermal, mechanical and radiation stability and are considered as desirable candidates for the treatment of nuclear wastes. Zeolites are crystalline aluminosilicates with three-dimensional framework structures. AlO4 and SiO4, tetrahedral, are linked together by sharing an oxygen atom. By the substitution of Si4+ by Al3+ in the structure of zeolites, a negative charge appears which is neutralized by the exchangeable cations, such as Na+, K+ and Ca2+. These cations are fairly mobile and could be replaced by other cations. The exchangeable cations of zeolite A are located in the alpha cage of the framework with an aperture of 4–5 A°, favorable to ion exchange [2]. After ion exchange, the adsorbent must be separated from the medium. The magnetic modification offers the advantage of efficient, easy and fast ion exchange separation by applying a magnetic field. By using micro or nano magnetic composites, a new methodology that is simpler, faster and more precise is opened for the removal and preconcentration of elements [3].
Salah El-Din et al. loaded a zeolite with nano iron oxide [4]. Magnetite composite of clinoptilolite and urethane for the removal of Pb2+ was reported by Nah et al. [5]. Oliveira et al. prepared a magnetic zeolite Y composite for the removal of Cr3+, Cu2+ and Zn2+ [6]. Bourlinos et al. decorated the external surface of zeolite Y with maghemite and used it for the adsorption of Hg2+ [7]. Several articles, concerning the application of zeolite A for metal ions and radionuclides removal, have been published [8], but no study has been reported on the synthesis and application of magnetic zeolite A composite.
In this research, we focused our attention to the synthesis of MZC to obtain the required experimental data for the adsorption of Cs+ and Sr2+. First, zeolite A was synthesized, and then MZC was prepared in ammonia solution at ambient temperature. The preparation method was simple, fast and did not need a binder polymer. The physicochemical properties of zeolite A and of the magnetic composite were characterized with XRD, XRF, FT-IR, VSM and SEM. The efficiency of the synthesized zeolite and the magnetic composite for the removal of Cs+ and Sr2+ from aqueous solutions was evaluated. The effect of pH, contact time, temperature and initial concentration on the ion exchange process was investigated. The kinetic, thermodynamic and isotherm parameters of the process were also evaluated.
2 Experimental
2.1 Materials
All the chemical reagents used in this study were of analytical reagent grade [AR Grade]. FeCl3·6H2O (Aldrich 98%), FeCl2·4H2O (Aldrich 99%) and ammonium hydroxide (Aldrich 28–30% of ammonium) were used for magnetic particle preparation. Caesium and strontium were supplied as caesium chloride and strontium chloride, from Merck Company.
2.2 Synthesis of magnetite zeolite composite
Zeolite A was synthesized according to the following procedure [9]. Sodium hydroxide and sodium aluminate were dissolved in water, then stirred and boiled. The prepared solution was added to the hot solution of sodium metasilicate under vigorous stirring. After hydrothermal crystallization, the product was washed with distilled water and dried overnight in an oven at 100 °C.
MZC was prepared through the co-precipitation of Fe3+ and Fe2+ in the presence of zeolite powder. First, 100 ml of aqueous ammonia solution (1 M), were placed in a round bottom flask and a known amount of zeolite powder was added to the ammonia solution. The mixture was homogenized by using vigorously mechanical stirring and deoxygenated by bubbling of N2 gas for 30 min. Solutions of ferric chloride (1 M in water) and ferrous chloride (2 M in HCl 2 M) with volume ratio of 4:1 were prepared and mixed together. The Fe3+/Fe2+ solution was added dropwise to the zeolite/ammonia mixture while the mixture was vigorously stirred under N2 atmosphere. The prepared composite was separated with the aid of a permanent magnet. Finally, the product was washed four times with deionized–deoxygenated water and then dried at 50 °C for 5 h. Five different composites were prepared by adding different amounts of zeolite A.
2.3 Characterization of the samples
The structure of the synthesized zeolite and the magnetic composite was examined using a Bruker, D8ADVANCE X-ray diffractometer. The chemical composition of the samples was determined by a PANalytical Magix X-ray fluorescence spectrometer. FT-IR spectra were obtained by a Shimadzu, IR Prestige-21 Model spectrophotometer. Thermogravimetric analysis of the samples was conducted on Mettler, TG-50 thermal analyzer with heating rate of 10 °C/min. A vibration–sample magnetometer (Meghnatis Daghigh Kavir Co.) was used to characterize the magnetic properties of the composite. The size distribution, shape and morphology of the samples were examined by SEM. The images were taken using Seron technology AIS2100. The cation exchange capacity (CEC) of the synthesized zeolite and the magnetic composites was determined by shaking 1.0 g of the samples with 100 mL of 1 M NH4NO3 solution at 25 °C for 72 h. The ammonium concentration was determined by the Kjeldahl method [10]. The theoretical cation exchange capacity (TCEC) was calculated from chemical composition of the samples as a sum of exchangeable cations present in 1.0 g of zeolite.
2.4 Metal ion uptake experiments
Adsorption behavior of zeolite A and the magnetic composites was studied by batch technique. First, 0.2 g of zeolite or composite was equilibrated with 20 mL of each ion solution in a polypropylene bottle on a thermostat rotary shaker. After equilibration, the zeolite samples were separated by centrifugation while the composite separation was performed by a permanent magnet. Ion concentration was measured by ICP-AES method. The effect of pH on the cations uptake was studied by adjusting the initial pH at 3–8, using 0.1 N HNO3 and 0.1 N NaOH solutions. For kinetic experiments, the adsorbents were contacted with ions solution for different period of time (5–120 min) at 298 K. To study the effect of temperature on the cations removal, the experiments were conducted at four different temperatures of 298, 313, 328 and 343 K, respectively. In order to investigate the effect of iron oxide content on sorption capacity, five composites with different iron oxide contents were prepared. The adsorption isotherms were studied with 0.001–0.1 N cation solutions. Cation uptake (q), expressed as the amount of ions removed per unit mass of the adsorbent was calculated according to:
| (1) |
| (2) |
3 Results and discussion
3.1 Adsorbents characterization
Fig. 1 shows the XRD patterns of the synthesized zeolite and MZC samples. Comparing the diffraction lines at 2θ ranges of 5–45° with those of the reference indicated that the microporous structure of zeolite A was well obtained (Fig. 1a) [11]. In the XRD pattern of the MZC sample (Fig. 1b), the relative line intensity and line position related to zeolite A remained unchanged, indicating that during composite preparation, the crystal structure of zeolite A was stable. The diffraction line of iron oxide was observed at 2θ of 35.55° [12]. By applying the Scherrer's equation [13], the particle size of magnetite in the composite was found to be 21 nm.
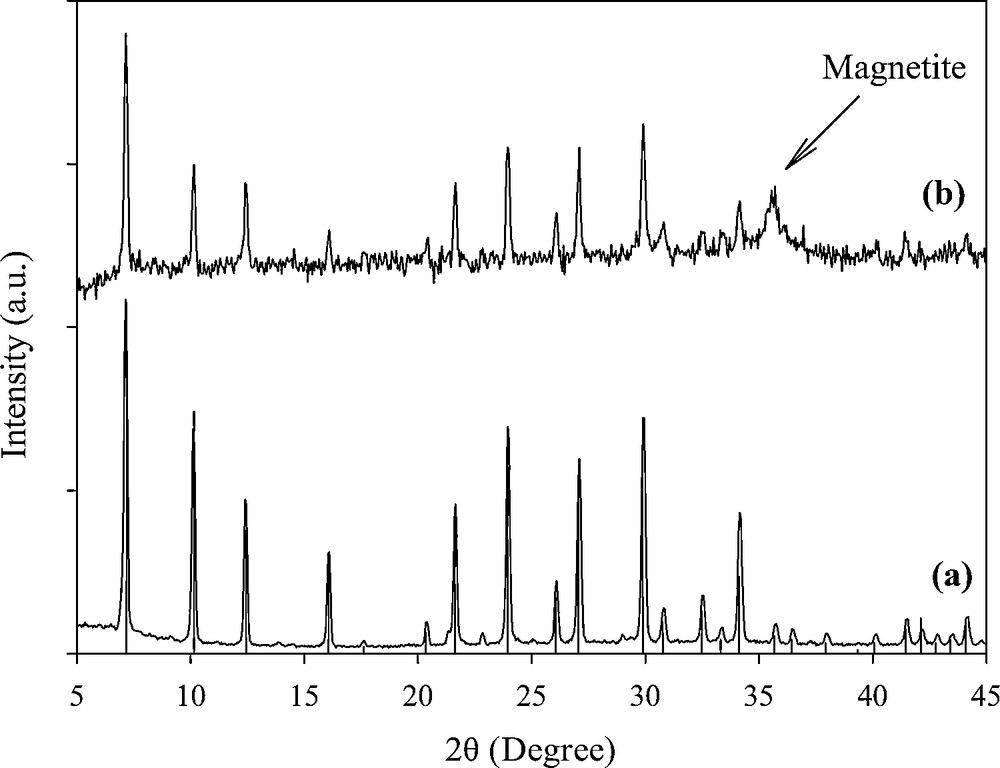
X-ray diffraction patterns of the synthesized zeolite (matched with reference pattern of zeolite A) (a) and magnetic zeolite composite (b).
The chemical composition of the synthesized zeolite and the composite obtained by XRF method is shown in Table 1. The Si/Al ratio of zeolite A was 1.189 and similar to that of reference [14]. The experimental and theoretical adsorption capacity of zeolite A and the composite are listed in Table 2. The CEC value of MZC sample was only 5% lower than that of zeolite A while the zeolite content of the sample was 75%. This showed that iron oxide also contributed to the adsorption process according to the following reaction:
| Iron oxide−OH + M+ → Iron oxide−O−M + H+ | (3) |
Chemical composition of zeolite A and the magnetic zeolite composite.
| Compound (wt.%) | SiO2 | Al2O3 | Na2O | TiO2 | K2O | CaO | Fe2O3 | LOIa | Total | Si/Al |
| Zeolite A | 42.30 | 30.25 | 13.97 | 0.021 | 1.15 | 0.483 | n. db | 11.52 | 99.69 | 1.189 |
| MZC | 30.97 | 20.93 | 10.12 | 0.015 | 0.745 | 0.354 | 26.10 | 10.69 | 99.89 | 1.258 |
a Loss on ignition.
b Not detected.
Adsorption capacity of zeolite A and magnetic zeolite composite.
| Material | Caesium (meq/g) | Strontium (meq/g) | TCEC (meq/g) | CEC (meq/g) |
| Zeolite A | 1.646 | 2.250 | 4.837 | 3.221 |
| MZC | 1.511 | 1.878 | 3.486 | 3.065 |
The FT-IR spectra of magnetite, synthesized zeolite and MZC are recorded between 400 to 4000 cm−1 (Fig. 2). In the spectra of magnetite, the band observed at 579 cm−1 is assigned to Fe−O−Fe [12]. The bands at 465, 560 and 1005 cm−1 are, respectively, related to the vibration of T–O bending, double ring and TO4 asymmetric stretch (T = Si or Al) [15]. The band at 3000–3600 cm−1 represent inter and intermolecular hydrogen bonding. The adsorption band at 1640 cm−1 is related to interstitial bonded water. In the spectrum of the MZC sample, all the adsorption bands related to zeolite A were observed and overlapped with the band related to Fe−O−Fe.
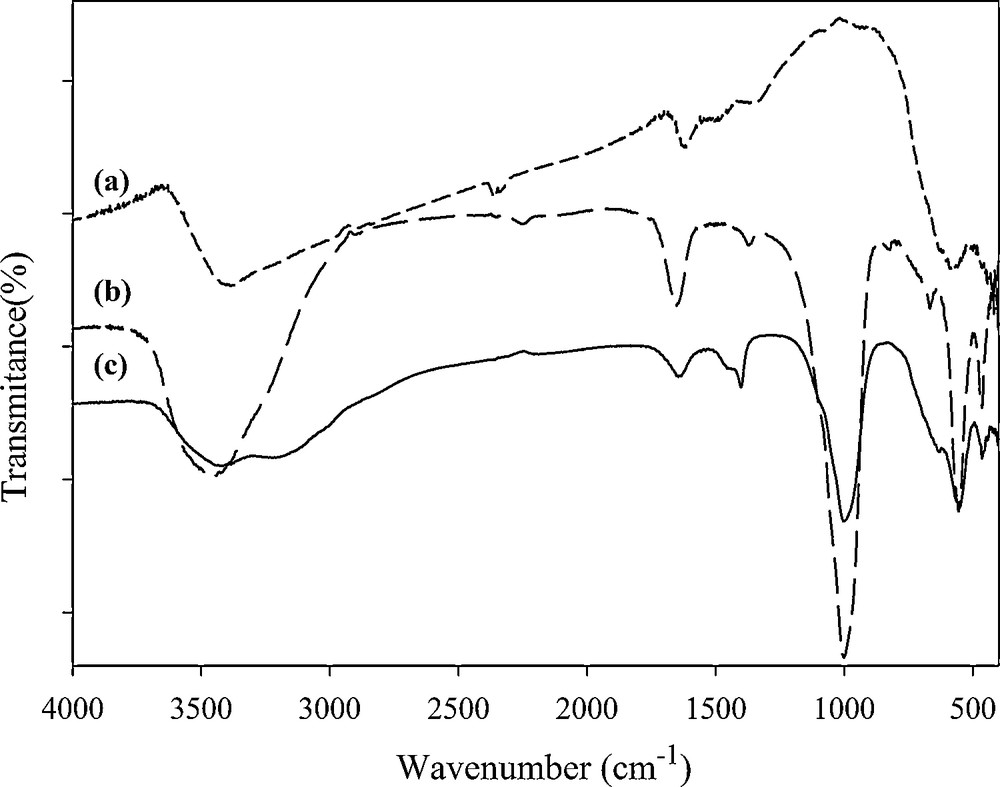
FT-IR spectra of magnetite (a), zeolite A (b) and magnetic zeolite composite (c).
In the thermal curves of zeolite A and MZC sample, the weight loss peak around 100 °C is attributed to the loss of adsorbed water (Fig. 3). Since the water molecules are bonded to different cations so, dehydration has taken place at two different temperatures. After 250 °C, the adsorbents exhibited no dehydration peak up to 800 °C, indicating that the adsorbents are thermally stable.
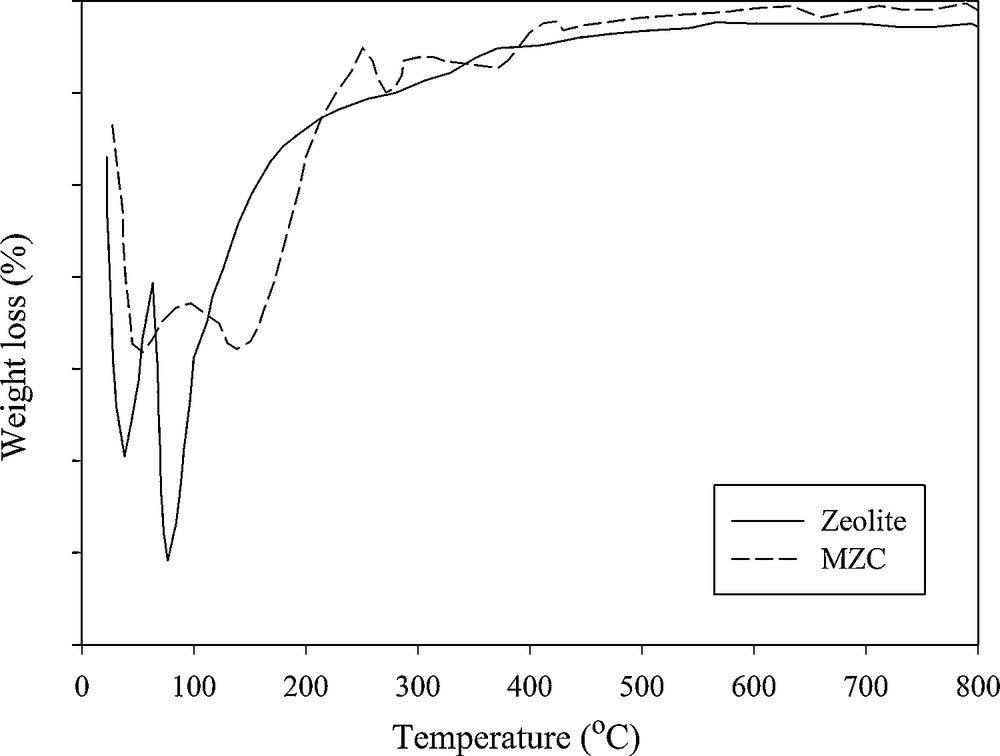
DTG curve of zeolite A and MZC.
In the SEM image of zeolite A, the presence of zeolite particles with homogenous morphology and particle size of about 2 μm was observed (Fig. 4a) In the composite image, the presence of magnetite nanoparticles on the surface of zeolite was observed (Fig. 4b).
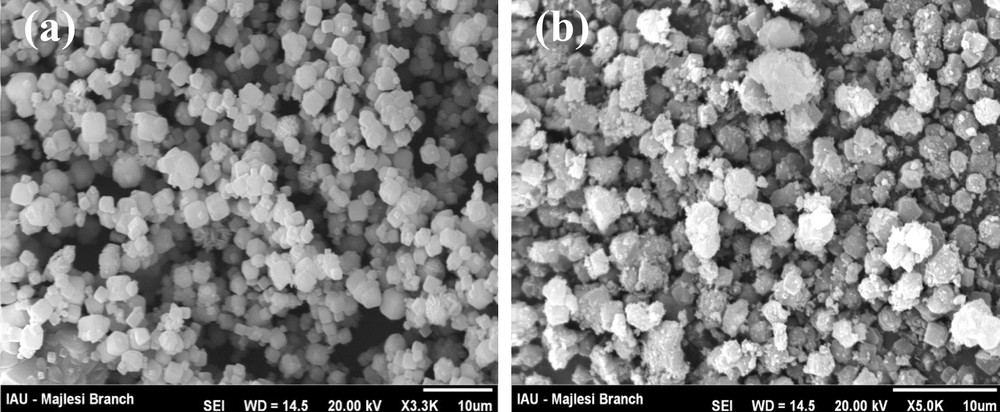
Scanning electron microscopy images of zeolite A (a) and magnetic zeolite composite (b).
3.2 Separation of the composite from the solution
One of the most important features of this composite is its magnetic properties that were characterized with the VSM method. Fig. 5 shows the magnetization curve of the composite (zeolite to iron oxide ratio of 3:1) at 298 K. When the external magnetic field intensity increased, the magnetization is increased and then saturation is occurred. By applying the reverse external magnetic field, the magnetization achieved the reverse saturation. The hysteresis loop of the composite showed a “S”-shaped curve with no remanence. Therefore, the MZC has good superparamagnetic properties and also when external magnetic field is removed, the composite particles can be redispersed quickly with shaking. The saturation magnetization value was 19.03 emu/g confirming that in practice, the composite can be easily separated with a permanent magnet. On the other hand, the adsorption capacity of the composite with different zeolite to iron oxide ratio is shown in Fig. 6. The adsorption capacity of MZC is decreased as the magnetite to zeolite ratio increased. Due to the desirable magnetic properties and adsorption capacity, the composite with zeolite to iron oxide ratio of 3:1 was used for adsorption experiments.
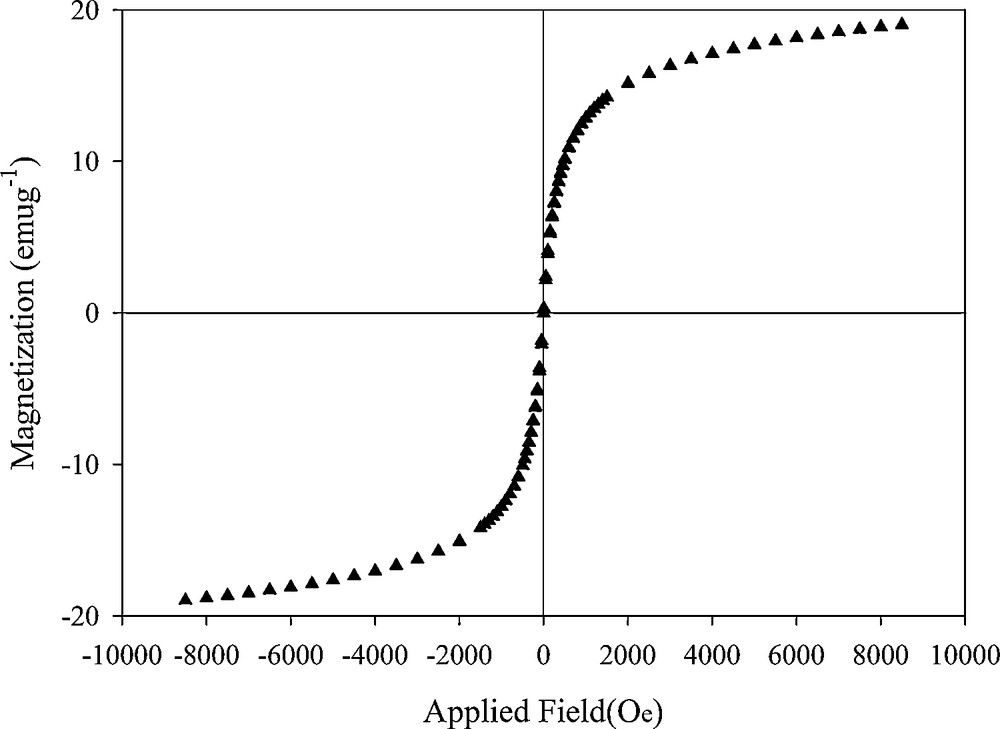
The hysteresis loops of magnetic zeolite A composite.
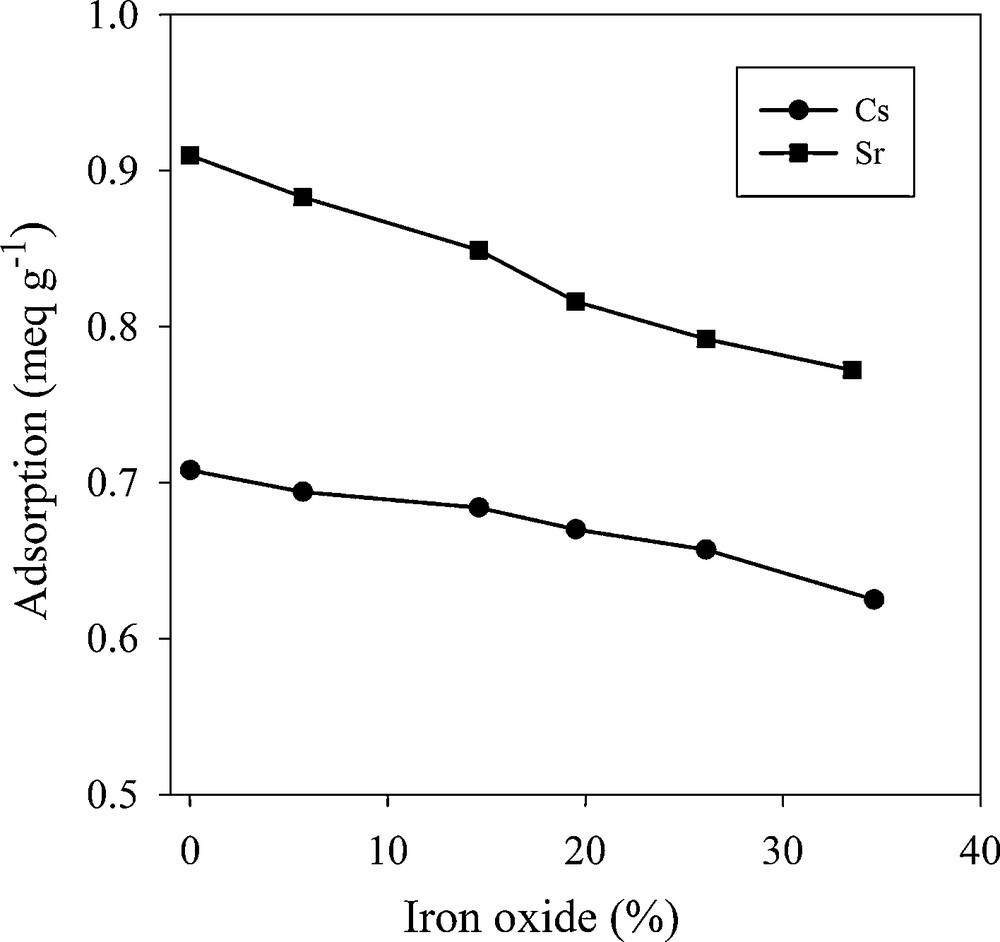
Uptake of Cs+ and Sr2+ by magnetic zeolite composite samples with different iron oxide contents.
3.3 Effect of pH
The effect of pH on Cs+ and Sr2+ removal by zeolite A and the composite is shown in Fig. 7. Adsorption capacity of both the adsorbents increased with increasing initial pH. The lower uptake in the acidic medium is attributed to the competition of hydronium ions with Cs+ and Sr2+ for the exchange sites. Since the magnetite particles act as weak acid or base, the pH of the solution has an extra effect on the sorption behavior of the MZC sample. By increasing the pH, the magnetite surface was deprotonated and the exchange capacity of the magnetite increased. The maximal adsorption was occurred at pH 8.
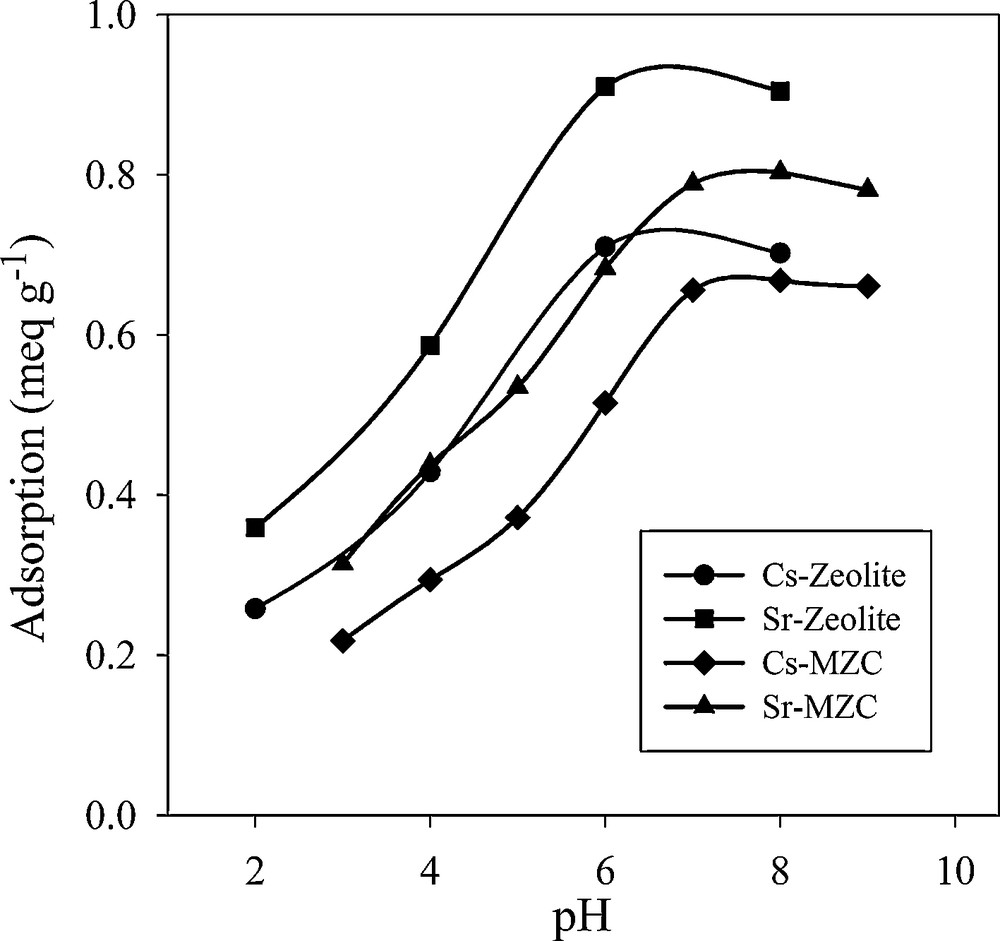
Effect of pH on adsorption of Cs+ and Sr2+.
3.4 Effect of contact time
The effect of contact time on the removal efficiency of Cs+ and Sr2+ is shown in Fig. 8. The adsorption was initially fast and then reached equilibration after 2 h. Between 80−90% of the maximal capacity was obtained within 30 min, indicating that the reaction is kinetically fast.
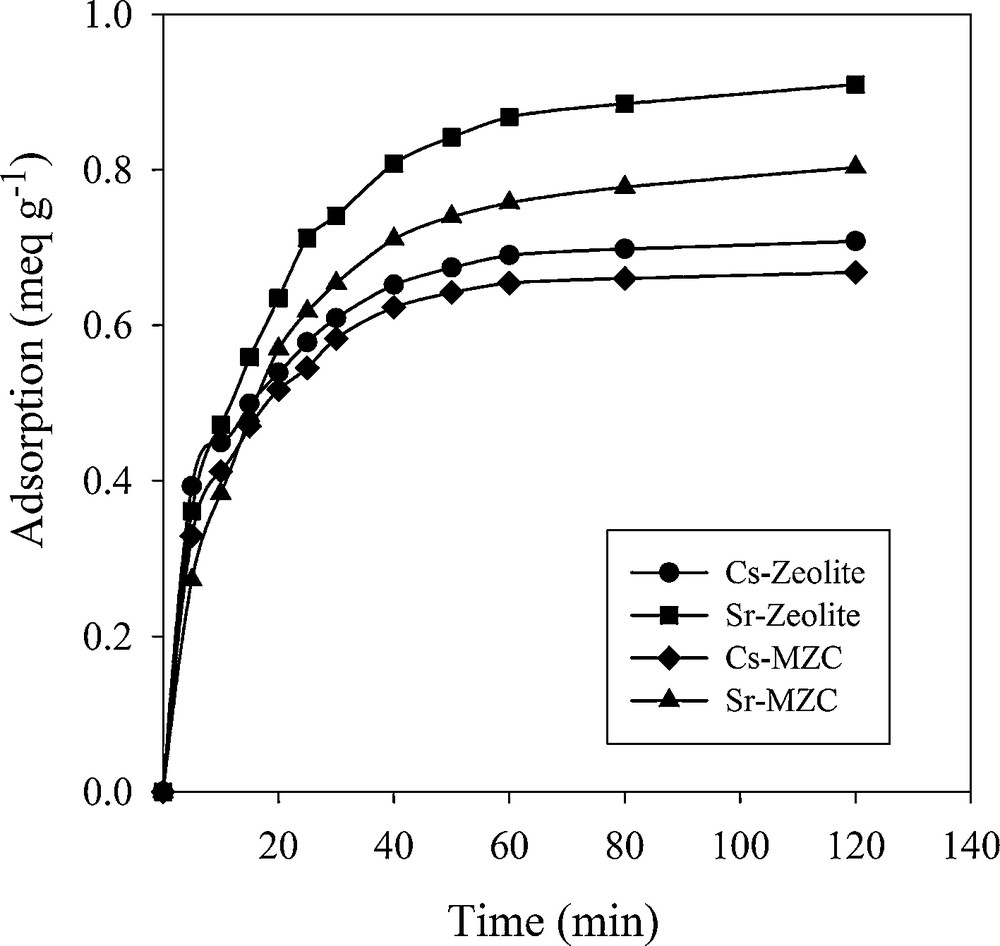
Effect of contact time on adsorption of Cs+ and Sr2+.
3.5 Kinetic sorption modeling
Four kinetic models, including the pseudo-first-order, pseudo-second-order, Elovich and intra-particle diffusion model, were examined for the evaluation of the experimental data. The linear form of Lagergren pseudo-first-order model is expressed as:
| (4) |
The results are listed in Table 3. Although the R2 have not extremely low values, calculated qe are not consistent with the experimental data. Therefore, the adsorption process does not follow a pseudo-first-order model. The linear form of pseudo-second-order kinetic model is written as:
| (5) |
Kinetic parameters of pseudo-first-order and pseudo-second-order kinetic models.
| Sorbents | Ions | qe(exp.) (× 10−1) (mmol/g) | Pseudo-first-order model | Pseudo-second-order model | |||||
| k1 (× 10−2) (min−1) | qe(theor.) (× 10−1) (mmol/g) | R2 | k2 (× 10−1) (g/mmol/min) | qe (× 10−1) (mmol/g) | h (× 10 −2) (mmol/g/min) | R2 | |||
| Zeolite A | Cs+ | 7.080 | 4.892 | 4.189 | 0.9923 | 2.047 | 7.507 | 11.54 | 0.9991 |
| Sr2+ | 4.548 | 4.313 | 3.166 | 0.9898 | 1.986 | 4.974 | 4.912 | 0.9990 | |
| MZC | Cs+ | 6.680 | 5.337 | 4.257 | 0.9885 | 2.106 | 7.123 | 10.68 | 0.9992 |
| Sr2+ | 4.013 | 4.168 | 2.830 | 0.9851 | 2.004 | 4.437 | 3.945 | 0.9990 |
and initial sorption rate can be obtained from:
| (6) |
Comparing of k2 values indicated that the adsorption of both ions onto MZC is faster than on zeolite A.
The relationship between the amount of adsorbed ions and the square root of time indicates the effect of the intra-particle diffusion on the overall rate of ion exchange. The intra-particle diffusion equation is expressed as:
| (7) |
| (8) |
Kinetic parameters of Elovich and intra-particle diffusion models.
| Sorbents | Ions | Elovich model | Intra-particle diffusion model | ||||
| α (×10−2) (mmol/g/min) | β (g/mmol) | R2 | Kdiff (× 10−2) (mmol/g/min) | C (× 10−2) (g/mmol) | R2 | ||
| Zeolite A | Cs+ | 71.80 | 8.853 | 0.9626 | 3.837 | 36.23 | 0.8566 |
| Sr2+ | 13.41 | 10.50 | 0.9654 | 3.214 | 16.35 | 0.8482 | |
| MZC | Cs+ | 45.89 | 8.540 | 0.9516 | 3.902 | 32.34 | 0.8147 |
| Sr2+ | 9.314 | 11.08 | 0.9595 | 3.019 | 12.86 | 0.8285 |
Comparison of calculated qe and the correlation coefficient for kinetic models evidence that pseudo-second-order has the best match with the experimental data. These results indicated that the overall sorption rate is controlled by the chemical sorption process [16]. The k2 values were selected for the evaluation of Ea using Arrhenius equation (Fig. 9).
| (9) |
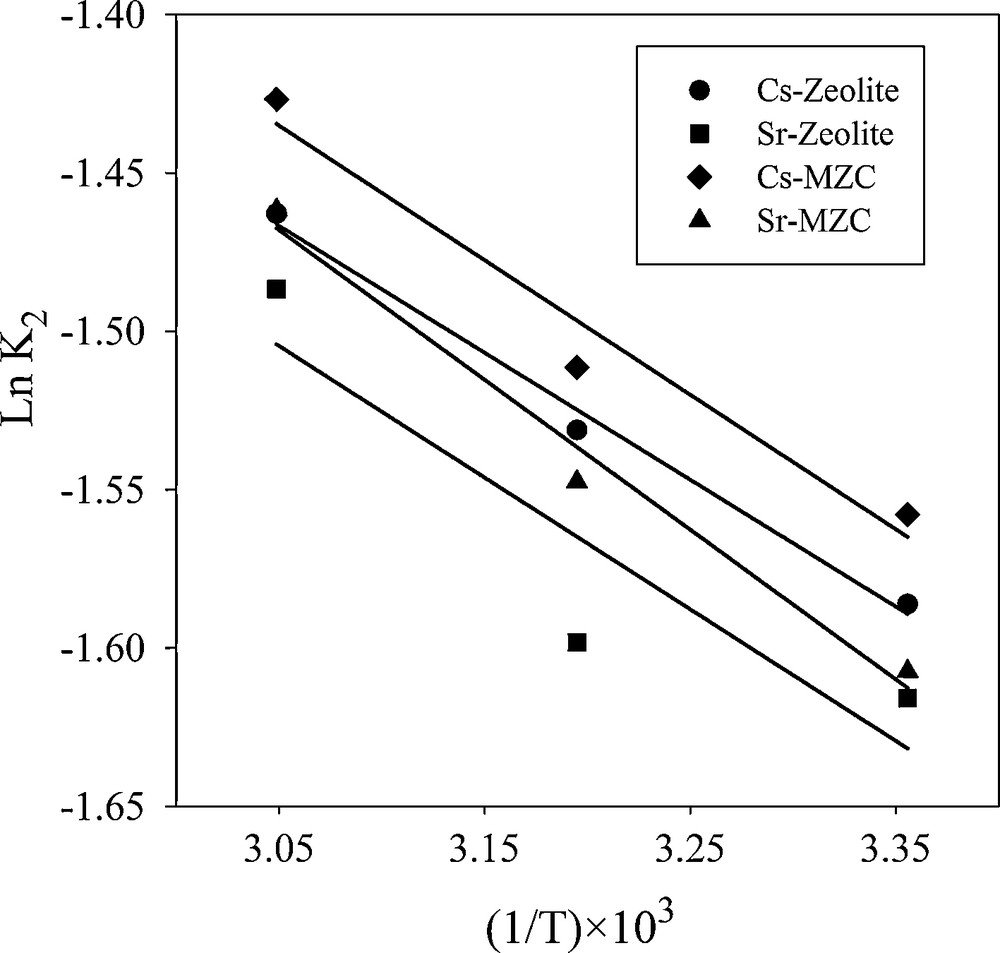
Arrhenius plot for the adsorption of Cs+ and Sr2+.
The calculated data are represented in Table 5. The values of Ea was less than 42.0 J/mol, suggesting that the adsorption of Cs+ and Sr2+ proceeded with a low potential energy [17].
Thermodynamic parameters of Cs+ and Sr2+ adsorption.
| Sorbents | Ions | Ea (kJ/mol) | ΔH° (kJ/mol) | ΔS° (kJ/mol/K) | ΔG° (kJ/mol) | |||
| 298(K) | 313(K) | 328(K) | 343(K) | |||||
| Zeolite A | Cs+ | 3.332 | 3.744 | 0.0581 | −13.57 | −14.44 | −15.31 | −16.18 |
| Sr2+ | 3.456 | 11.52 | 0.0963 | −17.17 | −18.62 | −20.07 | −21.51 | |
| MZC | Cs+ | 3.532 | 3.298 | 0.0551 | −13.12 | −13.95 | −14.77 | −15.60 |
| Sr2+ | 3.933 | 8.133 | 0.0771 | −14.84 | −16.00 | −17.16 | −18.31 |
3.6 Sorption thermodynamics
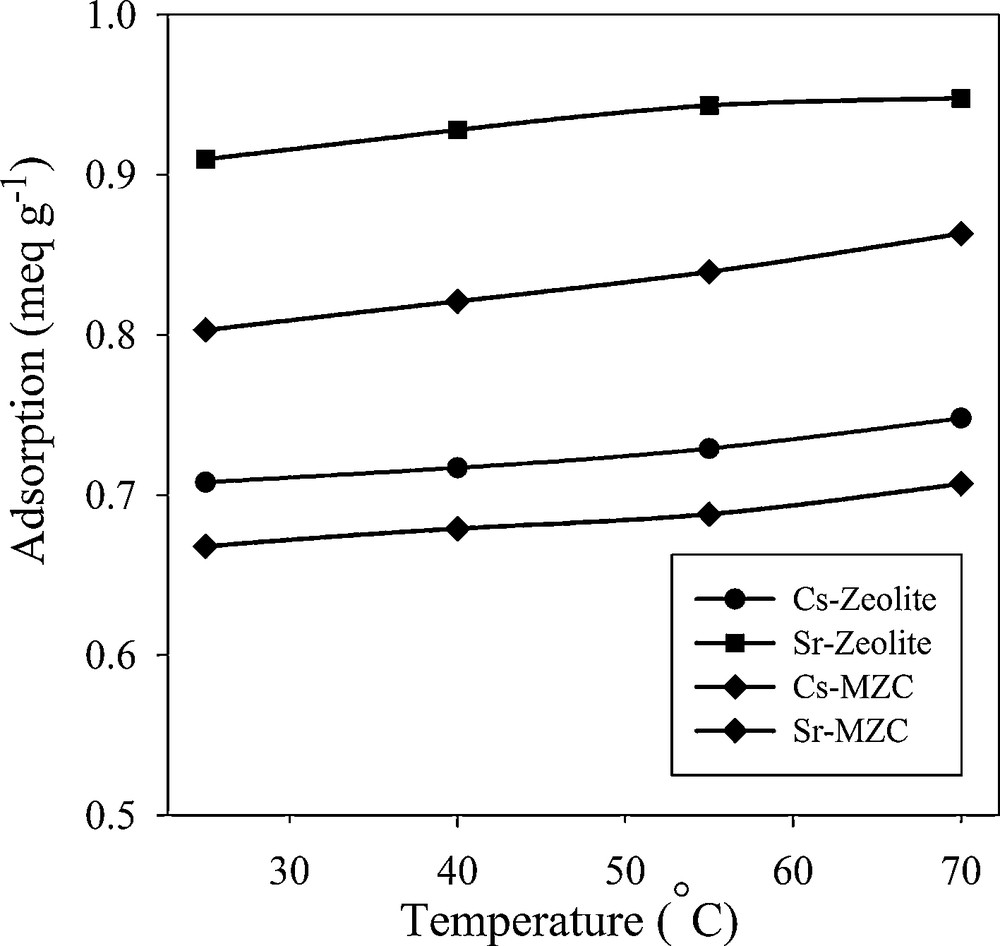
The effect of sorption temperature on the removal of Cs+ and Sr2+ was studied in the temperature range from 298 to 343 K (Fig. 10). Adsorption capacity increased with increasing temperature. Thermodynamic parameters, including enthalpy change (ΔH°) and entropy change (ΔS°) can be obtained using Vant Hoff equation.
| (10) |
Effect of temperature on adsorption of Cs+ and Sr2+.
A plot of ln kd versus 1/T is shown in Fig. 11. The free energy change of the adsorption (ΔG°) is calculated from:
| (11) |
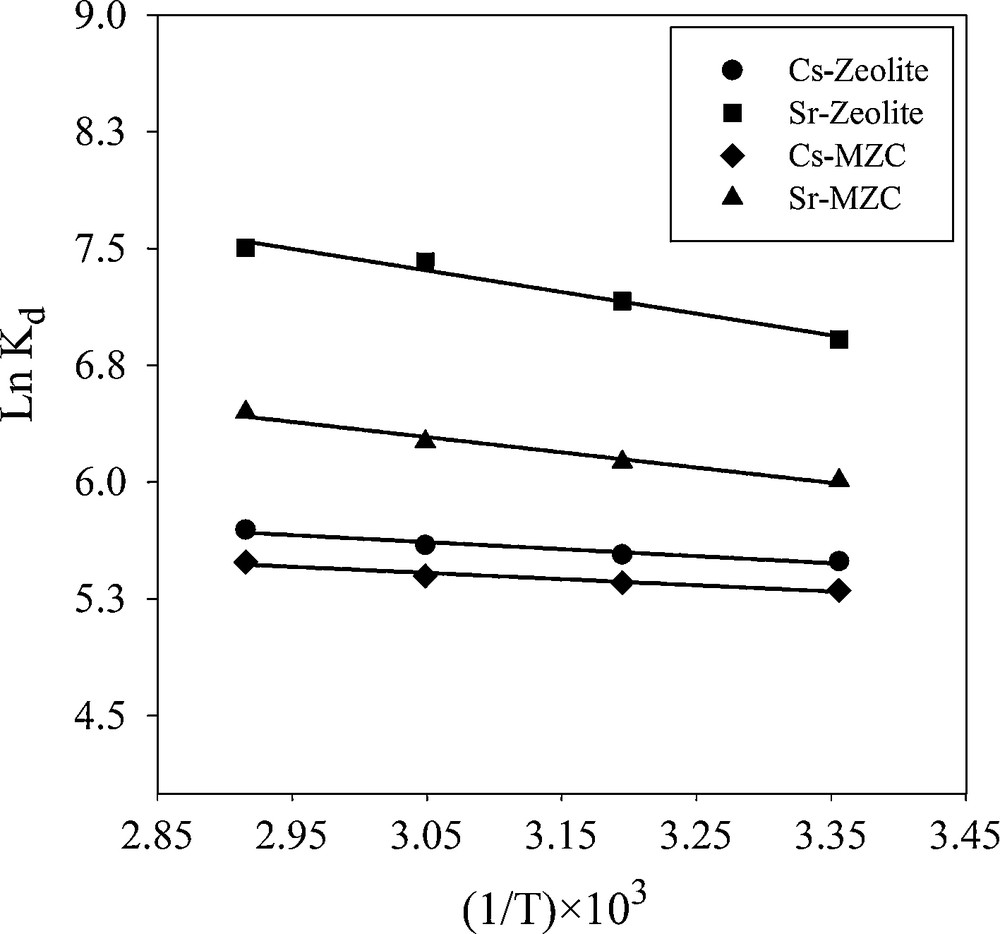
Van’t Hoff plot for adsorption of Cs+ and Sr2+.
The calculated thermodynamic parameters are summarized in Table 5. Since ΔH° values are positive the adsorption process is endothermic in nature. The positive values of ΔS° suggested that the randomness at the solid−solution interface increases during the sorption process. The negative values of ΔG° indicated that the Cs+ and Sr2+ adsorption reaction is spontaneous. A decrease in ΔG° values with an increasing temperature showed that the spontaneous nature of sorption is directly proportional to temperature. Therefore, the adsorption process is favored when temperature is increased. The absolute value of ΔG° for Sr2+ adsorption is higher than the values for Cs+ adsorption, indicating that the sorption of Sr2+ is more favorable than that of Cs+.
3.7 Sorption isotherm
In order to investigate the effects of initial concentration, Cs+ and Sr2+ solution with various concentrations were equilibrated with a constant amount of adsorbents (Figs. 12 and 13). The initial fast adsorption was followed by a slow approach to equilibrium in higher concentration. Three isotherm models, including Langmuir, Freundlich and Dubinin–Radushkviech (D–R) models were used to examine the experimental data.
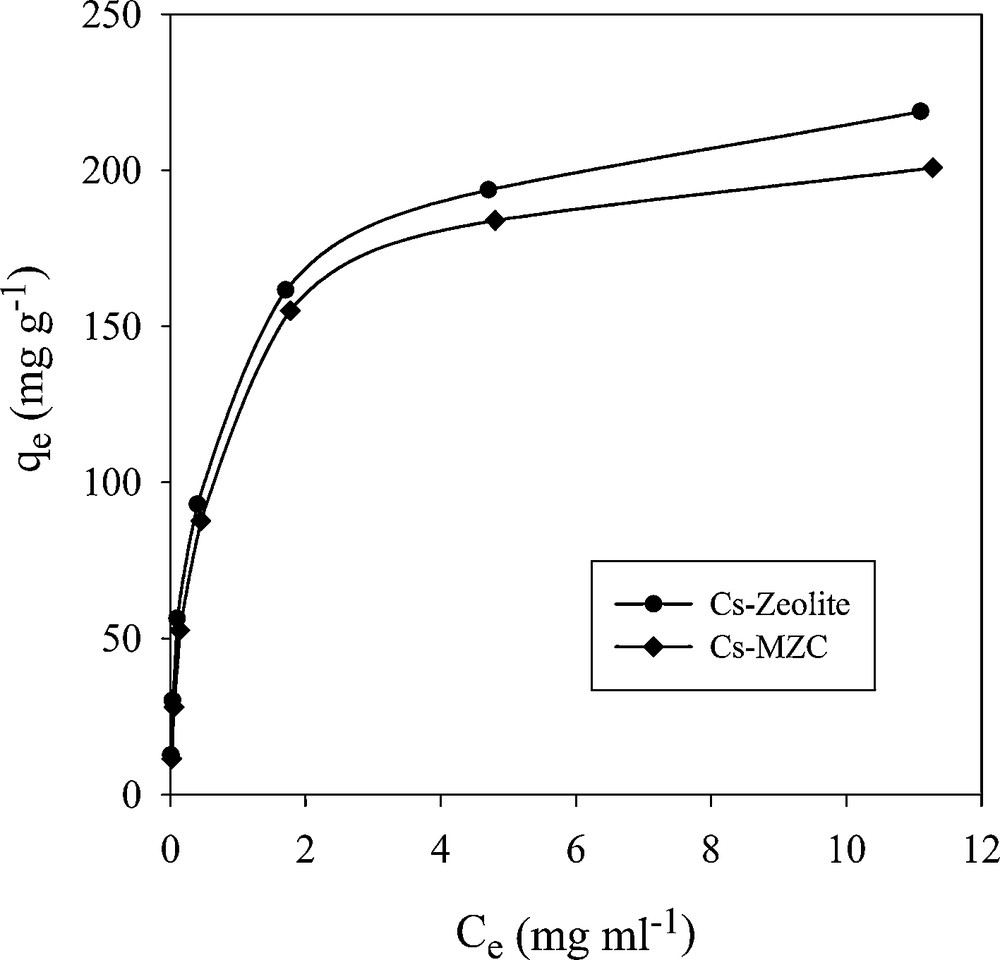
Effect of initial concentration of Cs+ on adsorption capacity.
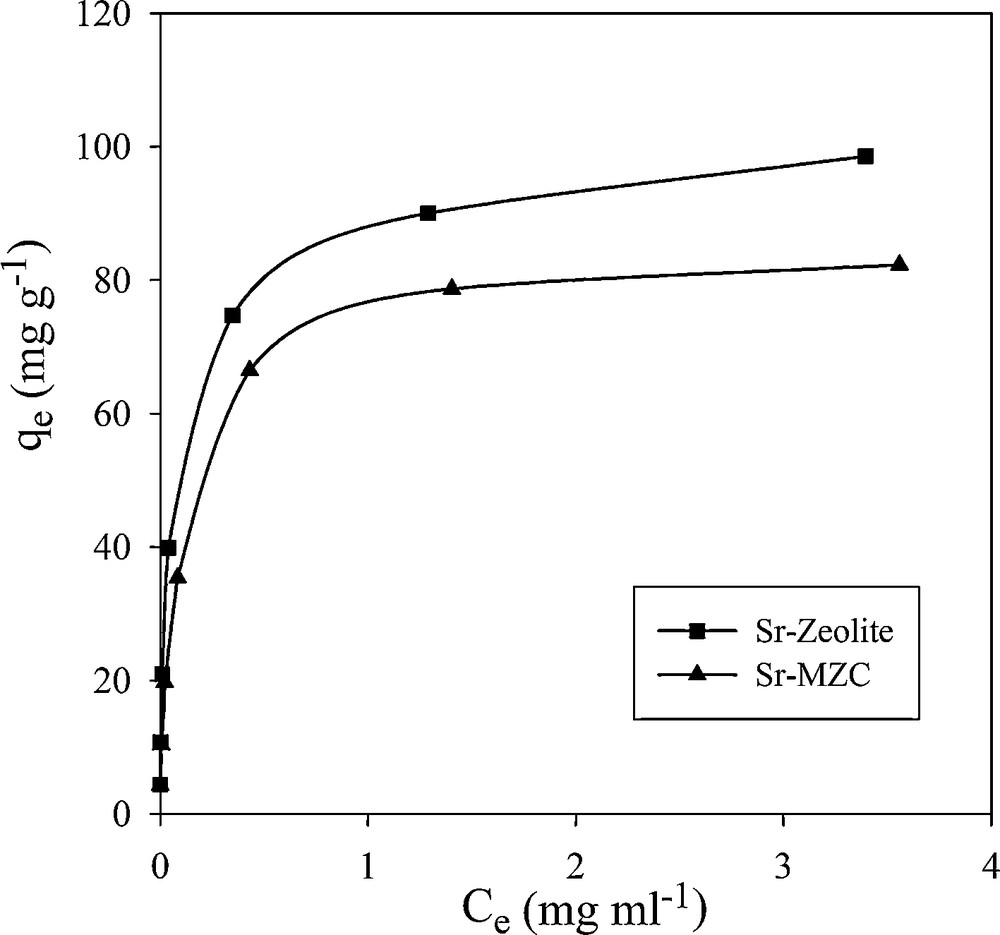
Effect of initial concentration of Sr2+ on adsorption capacity.
3.7.1 Langmuir isotherm model
Langmuir isotherm assumes that the sorption occurs at specific homogeneous sites within the adsorbent. This model is expressed by:
| (12) |
| (13) |
Adsorption isotherm parameters for Cs+.
| Isotherm | Sorbents | Model parameters | |||
| Q0 (mg/g) | b × 103 (L/mg) | RL×103 | R2 | ||
| Langmuir | Zeolite A | 222.9 | 2.569 | 28.45 | 0.9965 |
| MZC | 207.4 | 2.161 | 33.64 | 0.9988 | |
| Model parameters | |||||
| n | Kf (mg/g) | R2 | |||
| Freundlich | Zeolite A | 2.611 | 7.907 | 0.9664 | |
| MZC | 2.304 | 4.843 | 0.9376 | ||
| Model parameters | |||||
| β × 10−9 (mol2/kJ2) | qm (mmol/g) | E (kJ/mol) | R2 | ||
| Zeolite A | 5.127 | 2.094 | 9.875 | 0.9990 | |
| MZC | 6.375 | 2.230 | 8.856 | 0.9901 |
Adsorption isotherm parameters for Sr2+.
| Isotherm | Sorbents | Model parameters | |||
| Q0 (mg/g) | b × 103 (L/mg) | RL × 103 | R2 | ||
| Langmuir | Zeolite A | 99.11 | 18.32 | 12.31 | 0.9985 |
| MZC | 83.68 | 13.86 | 16.20 | 0.9993 | |
| Model parameters | |||||
| n | Kf (mg/g) | R2 | |||
| Freundelich | Zeolite A | 2.985 | 8.629 | 0.9665 | |
| MZC | 2.702 | 5.17 | 0.9637 | ||
| Model parameters | |||||
| β × 10−9 (mol2/kJ2) | qm (mmol/g) | E (kJ/mol) | R2 | ||
| D–R | Zeolite A | 3.814 | 1.367 | 11.45 | 0.9964 |
| MZC | 4.615 | 1.226 | 10.41 | 0.9951 |
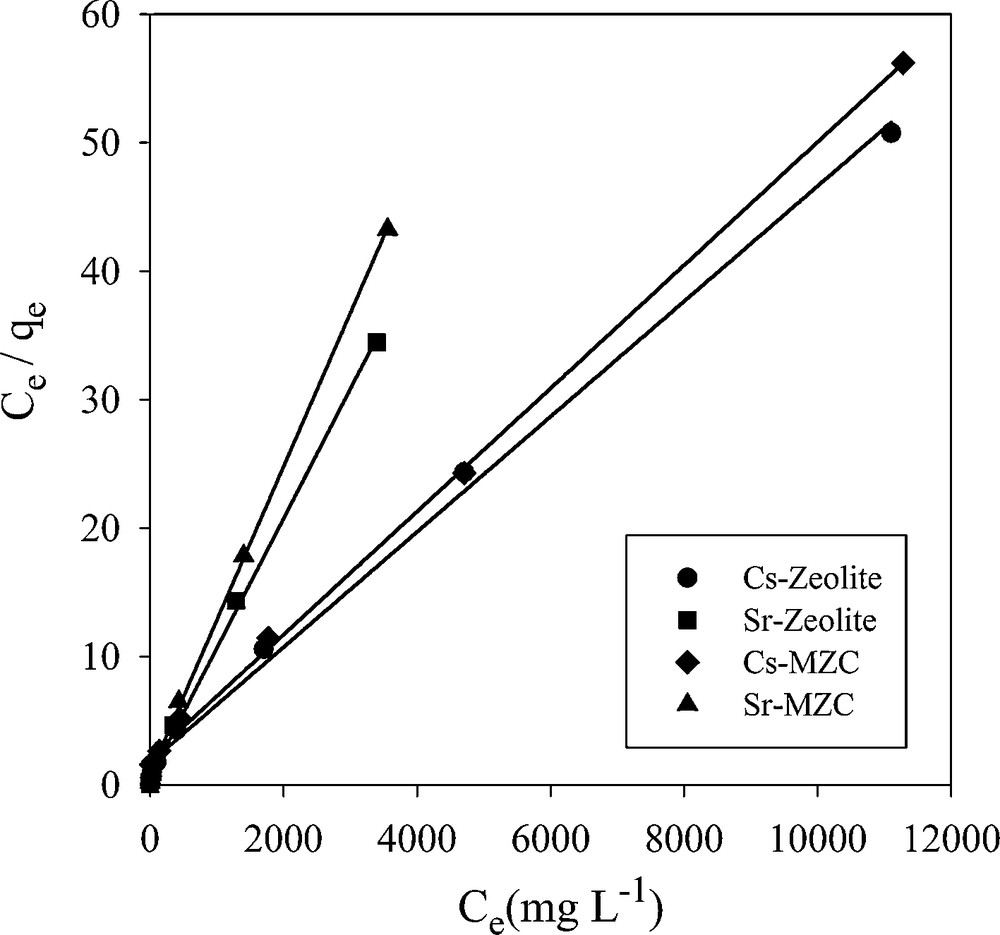
Langmuir isotherm plots for adsorption of Cs+ and Sr2+.
The maximum adsorption capacities of MZC for the removal of Cs+ and Sr2+ have been compared with some adsorbents reported in the literature (Table 8). It can be seen that the MZC exhibit high adsorption capacity for these ions. On the other hand, the magnetic composite was easily separated from the solution by a permanent magnet.
3.7.2 Freundlich isotherm model
Freundlich isotherm model makes the assumption that multi-layer sorption occurs at a heterogeneous surface. This model was used to estimate the intensity of the adsorption process and relative sorption capacity. The linear form of the Freundlich equation is shown as:
| (14) |
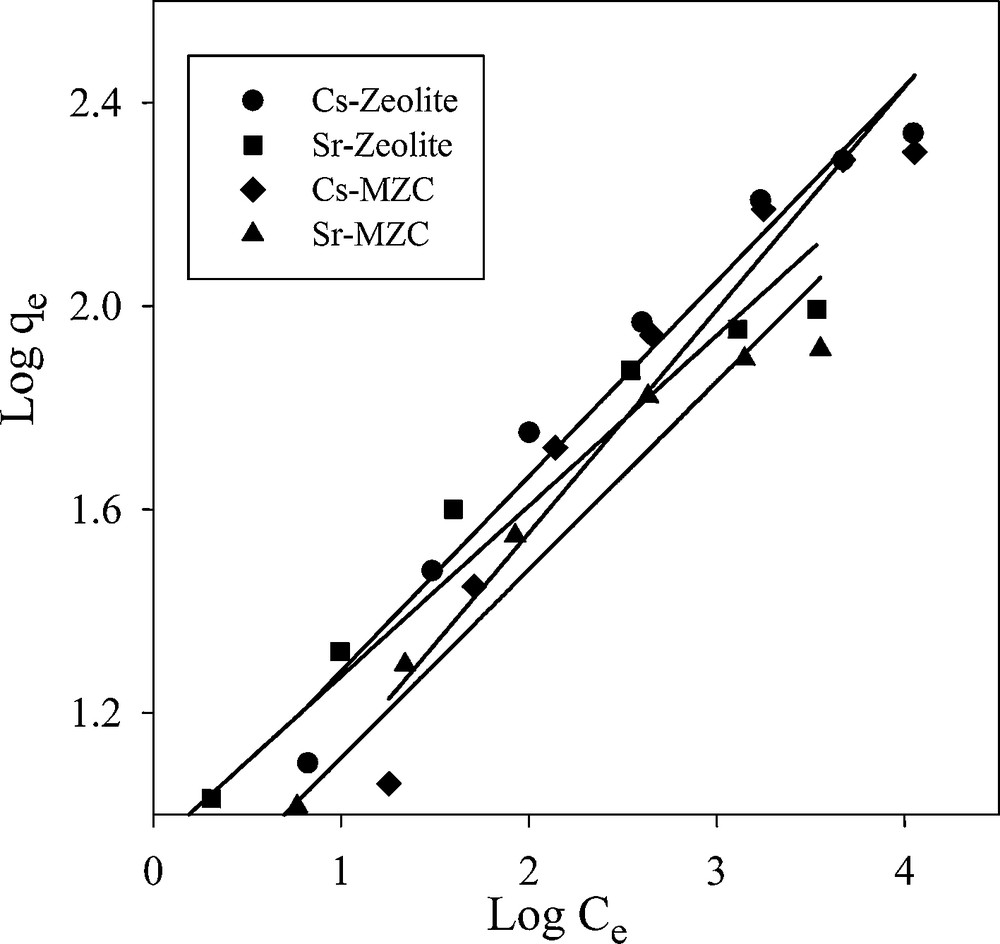
Freundlich isotherm plots for adsorption of Cs+ and Sr2+.
3.7.3 Dubinin–Radushkviech isotherm model
D–R isotherm was used to distinguish between the physical and chemical adsorptions of ions and to estimate the apparent free energy of adsorption. This equation is given as follows:
| (15) |
| (16) |
| (17) |
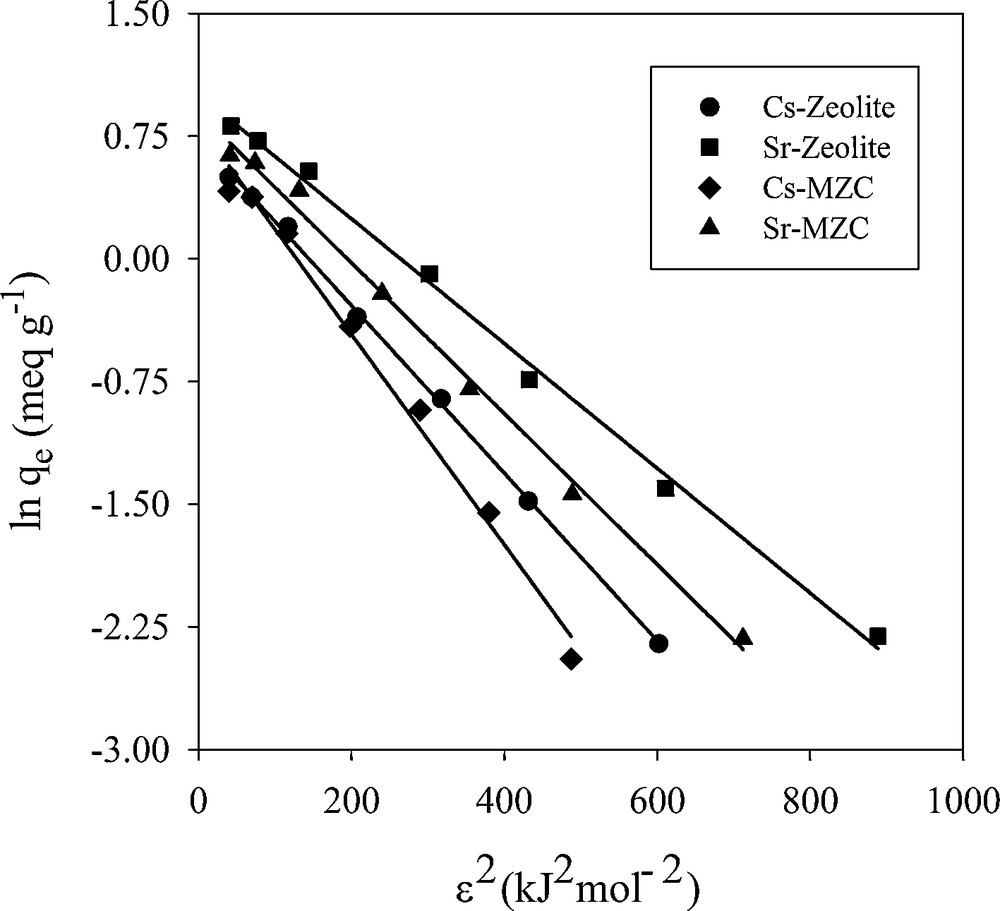
Dubinin–Radushkviech isotherm plots for adsorption of Cs+ and Sr2+.
4 Conclusion
A nanomagnetite−zeolite composite was synthesized, characterized and evaluated for the removal of Cs+ and Sr2+ from aqueous solutions. Characterization results indicated that the crystal structure of zeolite A was well obtained and remained unchanged during the composite preparation. The magnetic composite with 25% iron oxide had a saturation magnetization value of 19.03 emu/g; therefore, it can be separated efficiently from the solution by fast and simple magnetic separation process. The kinetic studies revealed that all sorption process followed the pseudo-second-order model; therefore, the overall rate of adsorption processes was controlled by ion exchange. The rate constant values for sorption by MZC are greater than the values obtained for zeolite A, indicating a faster kinetic sorption by the composite. The equilibrium adsorption data are fitted to three isotherm models, Langmuir, Freundlich and D–R isotherm. The obtained RL values were in the range of 0–1 indicating that Cs+ and Sr2+ adsorption was favorable. Calculated thermodynamic parameters indicated that Cs+ and Sr2+adsorptions are endothermic and spontaneous.
Acknowledgments
Financial support of this work by Center of Excellence of Chemistry and Research Council of University of Isfahan is gratefully appreciated.