

1 Introduction
With increasing industrial activities, a large amount of waste and run-off from the industries enters the environment and causes serious health problems. Chromium is one of the hazardous element that is widely released into the environment from leather tanning, cement, plastic, metallurgical, textile, batteries, refractories, pigment, welding, stainless steel, ceramic, catalysis, wood preservatives, electroplating, photography, galvanometric, metal cleaning, and mining industries [1,2]. Although chromium has several oxidation states, from −2 to +6, Cr(VI) it is more soluble, toxic, carcinogenic, and non biodegradable. Moreover, as a mutagenic agent, it causes serious health problems such as dermatitis, allergic sensitization, stomachache, nausea, vomiting, severe diarrhea, hemorrhage, epigastric pain liver, kidney and respiratory damages, and gastrointestinal ulcers [3–5]. Based on the pH of the solutions, Cr(VI) exists as different species such as chromates (CrO42−), dichromates (Cr2O72−), and bichromates (HCrO4-) [6].
Various conventional techniques have been employed to remove chromium from wastewaters including precipitation [7], ion exchange [8], ultrafiltration [9], flotation [10], reverse osmosis [11], electrochemical [12], and coagulation [13]. These methods generally suffer from disadvantages such as cost, production of chemical sludge [14], and harmful chemicals as a secondary pollutant [15]. Adsorption is the most favorite and feasible technique for the separation of pollutants owing to its high efficiency, selectivity, low-cost, and easy handling [16].
Different adsorbents such as resins [17], goethite [18], zeolite [19], MCM-41 [20], clay [21], and gamma Al2O3 [22] have been employed for the removal of chromates. The use of biosorbents has been enhanced in recent days in plant species such as walnut shells [23], pine cone [24], oak shell [25], and maize spatha [26].
Nevertheless, many concerns have arisen for the discharge of toxic metals from industries into the environment such that intensive studies are underway to develop cost-effective adsorbents using environmentally friendly biomaterials for the removal of heavy metals from liquid wastes.
Many researchers developed production of activated carbons to reduce the preparation cost of the adsorbent. Activated carbons (AC) have unique properties such as high porosity, large surface areas, and functionalized surface. They are prepared economically and their efficiency can be readily improved via the chemical modification [27,28]. Although the reactivity of the nano-sized adsorbents is higher than their micro-sized counterparts, their separation from the solution is incomplete, tedious, and time-consuming. One way to eliminate the separation difficulties is to consider the magnetization of adsorbents by iron oxide.
In this research, a biosorbent was prepared using an oak shell obtained from local agricultural waste materials. It was magnetized using Fe3O4, functionalized with dithizone, and then impregnated with particular cations. The cation-loaded adsorbents were used for the removal of chromate anions from aqueous solutions under different experimental conditions.
2 Experimental
2.1 Materials and methods
Analytical grade reagents were provided from Merck Company. Stock solutions of cations were prepared by dissolving appropriate amount of nitrate salt in de-ionized water. The chromium stock solution was prepared by dissolving accurately weighed amount of potassium dichromate into deionized water. Characterization of the samples was performed by using different techniques including a scanning electron microscope (MIRA3LMU model, TESCAN Company), X-ray diffraction system (PANalytical model X'Pert PRO), Fourier transforms infrared spectrometer (FTIR Perkin–Elmer 65), and thermal analyzer (TG-DTG) (NETZSCH STA 409 PC/PG), VSM (LDJ Electronics Inc., Model 9600). The concentration of cations was measured using an atomic absorption spectrometer (Shimadzu Elmer Perkin devices 300 Analyst model A). Chromate concentration was measured using the HPLC method by using an Agilent Technologies 1200 Series instrument with a Quaternary pump, column XDB-C18 (L= 25 cm, id = 4.6 mm and particle size= 5 μm, Injected and detected volumes: 5 μL, flow rate: 1 mL min−1).
2.2 Preparation, magnetization and functionalization of activated carbons
Activated carbon (AC) was prepared by the carbonization of oak shell waste materials collected from Zagros forests, Kohmareh Sorkhi region, Fars, Iran. The process was executed in a quartz tube furnace under a N2 atmosphere. The AC was then treated, respectively, with hydrochloric acid, and nitric acid to remove remaining organic matters and to increase the surface functional groups. The acid treated sample was denoted as AC-COOH. The acid treated AC was magnetized using Fe3O4 nanoparticles synthesized in the presence of activated carbon under alkaline conditions and inert atmosphere. 0.21 g of FeSO4·7H2O and 0.31 g of FeCl3·6H2O were dissolved in 8.0 mL of de-ionized water and 1.0 mL of ammonium hydroxide solution (25%, w/v) was added dropwise to the solution. 1.0 g of AC–COOH was then added and the mixture was vigorously stirred for 30 min at 80 °C. The mixture was cooled down to room temperature and the solid was removed and washed repeatedly with distilled water until the pH of filtrate was 5–6. The magnetized activated carbon (AC–Fe3O4) was dried and stored in desiccators [29]. To increase the selectivity and capacity of the adsorbent, the magnetic adsorbent was functionalized using dithizone. For functionalization, AC-Fe3O4 was first reacted with thionyl chloride to produce acyl chloride (AC-COCL) which then was reacted with dithizone solution. The functionalized adsorbent (AC-Fe3O4-DTZ) was magnetically separated, thoroughly washed with DMF, ethanol and diethyl ether, respectively, and dried at 70 °C for 8 h [25,30].
2.3 Confinement of AC-Fe3O4-DTZ with Pb2+, Ag+, Ba2+and Sr2+cations
To study the performance of AC-Fe3O4-DTZ for consecutive removal of the studied cations and chromate anions, the adsorption capacity of the sorbent towards the cations was firstly measured, and then the cation-loaded adsorbents were employed for the removal of chromate from aqueous solutions. To evaluate the capability of the adsorbent for the uptake of cations, in a series of experiments 0.1 g of the functionalized adsorbent was equilibrated with 25 mL of Pb2+, Ag+, Ba2+, Sr2+ solutions having different concentrations (100–5000 mg L−1). The pH of the solution was adjusted to 6.5 and the mixture was shaken for 7 min until the equilibration was established. The adsorbent was separated by a magnet bar placed outside of the reaction vessel and the concentration of the cation in the remaining solution was measured by an atomic absorption method. The amount of the adsorbed cation was calculated by the following equation:
| (1) |
Various samples with different cation loading.
| Cation | Sample designation | Cation conc. (mg L−1) | Adsorbed cation (meq g−1) |
| Pb2+ | Pb-ads-1 | 50 | 0.11 |
| Pb-ads-2 | 100 | 0.23 | |
| Pb-ads-3 | 1000 | 1.08 | |
| Pb-ads-4 | 4000 | 2.44 | |
| Ag+ | Ag-ads-1 | 50 | 0.06 |
| Ag-ads-2 | 100 | 0.21 | |
| Ag-ads-3 | 1000 | 0.47 | |
| Ag-ads-4 | 4000 | 0.98 | |
| Ba2+ | Ba-ads-1 | 50 | 0.05 |
| Ba-ads-2 | 100 | 0.07 | |
| Ba-ads-3 | 1000 | 0.44 | |
| Ba-ads-4 | 4000 | 1.04 | |
| Sr2+ | Sr-ads-1 | 50 | 0.04 |
| Sr-ads-2 | 100 | 0.08 | |
| Sr-ads-3 | 1000 | 0.08 | |
| Sr-ads-4 | 4000 | 0.99 |
2.4 Chromate adsorption
The cation-loaded adsorbents prepared in the previous section were employed for the adsorption of chromate from aqueous solutions. The adsorption performance of the samples towards CrO42− was examined by putting known amount (0.7, 1.7, 1.8 and 2.2 g) of each biosorbent confined with Pb2+, Ag+, Ba2+, Sr2+ in contact with 25 mL of chromate solutions. The mixture was shaken for 10 min, the adsorbent was magnetically removed and the chromate concentration in the remaining solution was measured by a HPLC method. The effect of chromate concentration (100–5000 mg L−1), contact time (3–14 min), adsorbent dose (0.1–2.6 g), and effect of pH (5–10) on the uptake of chromate was evaluated. The selectivity of the adsorbent in the presence of different anions was also studied. For each cation, four samples with different cation loadings were used.
3 Results and discussion
3.1 Characterization of the adsorbent
Characterization of the adsorbent was performed by the methods described in the previously published study [25]. In the FTIR spectrum of the AC sample, the adsorption band at 3435 cm−1 was attributed to the OH stretching of water molecules and the peaks at 3038, 1798 and 1568 cm−1 were referred to CH stretch, CO stretch, and CC stretch, respectively. The absorption bands at 1201 and 1252 cm−1 are referred to the CO asymmetric stretch. The peaks at 472, 713, 782 and 876 corresponded to the CH bond. The band at 1026 was attributed to the CO stretch (Fig. 1a).
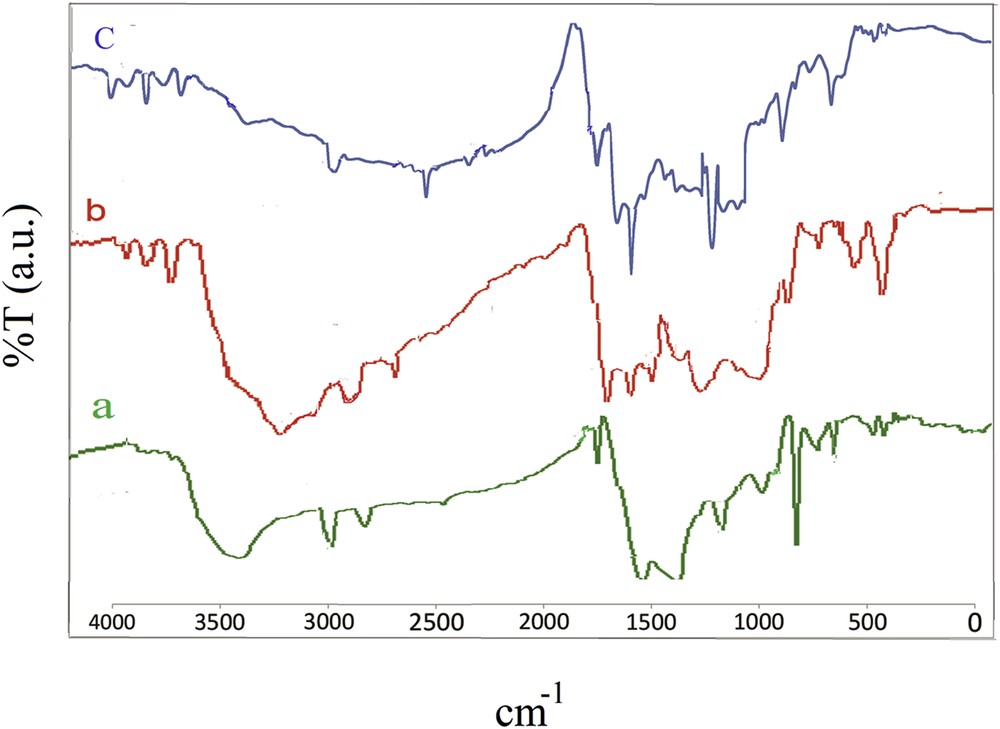
FTIR spectra of AC (a), AC-COOH (b) and AC-Fe3O4-DTZ (c).
In the FTIR spectrum of the AC-COOH sample, the absorption bands at 3072 and 3975 cm−1 referred to the OH stretch. The band appeared at 2893 cm−1 corresponded to CH stretching. Aromatic CC ring stretching was observed at 1432–1667 cm−1. The peak at 1709 was attributed to the CO stretch. The CO stretch was appeared at 1062 and 1165 cm−1. The bands at 610–700 cm−1 were assigned to the ≡CH group (Fig. 1b).
In the FTIR spectrum of AC-Fe3O4-DTZ, the characteristic absorption bands appeared at 1706 and 1654 cm−1 corresponded to the stretching of the carbonyl group and the bands at 3745, 2877 and 1096 cm−1 belonged to the stretching of the hydroxyl group. The bands observed at 3323 and 1586 cm−1were attributed to the stretch of NH groups of amines and the bands at 1248 cm−1 corresponded to the stretch of CN. The bands appeared at 1162 and 811 cm−1 assigned to the stretching of CS and CS, respectively. The FeO band appeared at 661 cm−1. The characteristic bands of DTZ observed at 762, 1380, 1432, and 1529 cm−1 were attributed to the benzene ring stretching modes [31]. From the absorption bands appeared in the FTIR spectrum of the sample, it was concluded that dithizone was successfully immobilized on the surface of the biosorbent. The absorption band belonged to FeO was appeared at 573 cm−1 in the magnetic biosorbent (Fig. 1c).
From the SEM image of the acid treated activated carbon, it was obvious that the surface of the adsorbent was rough and highly porous with wide cavities and pores throughout the sample. This indicated that during the acid treatment, the impurities and soluble compounds were dissolved leading to the creation of wider and deeper pores and channels (Fig. 2).
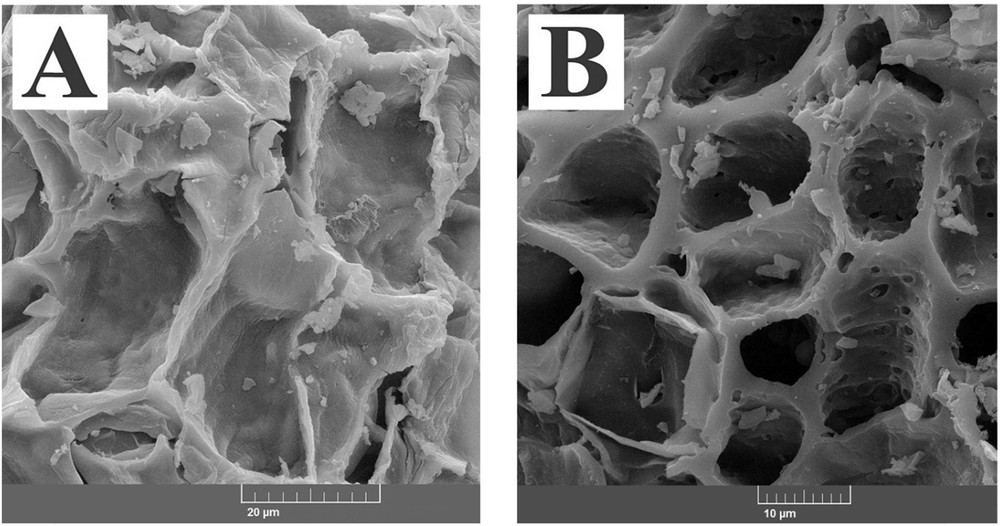
SEM images of activated carbons treated with HNO3 (A) and AC-Fe3O4-DTZ sample (B).
In the SEM image of AC-Fe3O4-DTZ, due to the immobilization of Fe3O4 and dithizone on the surface of the adsorbent, the roughness of the surface was significantly decreased. The pore diameter of the samples was determined using Digmaizer software. The average pore diameters of AC-COOH and AC-Fe3O4-DTZ samples were, respectively, 29.8 and13.5 μm.
The XRD patterns of AC-Fe3O4-DTZ represented in Fig. 3 showed that wide and strong background diffractions were appeared at 24 and 45° confirming the amorphous nature of the sample. The characteristic diffraction lines of dithizone at 8, 10, 15, 18, 20, 22, and 25° were properly overlapped by diffraction bands of activated carbon (Fig. 3d). The most intensive characteristic line of Fe3O4 at 37.5° (Fig. 3c) was also properly overlapped by the diffraction band of activated carbon [32,33]. The small peak at 60° was referred to Fe3O4. The other diffraction lines of Fe3O4 were covered by the second diffraction band of activated carbon. The EDAX analysis showed that the Fe3O4 content of the sample was about 1%, and lower than the detection limit of the XRD method, resulting the absence of some diffraction lines of this component.
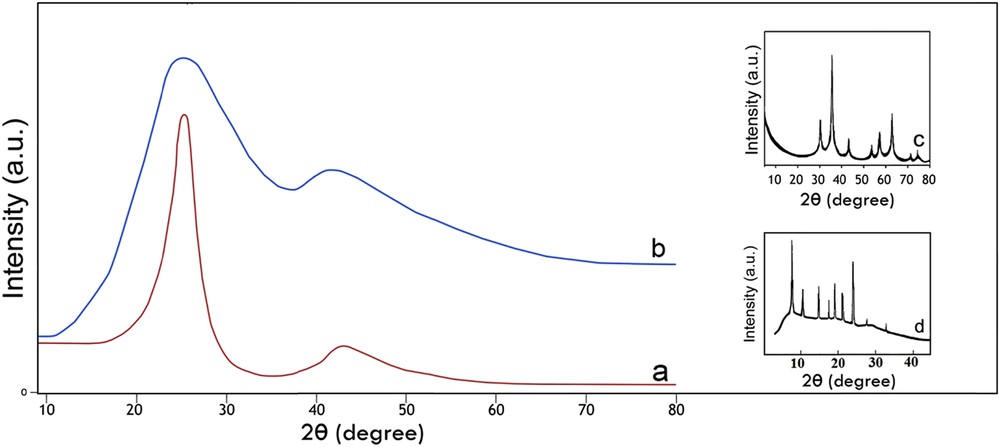
XRD patterns of AC (a), AC-Fe3O4-DTZ (b), Fe3O4 (c) and DTZ (d).
The surface chemical composition of AC-Fe3O4-DTZ determined by EDAX is illustrated in Fig. S1. Carbon, nitrogen, oxygen, sulfur, and iron were recognized as the major constituent elements which arederived, respectively, from activated carbon, dithizone and Fe3O4. The elemental mappings indicated the uniform distribution of the element on the surface of the adsorbent (Fig. 4).
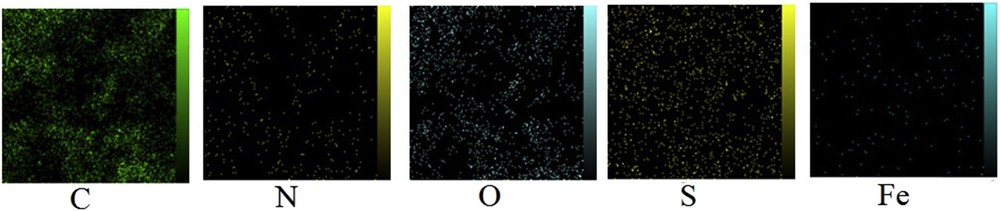
Map of element of AC-Fe3O4-DTZ obtained by EDAX method.
The magnetization curve of AC-Fe3O4-DTZ obtained using a Vibrating Sample Magnetometer (VSM) represented in Fig. 5. The magnetic properties of the sample were low (<10 emu g−1) but as illustrated in the inset shows that the adsorbent was readily separated from the solution by putting a magnetic bar outside of the vessel. Other researchers working with magnetic composites reported that they also removed the composite from the solutions with magnetic properties lower than 10 emu g−1 [34]. In this research, after putting the magnet bar, separation of adsorbent was occurred in very short time and the particles were collected on the inside wall of the vessel. When the magnetic field was removed, the adsorbent dispersed homogeneously in the aqueous phase.
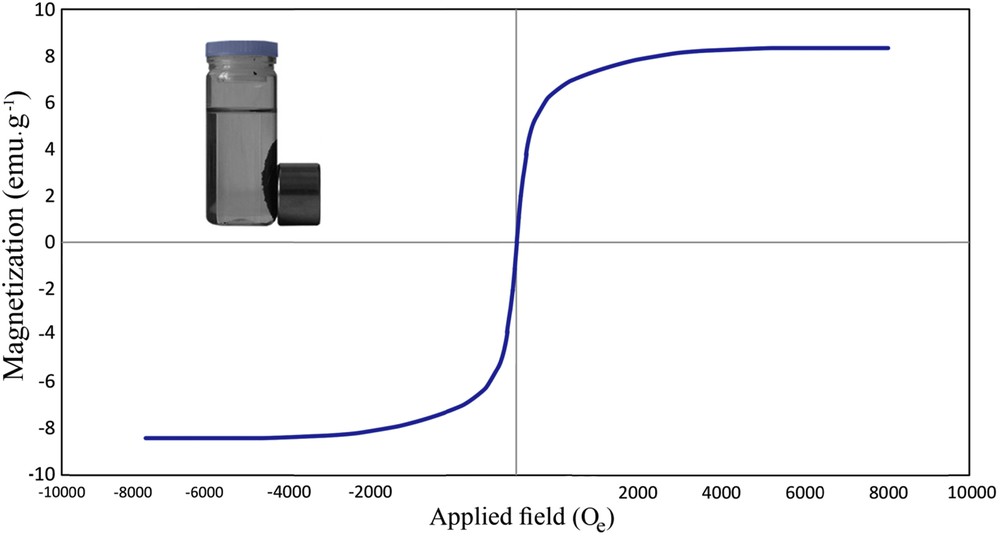
VSM curve of AC-Fe3O4-DTZ.
In the thermal curves (TG-DTG) of the sample taken under a nitrogen atmosphere, three well resolved weight loss peaks were distinguished (Fig. 6). The first weight loss appeared between 100 and 200 °C was attributed to the evaporation of the adsorbed water molecules. The second weight loss step occurred between 300 and 420 °C and corresponded to the dehydration of hydroxyl groups and decomposition of the remaining organic constituents such as lignocellulosic [35]. The final weight loss step occurred above 600 °C and mainly involved the destruction of the dithizone structure [32].
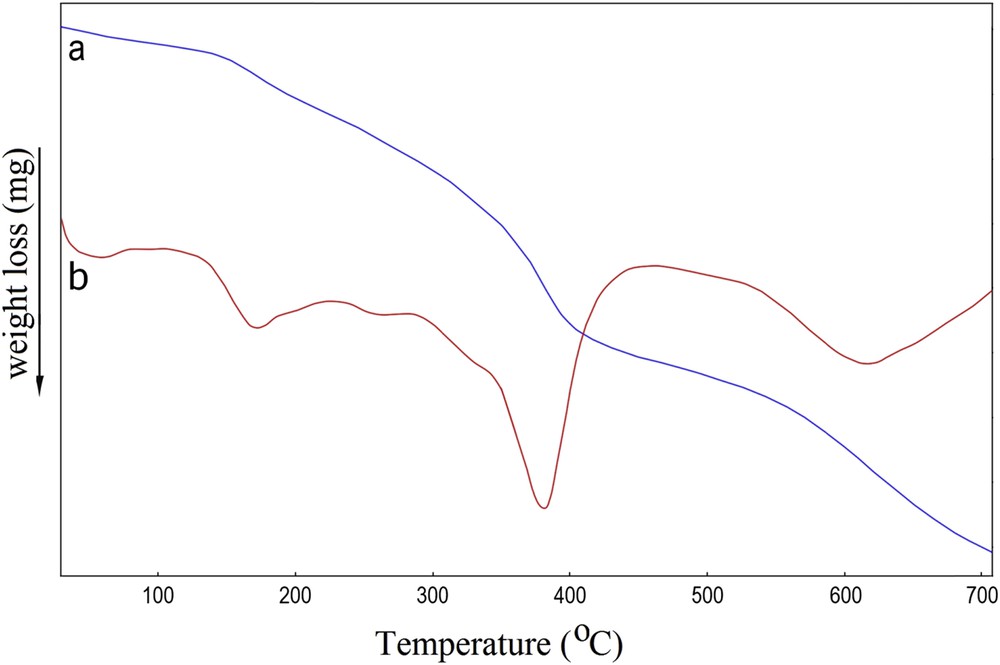
Thermal curves TG (a) and DTG (b) of AC-Fe3O4-DTZ sample.
3.2 Uptake of cations by the modified adsorbent
In the experiment performed with different adsorbents, the uptake of chromate was measured in three samples including activated carbon (AC), magnetized activated carbon (AC-Fe3O4), and functionalized activated carbon (AC-Fe3O4-DTZ). The results (Fig. S2) showed that the adsorption of cations was in the order of AC-Fe3O4-DTZ>AC-Fe3O4> AC, suggesting that the introduction of Fe3O4 and dithizone into the activated carbon enhances its capacity toward the studied cations.
The basic idea behind this research is that the modified adsorbent is capable to adsorb particular cations from aqueous solutions, and then the adsorbents confined with cations can remove the chromate anion from the solution by the formation of appropriate insoluble chromate precipitate with the uploaded cations. To justify this assumption, the modified biosorbents were firstly impregnated with Pb2+, Ag+, Ba2+, and Sr2+ (the ksp of PbCrO4, Ag2CrO4, BaCrO4, and SrCrO4 is, respectively, 2.8 × 10⁻¹³, 1.1 × 10⁻¹², 2.2 ×10⁻¹⁰, and 2.2 ×10−05) and the cation-loaded adsorbent was then used for the removal of chromate from solution.
By this method, the consecutive removal of selected cations and chromate ions by the same adsorbent from a single solution or different solutions is feasible.
To study the effect of the cation content on the removal efficiency of chromate, four adsorbents with different cation contents were prepared (Table 1). The maximum cation uptake for Pb2+, Ag+, Ba2+, and Sr2+ was 2.44, 0.98, 1.04, and 0.99 meq.g−1, respectively. The higher cation loading of Pb2+ is attributed to the higher affinity of the grafted ligand (dithizone) toward the lead ions. The high lead content is beneficial for the removal of chromate because the ksp of lead chromate is very low (2.8× 10⁻¹³) providing a favoring attracting force toward chromate ions. It is assumed that by selecting adequate ligands for each cation, it is possible to prepare new adsorbents with a higher cation content and to increase the removal efficiency of the adsorbent toward the chromate anion.
3.3 Removal of chromates by cation impregnated adsorbents
The chromate adsorption capacity of the adsorbent without cation loading was very limited (Fig. 7). By loading the cations into the biosorbent (AC–Fe3O4–DTZ), the uptake of chromate was increased and, for a particular cation, the increase was proportional to the cation content (Fig. 7). For the sample containing divalent cations (Pb2+, Sr2+, and Ba2+) with almost similar cation content (Pb-ads-3,Ba-ads-4, and Sr-ads-4), the chromate uptake increased with a decrease in the ksp of the chromate precipitate (Table 2).
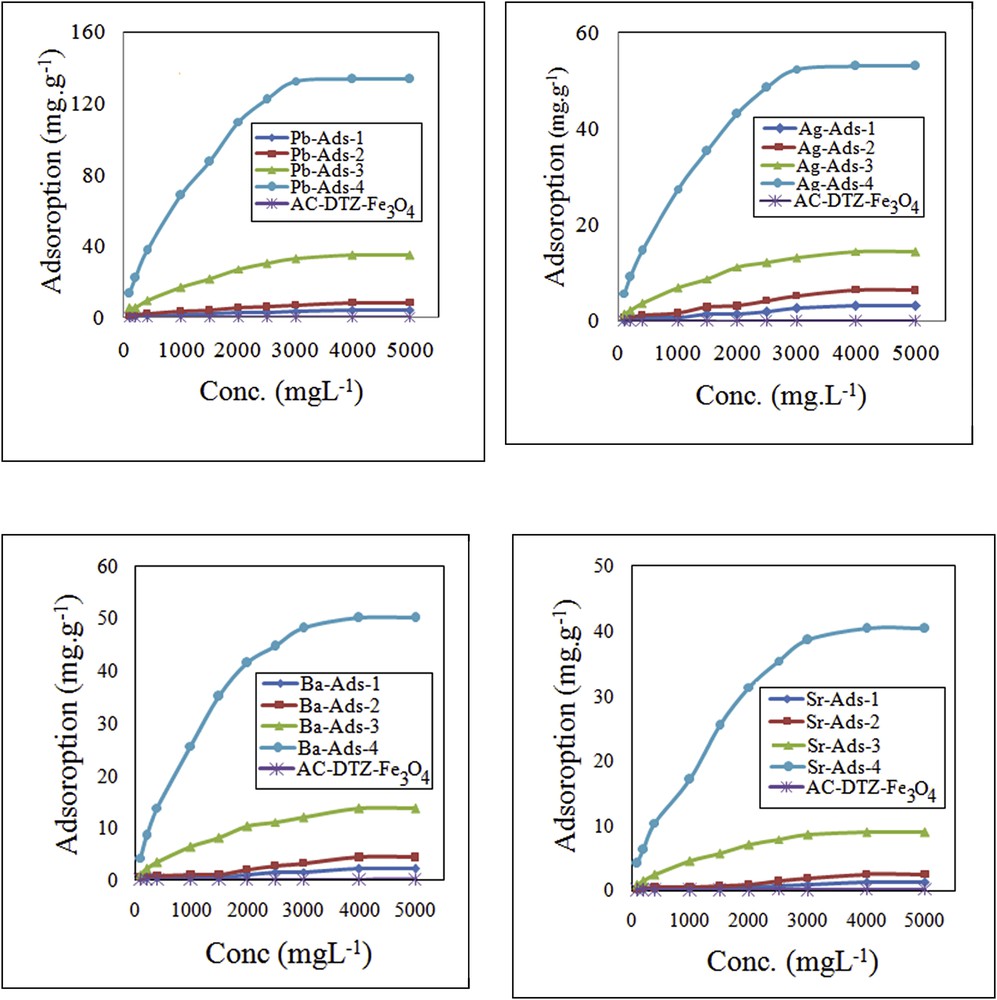
Effect of chromate concentration on the chromate uptake.
Removal of chromate by adsorbents with different cation loading.
| Cation | Sample designation | ksp | Adsorbed chromate (meq g−1) |
| Pb2+ | Pb-ads-1 | 2.8 × 10⁻¹³ | 0.110 |
| Pb-ads-2 | 0.233 | ||
| Pb-ads-3 | 1.185 | ||
| Pb-ads-4 | 2.424 | ||
| Ag+ | Ag-ads-1 | 1.1 × 10⁻¹² | 0.056 |
| Ag-ads-2 | 0.120 | ||
| Ag-ads-3 | 0.270 | ||
| Ag-ads-4 | 0.480 | ||
| Ba2+ | Ba-ads-1 | 2.2 × 10⁻¹⁰ | 0.038 |
| Ba-ads-2 | 0.118 | ||
| Ba-ads-3 | 0.432 | ||
| Ba-ads-4 | 0.946 | ||
| Sr2+ | Sr-ads-1 | 2.2 × 10−05 | 0.041 |
| Sr-ads-2 | 0.149 | ||
| Sr-ads-3 | 0.695 | ||
| Sr-ads-4 | 0.740 |
For lead and silver loaded adsorbents, the adsorbed chromate was stoichiometrically equivalent to the Pb and Ag contents (Pb-ads-4 contained 2.44 meq g−1 of lead, adsorbed 2.42 meq g−1 of chromate and Ag-ads-4 containing 0.980 meq g−1 of Ag, adsorbed 0.480 meq g−1 of chromate).
The adsorption of chromate in Ba-ads-4 and Sr-ads-4 was lower than the equivalent amount of the sorbed cations because the ksp of their chromate precipitates was not sufficiently low and thus the tendency to the chromate attraction was insufficient. However, the results indicated that chromate adsorption was dependent on the cation content and the ksp of the chromate precipitates.
4 Effect of experimental parameters on the chromate uptake
4.1 Effect of chromate concentration
The effect of chromate concentration on the removal efficiency was examined in the concentration range of 100–5000 mg L−1 (Fig. 7). It was found that the adsorption of chromate by the modified biosorbents increased with increasing chromate concentration until the adsorption sites were fully engaged and the equilibrium was established. By increasing the chromate concentration, the migration of chromate from the bulk solution to the surface of the adsorbent was enhanced and a higher uptake of the anion was achieved. The uptake of chromate has been studied using various adsorbents including clinoptilolite [19], MCM-41 [20], organo-zeolite [36], goethite [37], and amorphous iron hydroxide [38]. The adsorption capacity obtained in this work was considerably higher than the previously studied adsorbents (Table 3).
Comparative sorption capacity of the previously studied adsorbents.
| Adsorbent | Modified by | Conc. (mg L−1) | Adsorption (mg g−1) | References |
| Clinoptilolite | Ba2+ | 70 | 84.5 | [19] |
| Pb2+ | 105.6 | |||
| Hg2+ | 84.5 | |||
| Ag+ | 126.7 | |||
| Sr2+ | 73.9 | |||
| Ca2+ | 84.5 | |||
| Clinoptilolite | Without modification | 139.2 | 45.36 | [20] |
| Kaolinite | Hexadecyl trimethyl ammonium | 10 | 11.36 | [21] |
| Pillared clay | Hexadecyl trimethyl ammonium | 8.10 | ||
| Organo-zeolite | Hexadecyltrimethylammonium | 10 | 0.8 | [36] |
| Goethite | – | 58 | – | [37] |
| Amorphous iron hydroxide | – | 0.58 | – | [38] |
| Magnetic activated carbon | Dithizone and Pb | 4000 | 133.84 | This work |
| Dithizone and Ag | 58.12 | |||
| Dithizone and Ba | 55.12 | |||
| Dithizone and Sr | 40.39 |
4.2 Effect of contact time and kinetics of the adsorption process
To evaluate the kinetics of the adsorption process, the uptake of chromate was measured for different time intervals from 1 to 14 min (Fig. 8). The results showed that the adsorption process was kinetically fast and the equilibrium was established within 10 min. The kinetic data were analyzed using the pseudo-first-order and pseudo-second-order kinetic models.
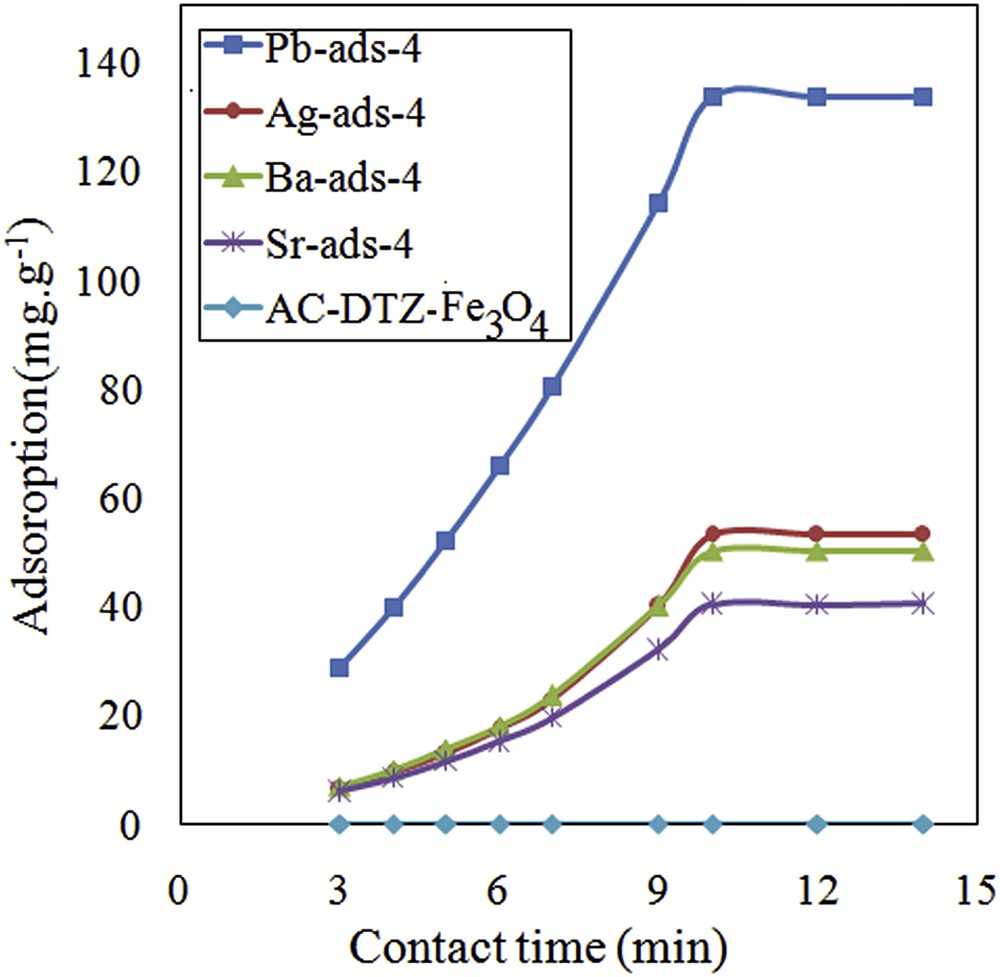
Effect of contact time on removal efficiency of chromate.
The pseudo-first-order equation recommended by Lagergren and Sven [39] assumes that the sorption occurred on the sorption site of the adsorbent according to the following equation:
| (2) |
| (3) |
The pseudo-second-order equation can be visualized by Eq. (4):
| (4) |
The pseudo-second-order rate equation can be expressed by the following equations:
| (5) |
By plotting t/qt versus t, a straight line was obtained (Fig. S4). The qe and k2 values were, respectively, obtained from the slope and intercept of the line.
According to the R2 values obtained for the pseudo-first-order and pseudo-second-order equations (Fig. S3 and Fig. S4), it was concluded that the kinetic data were in good compliance with the pseudo-second-order model. In this regard, the following assumptions governed the adsorption process [40].
- - Sorption only occurs on localized adsorption sites and involves no interaction between sorbed ions.
- - The energy of adsorption is independent of surface coverage.
- - Maximum adsorption corresponds to a saturated monolayer of adsorbate on the adsorbent surface.
- - Chromate uptake is governed by the chemical process (chemisorption).
- - The rate-limiting step is a chemical sorption between the adsorbate and adsorbent.
4.3 Effect of adsorbent dose on the chromate adsorption
To evaluate and optimize the effect of an adsorbent dose on the removal efficiency, the chromate uptake was measured with different adsorbent doses (0.1–2.6 g). The selected amount of the adsorbent was equilibrated with 25 mL of chromate solution (4000 mg·L−1). After equilibration, the adsorbent was separated and the concentration of chromate was measured in the remaining solution (Fig. 9). By Pb-Ads-4, 95% of removal efficiency was obtained with 0.4 g of the adsorbent, while; Sr-ADS-4 needed 2.2 g of the adsorbent for maximal removal efficiency.
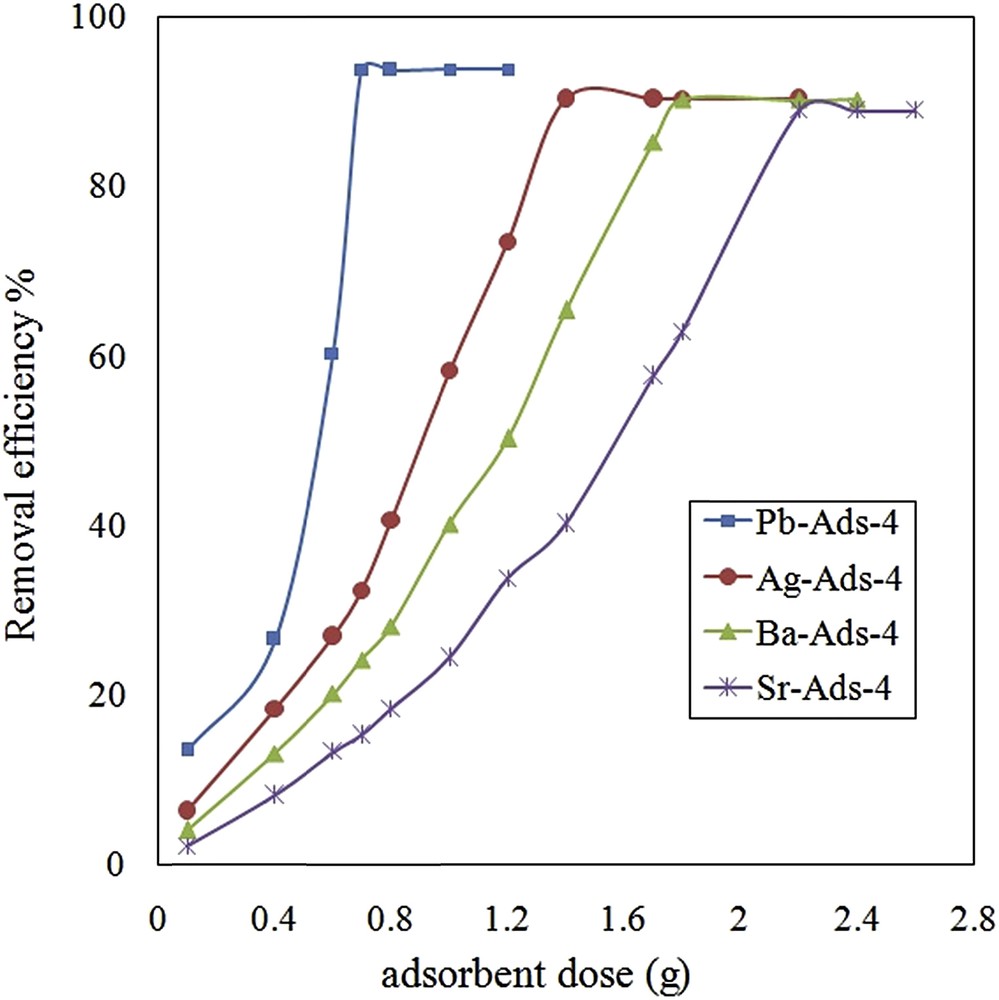
Effect of adsorbent dose on removal efficiency of chromate.
M. Ghiaci et al. (2004) used natural zeolite clinoptilolite for the uptake of chromate from aqueous solutions. They reported that by an adsorbent dose of 4 g, the adsorption capacity of 4.53 mg g−1 was achieved [21] while using 1.0 g of kaolinite the adsorption of 11.36 mg g−1 was obtained. In comparison with the previous studies, we achieved a higher adsorption capacity with a lower adsorbent dose.
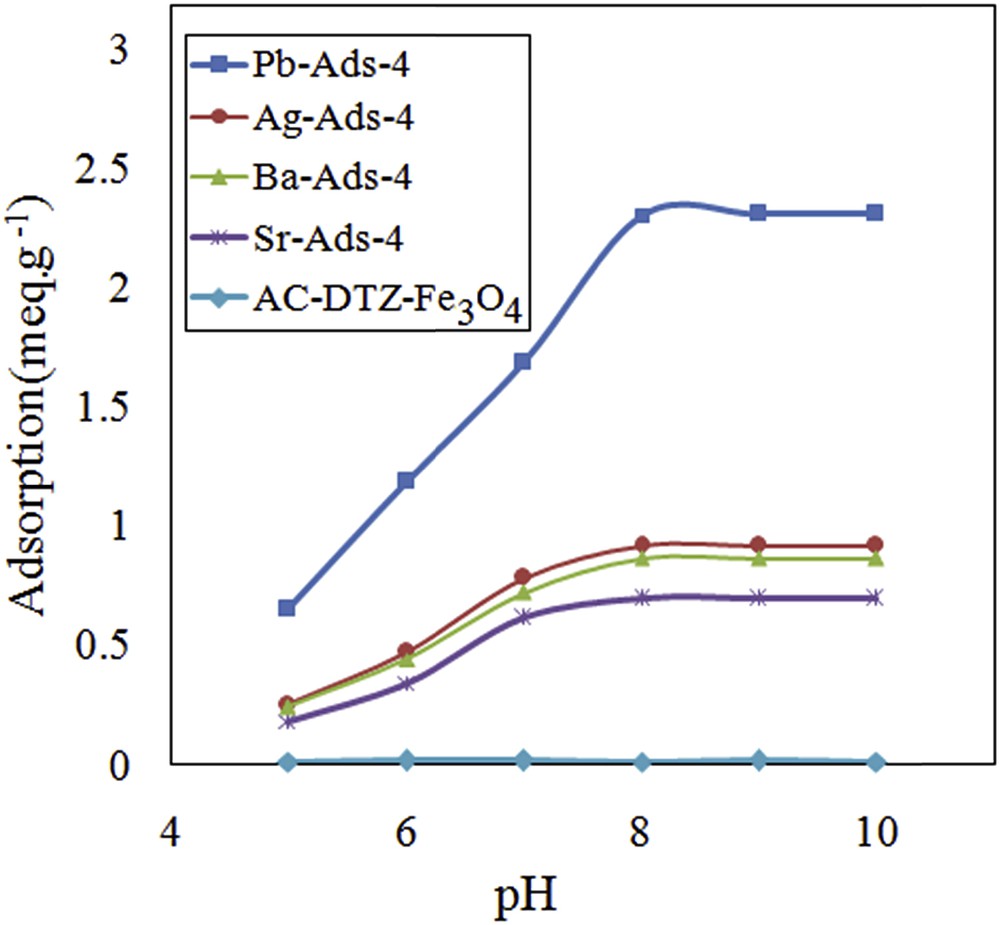
4.4 Effect of pH on the chromate adsorption
The pH of the solution, as an important factor in the adsorption process, by modifying the concentration of Cr(VI) species, changes the surface charge of the adsorbent, and H3O+ concentration. To evaluate the comprehensive effect of pH on the chromate uptake, the adsorption process was conducted at a pH range of 2–10. As shown in Fig. S5, at pHs lower than 5, the dominant species of Cr are HCrO4−, Cr2O72−, and H2CrO4 and the concentration of CrO42− is negligible [41].
Therefore, the chromate uptake below pH=5.5 was very limited (Fig. 10). At higher pHs, the CrO42− concentration begins to increase through the following reactions [42]:
| (6) |
| (7) |
| (8) |
| (9) |
Effect of pH on removal efficiency of chromate.
The CrO42− concentration increased as the pH of the solution increased and the maximum level was obtained at pH = 8. The uptake of CrO42− followed the same pattern and the maximal removal was achieved at pH = 8 and remained constant until pH = 10. To evaluate the effect of the surface charge of the adsorbent on the removal efficiency, the point of zero charge (pHpzc) was measured by the use of five aliquots of sodium chloride solution (25 mL, 0.01 M) placing in contact with 0.1 g of the adsorbent. The system was stirred for 24 h, and the final pH was measured and plotted versus the initial pH (Fig. 11). It was concluded that the surface of the adsorbent was positive until pH = 8; therefore, the adsorbent surface did not exert a repulsion force to the CrO42−.
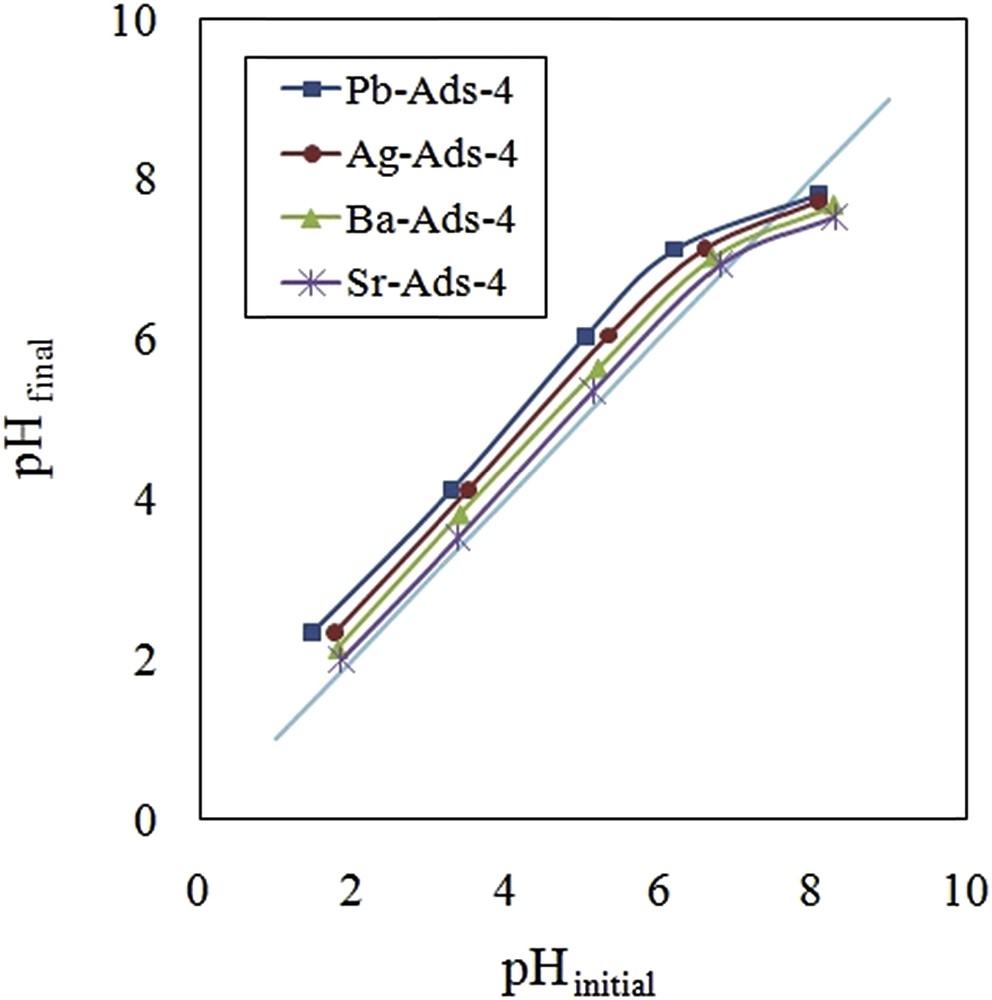
pHpzc of the adsorbents.
The optimized pH for the removal of chromate was studied using different adsorbents including anion-exchange resins amberlite 416 [17], MCM-41 [20], and soil [43]. The optimized pH for the studied adsorbents was from 7 to 8, confirming that the chromate concentration and adsorbent surface charge are the most affecting parameters for the adsorption of chromate.
4.5 Selectivity of the adsorbents and effect of interfering anions
The interfering effect of various anions including OH−, Cl−, CO3−2, and NO3− was studied in the solution in which the concentration of chromate was constant (300 mg·L−1), and the concentration of competing anions was progressively increased. The tolerance limit was defined as the concentration of coexisting anions that change the recovery of chromate within ±5%. The results of this experiment (Table 4) revealed that the interfering effect imposed by the studied anions followed the order of Sr-ads-4 > Ba-ads-4 > Ag-ads-4 > Pb-ads-4. These results confirmed that with smaller ksp, the formation of the chromate precipitate with the loaded cation increased and the effect of interfering anions decreased. Among the studied anions, nitrate and CO3−2 had, respectively, the lowest and highest interfering effects. The high interfering effect of CO3−2 is attributed to the ability of the loaded cations to form an insoluble precipitate with CO3−2.
Tolerance limit of the studied interfering ions.
| Interfering ion | Conc. (mg L−1) | %Recovery | |||
| Pb2+ | Ag+ | Ba2+ | Sr2+ | ||
| OH− | 0 | 99.9 | 99.8 | 99.1 | 98.7 |
| 100 | 99.5 | 99.6 | 98.9 | 98.5 | |
| 200 | 98.8 | 98.1 | 97.9 | 97.4 | |
| 300 | 97.5 | 97.1 | 94.1 | 94.3 | |
| 400 | 90.1 | 90 | 88.2 | 88.5 | |
| Cl− | 0 | 99.9 | 99.8 | 99.1 | 98.7 |
| 100 | 99.4 | 99.7 | 98.5 | 98 | |
| 200 | 98.1 | 97.6 | 96.4 | 97 | |
| 300 | 96.5 | 96.1 | 89.8 | 90.1 | |
| 400 | 89.2 | 89 | 87.4 | 87.9 | |
| CO3−2 | 0 | 99.9 | 99.8 | 99.1 | 98.7 |
| 50 | 98.7 | 98.8 | 97.3 | 97.1 | |
| 100 | 96.3 | 97.8 | 95.7 | 95.5 | |
| 200 | 93.6 | 92.1 | 89.1 | 90.5 | |
| NO3− | 0 | 99.9 | 99.8 | 99.1 | 98.7 |
| 100 | 99.8 | 99.6 | 98.1 | 98.3 | |
| 200 | 98.6 | 98.7 | 97.8 | 97.4 | |
| 400 | 97.3 | 97.6 | 93.8 | 93.1 | |
| 500 | 94.1 | 94.5 | 89.8 | 90.8 |
4.6 Effect of ionic strength
To examine the effect of ionic strength of the solution on the uptake of chromate, the adsorption experiments in the solution in which the adsorbents were equilibrated with chromate solution (300 mg L−1) in the presence of varying concentrations of NaCl (0.01, 0.05, and 0.1 mol L−1).
Based on the obtained results, the adsorption of chromate decreased with an increase in the ionic strength of the solution (Fig. 12). The effect was more pronounced at ionic strengths higher than 0.5 mol L−1. It is assumed that the well-known “electrolyte effect” reduced the affinity of the chromate anions for precipitation with the loaded cations leading to lower chromate uptake. The effect of ionic strength on the sorption of chromate by iron and aluminum hydroxides indicated that in the presence of 0.1 M NaCl, the adsorption reduced to 90% of its initial value [44]. A similar observation was made for the adsorption of chromate by using vermiculite pure clay mineral [45]. The chromate uptake by using a surfactant-modified zeolite was significantly decreased with an increase in the ionic strength of the solution [46].
Effect of ionic strength on chromate removal.
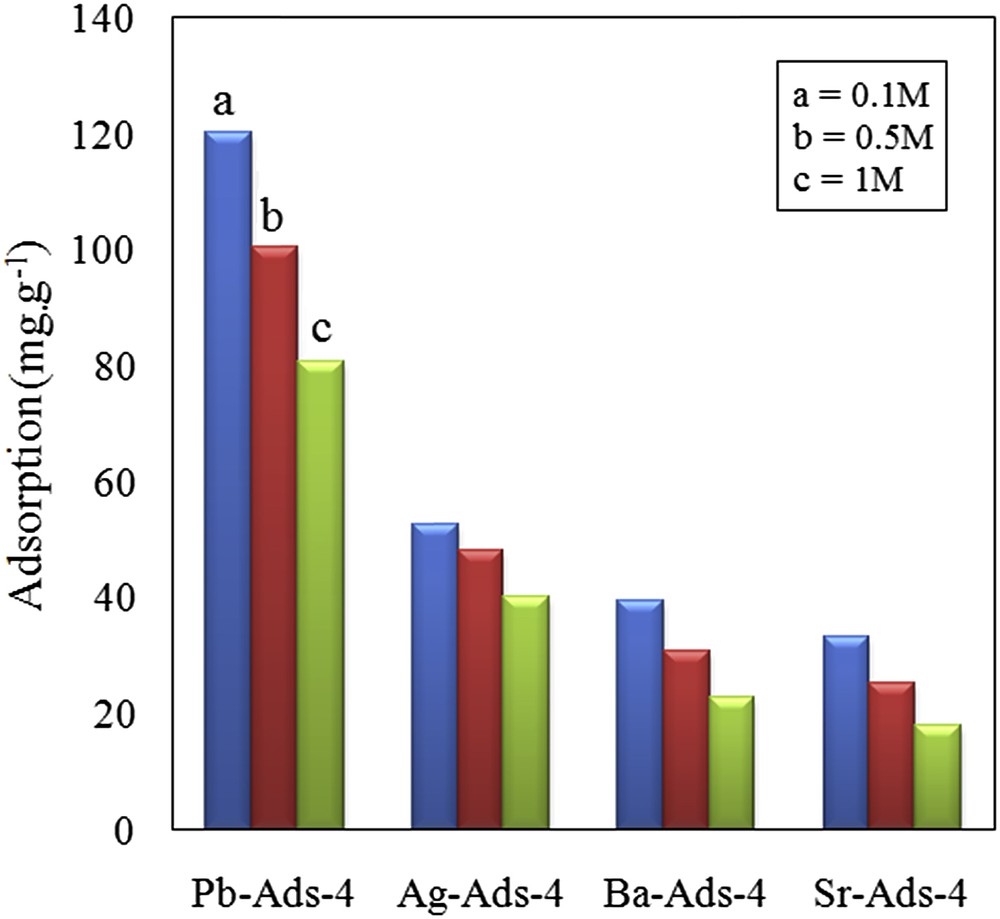
5 Desorption of chromate
The attempts to desorb CrO42− from the loaded adsorbent by the use of deionized water at pHs lower than 5.0 did not lead to the significant recovery of chromate because the solubility of the chromate precipitate is limited at lower pH values. Therefore, the chromate loaded on the biosorbent was eluted with 25 mL of a 0.1 M NaOH solution. The desorption ratios were calculated according to the following equation:
| (10) |
The desorption of chromate was between 79 and 87%. The highest value of recovery was observed for Sr-ads-4 and the lowest by Pb-ads-4 (Fig. 13). It seems that the regeneration depended on the ksp of the chromate precipitate such that a small ksp resulted in a lower recovery percentage.
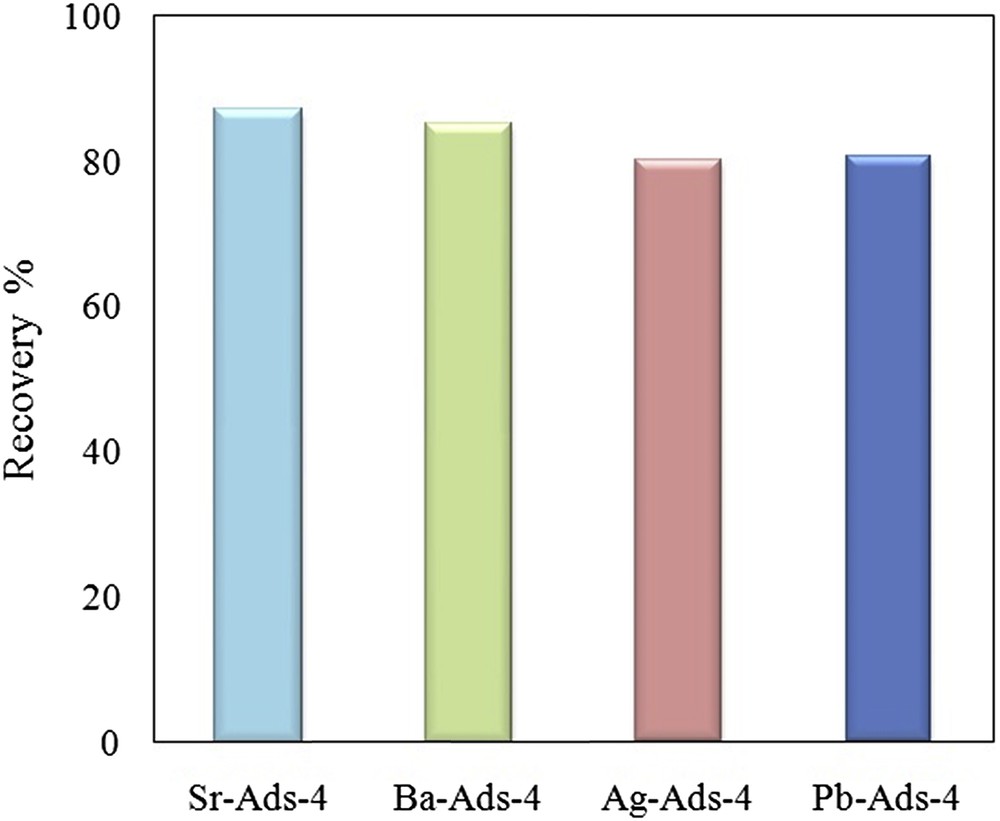
Recovery of chromate from adsorbent by elution with NaOH.
6 Adsorption isotherms
In this work, the Langmuir, Freundlich, Redlich–Peterson, and Sips isotherm models were used to describe the adsorption of chromate by the adsorbents [47]. Among them, the Langmuir and Freundlich models are the most conventional mathematical models which can describe the amount of adsorbed cations distributed between the solution and the adsorbent. The Sips and Redlich–Peterson isotherms are a combination of the Langmuir and Freundlich isotherms. The isotherms are briefly explained as follows:
6.1 Langmuir isotherm
The Langmuir isotherm describing the monolayer adsorption of adsorbate on the surface of sorbent is based on the following assumption:
- - the adsorption sites are homogeneously distributed on the surface of the adsorbent;
- - the number of adsorbed species does not exceed the total adsorption sites; or the adsorption is limited to the formation of a monolayer;
- - the adsorption sites have similar energy and similar affinity towards the adsorbates;
- - no solute–solute or solute–solvent interaction in either phase occurs and both surface and bulk phases exhibit ideal.
The Langmuir model can be described by the following equation:
| (11) |
Langmuir, Freundlich, Redlich–Peterson, and Sips isotherm parameters.
| Isotherm | Parameter | Adsorbents | |||
| Pb-ads-4 | Ag-ads-4 | Ba-ads-4 | Sr-ads-4 | ||
| Langmuir | KL (L mg−1) | 0.00061 | 0.000586 | 0.0005 | 0.00059 |
| qm (mg g−1) | 200 | 66.6 | 71.4 | 55.5 | |
| R2 | 0.999 | 0.999 | 0.999 | 0.999 | |
| ARE | 0.06 | 0.76 | 0.026 | 0.032 | |
| EABS | 60.9 | 224.8 | 6.7 | 7.08 | |
| Freundlich | KF (L mg−1) | 0.93 | 0.84 | 0.211 | 0.212 |
| n | 1. 61 | 1.93 | 1.462 | 1.541 | |
| R2 | 0.979 | 0.973 | 0.989 | 0.994 | |
| ARE | 0.09 | 0.87 | 0.97 | 0.97 | |
| EABS | 70.16 | 257 | 264.6 | 217.4 | |
| Redlich–Peterson | A | 0.22 | 0.09 | 0.06 | 0.09 |
| B | 0.0482 | 0.0438 | 0.02 | 0.138 | |
| g | 0.553 | 0.569 | 0.608 | 0.473 | |
| R2 | 0.993 | 0.991 | 0.974 | 0.988 | |
| ARE | 0.904 | 0.89 | 0.53 | 0.92 | |
| EABS | 694.3 | 278.2 | 56.3 | 137.3 | |
| Sips | Ks (L mg−1) | 0.00088 | 0.00092 | 0.00063 | 0.00011 |
| Qmax (mg g−1) | 166.6 | 58.82 | 71.4 | 38.46 | |
| m | 1 | 1 | 1 | 1 | |
| R2 | 0.990 | 0.992 | 0.998 | 0.995 | |
| ARE | 0.086 | 0.93 | 6.12 | 0.98 | |
| EABS | 58.8 | 279.9 | 232.7 | 141.5 |
6.2 Freundlich isotherm
The Freundlich model describes the adsorption that occurs on the heterogeneous surface with a multilayer and non-uniform adsorption process. The Freundlich isotherm can be defined by the following equation:
| (12) |
6.3 The Redlich-Peterson isotherm
The Redlich–Peterson isotherm contains the three parameters A, B, and g, which include features of the Langmuir and Freundlich isotherms. The Redlich–Peterson isotherm model can be described mathematically by the following equation:
| (13) |
Ce is the equilibrium concentration (mg L−1) and qe is the equilibrium adsorption capacity (mg g−1). A plot of ln (Ce/qe −1) versus ln (Ce) gives a straight line, where A, B, and g are evaluated from the plot (Fig. S6). The value of g lies between 0 and 1. When g = 1, the equation become the Langmuir equation [48]. When g = 0, it is closer to the Freundlich equation [49]. However, the accuracy of these interpretations strongly depends on the fitting method. When A = 0, it corresponds to the Freundlich model.
A values of 0.22, 0.09, 0.05, and 0.09 were, respectively, obtained for Pb-ads-4, Ba-ads-4, and Sr-ads-4, respectively, based on the results, since the values of A are not zero, so the experimental data obeyed the Langmuir isotherm. The g values of 0.553, 0.569, 0.608, and 0.473 obtained, respectively, for Pb-ads-4, Ag-ads-4, Ba-ads-4, and Sr-ads-4, which were closer to 1, also are the evidence of the fitness of data to the Langmuir isotherm (Table 5). By investigation on the Redlich parameters, and considering the calculated parameters (g and A), more evidence was obtained to confirm that the data were fitted to the Langmuir isotherm model.
6.4 Sips isotherm
The Sips isotherm is a combination of the Langmuir and Freundlich isotherms, this system explains that adsorbed molecules could occupy more than one adsorption site [48]. At low concentrations, the sips model reduces to the Freundlich isotherm while at high concentrations, it resembles to the Langmuir isotherm [50]. Sips isotherm is explained using the following equation:
| (14) |
The Sips isotherm describes the heterogeneity of the system, if m is between 0 and 1. When m = 1, the Sips equation resembles to the Langmuir equation, which confirms a homogeneous adsorption process. The isotherm parameters can be calculated from the plot of 1/qe versus 1/Ce (Fig. S6). The value of m for Pb-ads-4, Ag-ads-4, Ba-ads-4, and Sr-ads-4 was 1 (Table 5).
In order to determine the fitness of the applied model to the experimental data, three factors were considered.
- - The value of R2 obtained for the Langmuir isotherm was closer to 1 than the value obtained for the Freundlich isotherm.
- - The value of m in the Sips model was close to 1, so it resembles the Langmuir equation.
- - The value of A obtained for the Redlich–Peterson isotherm was not zero, confirming that the data were in agreement with the Langmuir model.
7 Error analysis
The R2 value, which indicates the difference between experimental and theoretical values, is restricted only in linearized plots. Therefore, in order to determine the fitness of applied models to the experimental data, the error analysis is required to analyze the data. In this work, the error analysis was performed by two different error functions including average relative error (ARE) and sum of the absolute errors (EABS) (Table 5).
7.1 Average relative error (ARE)
This error function is applied to minimize the fractional error distribution across the entire concentration range [49,50]. This method is based on the following equations:
| (15) |
7.2 Sum of the absolute errors (EABS)
The isotherm model parameters determined by using the EABS function provide a better fit as the magnitudes of the errors increase [51]. The EABS is described using the following equation:
| (16) |
The isotherms with smaller errors are more acceptable. According to the results given in Table 5, the error analysis also confirmed that the Langmuir model was the most reliable isotherm to explain the experimental data.
Based on the Langmuir model, adsorption was a monolayer, all sites were identical and energetically equivalent, the adsorption energy was constant, there was no interaction between species adsorbed on neighboring sites, and the adsorbent has a finite capacity [52].
8 Effect of temperature and thermodynamic parameters
The influence of temperature on the adsorption process was evaluated by the thermodynamic parameters calculated by the following equations:
| (17) |
| (18) |
| (19) |
Thermodynamics adsorption parameters.
| Sample | ΔHo (J mol−1) | ΔSo(J mol−1) | ΔGo (kJ mol−1) at 25°C |
| Pb-ads-4 | −7.78 | −0.490 | −0.14 |
| Ag-ads-4 | −5.42 | −16.5 | −4.91 |
| Ba-ads-4 | −5.34 | −17.7 | −5.26 |
| Sr-ads-4 | −3.17 | −27.7 | −8.25 |
9 Conclusion
The aim of this research was to study the adsorption performance of a new adsorbent synthesized using activated carbon prepared by oak-shell waste materials and impregnated with particular cations. The activated carbon was magnetized, modified with dithizone, and then impregnated with cations. In this study, adsorption capacities of 139.84, 58.12, 7.81, and 27 mg g−1 were obtained, respectively, for lead, silver, barium, and strontium, which were higher than the previously reported values. The adsorption capacity of the adsorbent impregnated with the studied cations toward the chromate anion was then measured under different experimental conditions. The results indicated that the uptake of chromate correlated with the number of loaded cations and the ksp of the chromate precipitate. The adsorption process was kinetically fast and the equilibrium was established within 10 min. The used adsorbent was readily separated from the solution by applying an appropriate external magnetic field. The recovery of the adsorbent was performed by the use of NaOH solution, and most of its initial capacity was retained.
Acknowledgements
The authors wish to thank the Department of Chemistry of Shahreza branch of the Islamic Azad University for providing research facilities.