

1 Introduction
Nowadays, more and more biomaterials, especially polymeric ones, are used for insertion into the body. Despite sterilization procedures, bacterial infection remains a major problem of medical implants, such as catheters, prosthetic joint implants. In 2004, in the United States, over 3.6 million implants were inserted in the human body and more than 4% of them became infected [1]. One possible way to prevent these infections is the use of silver-based compounds e.g. in coatings or as ingredient in the biomaterial itself, as silver is well known for its antimicrobial effect and this since antiquity [2]. There are two main different ways to assemble silver and polymer: the first one is the synthesis of metallopolymers containing silver ions (or coordination polymers), a method which was previously studied in our group [3]. The second one is the use of silver nanoparticles, which are directly generated in the polymer matrix or by mixing a polymer with already prepared silver nanoparticles [4]. Silver nanoparticles can be easily synthesized from silver salts, generally silver nitrate, by using a reducing agent, like ascorbic acid, citric acid, sodium borohydride, hydrazine hydrate and, under certain conditions, they can also be obtained by light reduction [5]. One major challenge with nanoparticles is their stability, as they naturally tend to aggregate to form larger particles, a reason why often surface stabilizing agents are added during the synthesis of nanoparticles [6]. These nanoparticles can easily be mixed with a polymer during the extrusion process in order to have a good homogeneity of the final composite sample [7]. One drawback of this method is that only nanoparticles near the surface can release silver ions to act as antimicrobial agent, while most of them remain in the bulk of the polymer and never react. This renders these materials rather expensive. One solution can be to design polymers in which nanoparticles can migrate to reach e.g. the surface of the polymer or, in view of self-healing, the cracks of the polymer [8].
In this context, we decided to study polyelectrolytes, in particular polystyrene sulfonate. A polyelectrolyte is a polymer in which a substantial portion of the constitutional units contains ionic or ionizable groups, or both [9]. These groups can be acids, bases, or salts that will dissociate in solution to form a charged polymer. The use of a negatively charged polyelectrolyte has the advantage to be able to form a salt with silver ions, and that, compared to coordination polymers based on neutral ligands, the anion of the initial silver salt can be eliminated. Indeed, the counter ion can have important effects regarding the biocompatibility and the antimicrobial activity itself of a compound [10]. Polystyrene sulfonic acid (PSS) is a polymer made by the direct sulfonation of polystyrene [11]. Recently, a new method to synthetize PSS uses living polymerization of protected styrenesulfonates [12]. The sodium salts of PSS are used as superplastifiers in cements, dye-improving agents, proton exchange membranes in fuel cells, and also in ion exchange resins when PSS is crosslinked. It is also used as sodium or calcium salt, as a drug for hyperkalemia [13].
In order to easily eliminate the anion in the preparation of silver PSS composites, we used silver oxide as starting silver salt and ammonia to deprotonate the PSS. In this work, we present a new PSS/silver nanocomposite with self-healing properties due to the migration of the nanoparticles towards the cracks of the polymer. This nanocomposite also shows good antibacterial properties even at low concentrations.
2 Results and discussion
2.1 Complexation of PSS with silver oxide
In order to generate complexes of PSS with silver, a solution of poly(4-styrene sulfonic) acid in water was mixed with a solution of silver oxide in diluted ammonia. After 1 day of mixing, water was evaporated under vacuum to yield a viscous solution, which was transferred in a Petri dish at room temperature in the dark until a solid, pale yellow film of PSS–Ag is formed. X-ray powder diffraction (XRPD) analysis was performed after the film formation (Supplementary data Fig. S1). The diffractogram showed only the contribution of the pure PSS polymer with a broad peak at 18°, indicating an amorphous structure. We did not observe any peak from the silver oxide alone or from a polymer silver complex. Thus, the formed complex is likely to be amorphous or has the same structure as PSS alone. The formed composite is pale yellow just after the film formation, but over the period of 1 month, it shows color changes from yellow to pale orange (Supplementary data Fig. S2). This range of colors indicates typically the silver nanoparticle formation stages, from small to larger nanoparticles [14]. To confirm this, an XRPD was performed. The diffractogram after 1 month was different from the first one (Fig. 1). The peak at 18° is still present, but new peaks appeared. All new peaks can be attributed to metallic silver Ag0. The average size of the crystallite was determined by the Scherrer equation [15]:

X-ray powder diffraction of the nanocomposite after 1 month (blue), silver theoretical pattern (purple).
Assuming that we have spherical nanoparticles, which are the most common form for the silver nanoparticles, this equation gives a value of ca 17 nm for the size of the silver crystallites. For confirmation and in order to determine the real particle size and shape, transmission electron microscopy (TEM) images of the silver nanoparticles were carried out. To do so, the sample was dissolved in water and centrifuged to remove most of the polymer. Fig. 2 shows that the polymer could not be removed completely even after high centrifugation speed (15,000 rpm), as it acts very likely as surface stabilizer for the nanoparticles themselves. This is confirmed by the absence of agglomerates of nanoparticles in the TEM picture. The analysis of 67 different particles on the image gives an average diameter of 25 ± 13 nm, which is in the range of the size of the crystallite size found by powder X-ray analysis. It can thus be concluded that the crystallite size corresponds to the particle size.

Transmission electron microscopy image of the nanocomposite after centrifugation.
We tried to elucidate the process of silver reduction to nanoparticles, but could not find any changes to the PSS by NMR or other analytical means, which could give hints to an oxidation process in the polymer. Possible pathways of the silver reduction could thus be:
- • autocatalytic light reduction [16] (although we tried to work in the dark as much as possible);
- • reduction in contact with air/water;
- • incomplete sulfonation of the polymer with remaining polystyrene groups, the latter of which can be oxidized [17]. The chemical reduction of the silver ions in the PSS–Ag nanocomposite by adding ascorbic acid yields silver nanoparticles of 160 ± 38 nm on average.
2.2 Kinetics of nanoparticle formation
In order to study the kinetics of the nanoparticle formation, two different methods were tested: ICP titration and isothermal microcalorimetry. The first one was realized by dissolving the PSS-Ag composite in water and subsequent separation of the silver ions by centrifugation from the polymer and the nanoparticles, followed by the analysis of the remaining concentration of silver ions in the solution. The results obtained by this method were however not coherent, exhibiting huge variances in the concentration of remaining silver ions. One explanation for this effect can be the content of water (relative humidity) of the polymer, which was shown to vary dramatically from 1 day to the next, resulting in a variation of the concentration of the remaining silver. The second reason was the incomplete separation. A complete separation of the polymer and the nanoparticles even at ultra-high speed (> 20,000 rpm) could not be achieved. TEM images of the supernatant solution always show remaining nanoparticles in the solution, surrounded by polymer, hence, falsifying the ICP-measurement even after filtration. The second method tested to follow the kinetics of silver nanoparticle formation was isothermal microcalorimetry. Most chemical reactions release or adsorb heat, which can be followed with a microcalorimeter over many days if these reactions are slow. This method was thus used to follow the reduction of silver in our sample. A freshly prepared polymer film was introduced in a microcalorimeter vessel, and the temperature was kept at 37 °C during the experiment. At the beginning of the experiment, the sample showed a small release of heat (10−4 J for 1.2 g of sample, which means 6.5 J/mol) which decreased slowly with time to 7.10−7 J (4.10−2 per mol) after 20 days. If we assume that all the released energy comes from the silver reduction, the nanoparticle formation against time can be plotted (Fig. 3). The curve has a logarithmic behavior with a fast formation at the beginning (around 50% in 2 days), then, the formation becomes slower and slower. With this method, we could only see the rate of formation of the nanoparticles, and we did not gain information if the silver reduction was total or if silver ions were still present in the sample.

Heat flow of the nanocomposite as a function of time (red curve – decreasing) and corresponding formation percentage of nanoparticles (blue curve – increasing).
2.3 Follow-up by SEM
A freshly prepared sample was placed on a sample holder and sputtered with a thin layer carbon to improve the dissipation of the electrons. All images were recorded with a back-scattered electron detector [18] (Fig. 4). The first SEM image at low magnification was recorded 2 days after the synthesis. The surface is regular with few white spots of a size of ca. 100 nm, at this magnification only the bigger ones are visible, corresponding to silver nanoparticles. The polymer itself appears also quite bright due to the high silver ion concentration remaining in it. After 5 days, many cracks become visible at the surface of the sample. This crack formation could be due to the high vacuum required for the SEM, but even without any vacuum, we also observed the formation of macro-cracks on the sample due to drying. More nanoparticles are present with different sizes, most of them have a size between 20 nm to 50 nm and few of them are around 200 nm. Particles smaller than 20 nm were not visible with this magnification. At high magnification after 9 days, the nanoparticles are homogeneously distributed in the polymer and their size is in the same range as before. The borders of the cracks are brighter than the average: this can be explained by two phenomena, the first one is the difference of height between the border and the polymer itself and the second one is a higher concentration of silver at the border due to e.g. a phase separation. After 24 days, many more nanoparticles are present, still homogeneously distributed. After 1 month, the borders of the cracks are much brighter than the rest of the polymer and most of the larger nanoparticles are near such a border. These two observations clearly indicate a separation process between the silver nanoparticles and the polymer. This is confirmed by the image taken after 2 months, where the brighter cracks seem to be filled by silver. As seen previously, the content of water is varying a lot, depending on the storage conditions and relative air humidity. This water content could help silver ions to migrate near a crack where they will be reduced again in contact with air and water. An SEM image at low magnification reveals that the cracks are partially filled and also shows agglomeration of nanoparticles in parts of the composite sample. This migration of the nanoparticles through the cracks of the polymer can be considered as a self-healing process [19] as the nanoparticles, which are available in the sample, migrate to the cracks in order to fill them [20]. This phenomenon may be explained by the stretching and extension of the polymer chains close to the nanoparticles, which are driven by the tendency to minimize interaction between the polymer and the nanoparticles [21]. In most cases, the composite must be heated in order to give a sufficient mobility to the polymer chains to have a mobility of the nanoparticles but in our case the high content of water in the polymer seems to be sufficient to have the self-healing process without any heating. After almost 6 months, most of the nanoparticles are now near or in the cracks. All the cracks are filled with silver and some of the nanoparticles are just next to them, with only few nanoparticles still in the middle of the bulk of the polymer. The silver nanoparticles accumulating in and near the crack do not have a regular shape at the border and the TEM image never shows rod-shaped particles nor wires, so it seems that we have rather agglomeration of nanoparticles in the cracks. The follow-up by SEM images shows two different steps in the nanoparticle formation process. The first one is the formation of the nanoparticles during approximately 1 month, which is consistent with the microcalorimetry experiment. Energy-dispensive X-ray spectroscopy was not possible due to the degradation of the sample. With the microcalorimeter, we need 20 days to form the nanoparticles at 37 °C whereas the samples for the SEM were stored at room temperature. During this first month, cracks appear on the surface of the polymer. After 1 month, the nanoparticles start to migrate along the cracks and after 6 months all the cracks are filled with silver nanoparticles.

Scanning electron microscopy images of the nanocomposite with migration of silver towards the cracks (top left: 2 days, top right: 31 days, bottom left: 61 days, bottom right: 165 days).
2.4 Antibacterial and cell viability assays of PSS–Ag nanocomposite
Since our PSS–Ag composite showed good mobility of silver nanoparticles, and as this can be interpreted as an advantage over other polymers in which only the nanoparticles close to the surface can act as antimicrobial agents, we tested our composite in this context. Antibacterial tests (Kirby–Bauer tests) and cell viability assays were performed on our nanocomposite to determine a possible use as biomaterial. For all the tests done at least in triplicata, we used a 4 months old sample in order to ensure that all silver nanoparticles have been formed. It should be said that PSS alone does not show any antimicrobial activity for all tested concentrations and against all bacterial strains. In order to observe an antimicrobial effect for our nanocomposite, a concentration of at least 500 μg/mL (11.6 μg of silver per mL of polymer solution) nanocomposite is required to combat a bacterial concentration of 104 and 106 CFU/mL of Staphylococcus epidermidis, and 1000 μg/mL (23.2 μg of silver per mL of polymer solution) for the bacterial concentration of 107 CFU/mL (Fig. 5). At 2000 μg/mL (46.3 μg of silver per mL of polymer solution) a plateau for the inhibition zone of all the bacteria concentrations was reached. For Staphylococcus aureus, a concentration of at least 500 μg/mL (11.6 μg of silver per mL of polymer solution) for a concentration of 104 CFU/mL is required, 1000 μg/mL (23.2 μg of silver per mL of polymer solution) for a concentration of 106 CFU/mL and 2000 μg/mL (46.3 μg of silver per mL of polymer solution) for a concentration of 107 CFU/mL to observe an antimicrobial activity. As for S. epidermidis at 2000 μg/mL, a plateau for the inhibition zone of all bacterial concentrations is reached (Fig. 6). The inhibition zone at different concentrations of the composite at different concentrations of bacteria shows a plateau for all concentrations in the inhibition zone, after 2000 μg/mL (46.3 μg of silver per mL of polymer solution), the value of the inhibition zone is stable, probably indicating the maximum diffusion speed of silver within the observed time span. Below this value, the maximum reached value of the inhibition zone depends on both the concentration of inoculum and the concentration of the compound. The inhibition zone and thus the antimicrobial activity are inoculum and concentration dependent for both bacteria, from 25 mm for 104 CFU/mL of S. epidermidis to 13 mm for 107 CFU/mL of S. aureus. In parallel, we determined the basic minimum inhibitory concentrations (MIC) and minimum bactericidal concentrations (MBC) values. The MIC values are 78 μg/mL (1.81 μg of silver per mL of polymer solution) for both types of bacteria, while the MBC values are 313 μg/mL (7.25 g of silver per mL of polymer solution) for S. epidermidis and 156 μg/mL (3.61 g of silver per mL of polymer solution) for S. aureus. This MIC value is very low compared to MIC of silver nitrate of 10 μg/mL (6.30 μg of silver per mL of polymer solution) for S. epidermidis. These values are consistent with the ones found for the inhibition zones. S. aureus thus seems to be as sensitive to our compound as S. epidermidis. With such good antimicrobial properties, we proceeded to evaluate the biocompatibility.
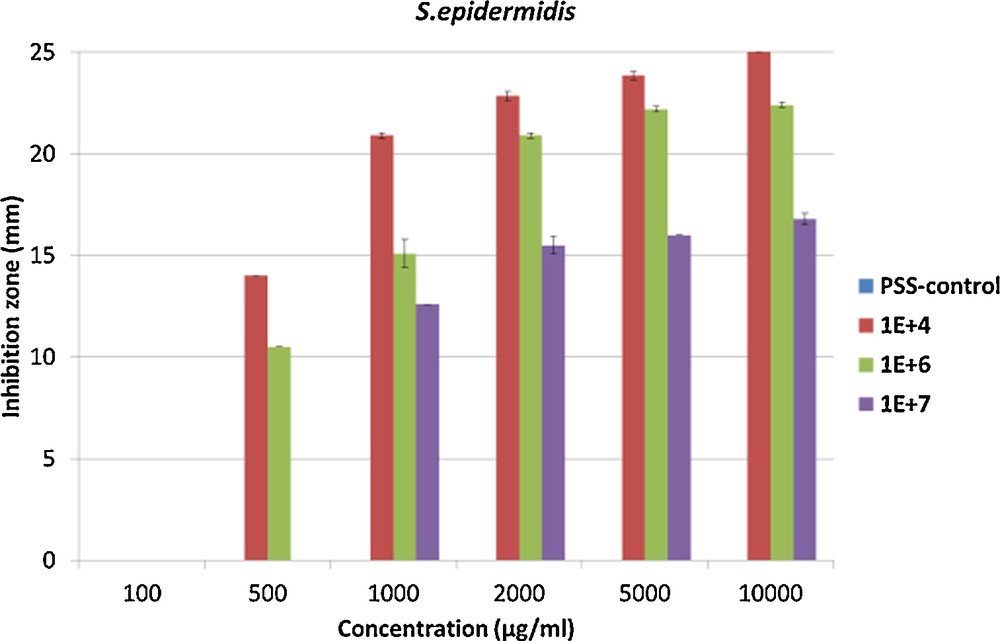
Inhibition zone at three different bacterial concentrations 104, 106 and 107 CFU/mL of Staphylococcus epidermidis. For interpretation of colors, see the online version of this article.
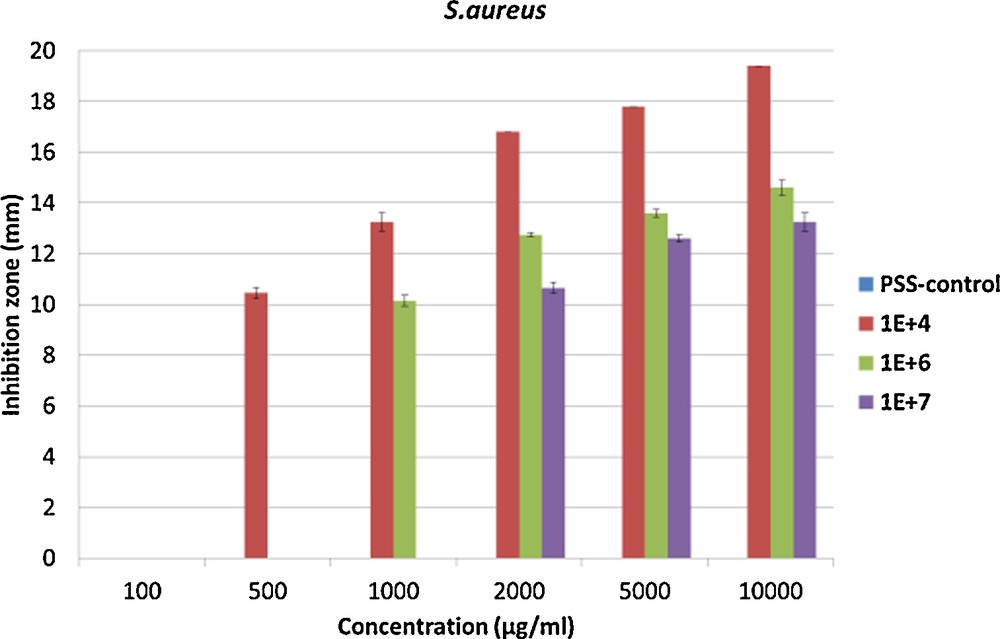
Inhibition zone at three different bacterial concentrations 104, 106 and 107 CFU/mL of Staphylococcus aureus. For interpretation of colors, see the online version of this article.
The most simple cell viability test in vitro is the MTT assay, based on a colorimetric test for measuring the percentage of live cells compared to a reference sample, carried out on fibroblast cells L-929. The first test was done on PSS alone, with a control experiment at 0 μg/mL. The results show cell viability around 90% for all tested concentrations after 48, 72 or 96 h, confirming the biocompatibility of PSS. These results are not surprising because sodium complexes of PSS are used as a drug to treat hyperkalemia [22]. The second test was done on the nanocomposite, the sample being old enough to be sure that all the nanoparticles were formed. The cell viability is good for concentrations between 5 and 40 μg/mL (0.93 μg of silver per mL of polymer solution), for concentrations between 50 μg/mL (1.16 μg of silver per mL of polymer solution) and 70 μg/mL (1.62 μg of silver per mL of polymer solution). The cell viability is around 75%, and drops to 40% for concentrations between 80 μg/mL (1.85 μg of silver per mL of polymer solution) and 100 μg/mL (2.31 μg of silver per mL of polymer solution) of our nanocomposite. For 150 μg/mL (3.47 g of silver per mL of polymer solution), the cell viability is only 15% after 4 days (Fig. 7). Thus, while cytotoxicity assays show a good biocompatibility but no antimicrobial properties for the PSS alone, our compound is already highly antimicrobial for both S. aureus and S. epidermidis, but also cytotoxic at the concentrations required for the MBC. This difference of toxicity between the polymer alone and the nanocomposite can be explained by the presence of nanoparticles. The cytotoxicity of silver particles increases dramatically with their size reduction [23]. It has been shown that small silver nanoparticles can enter into the cell, leading to an increase of oxidative processes leading to cell death [24]. Based on these results, our compound cannot be used as an implantable material due to the cytotoxicity, but it can be used for external applications, such as antimicrobial clothes or wound dressings.
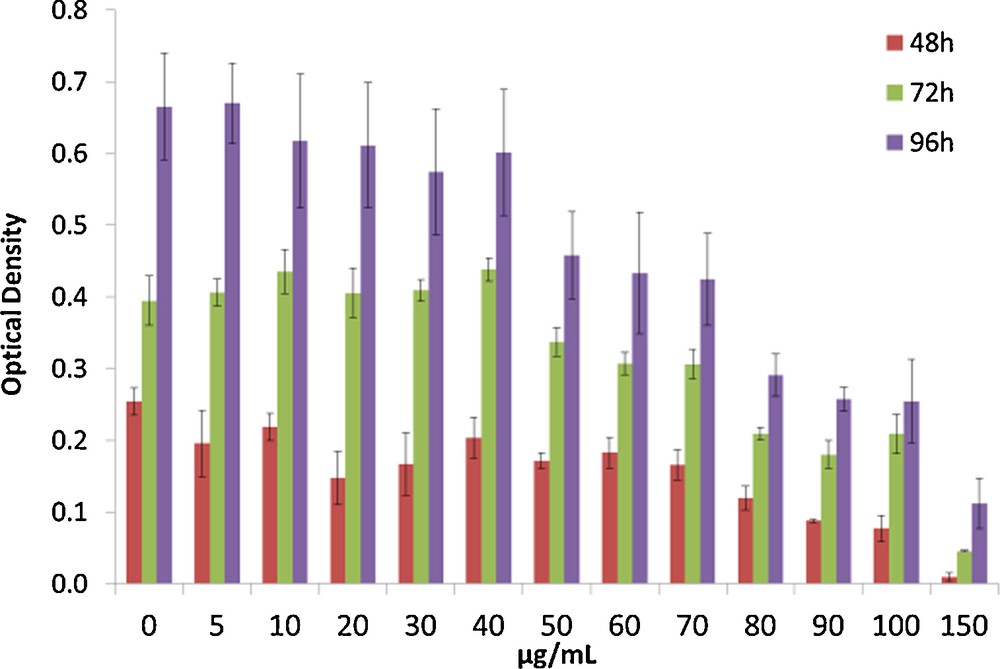
MTT assays on the nanocomposite after three different times of incubation 48 h, 72 h and 96 h. For interpretation of colors, see the online version of this article.
3 Conclusions
We showed that the silver ions of a polyelectrolyte complex of PSS with silver could be slowly reduced to give silver nanoparticles of around 25 nm in size. The mechanism of this reduction has not yet been proven but the complexation between the silver atoms and the sulfonate group seems to be mandatory. This reduction is a slow process, which takes ca. 1 month under standard conditions for a loading with 2.5 wt% of silver oxide. Chemical reduction of the silver PSS complex gives larger particles than the spontaneous, slow reduction. SEM follow-up of the nanoparticles formation shows two different steps, the first one is the formation of the nanoparticles themselves during the first month followed by a phase separation process between the nanoparticles and the polymer, resulting in an accumulation of silver in the cracks of the polymer. Antimicrobial tests show a good antimicrobial activity of our compound even at low concentrations > 1 mg/mL. Unfortunately, the product is cytotoxic at these concentrations due to the presence of silver nanoparticles in solution when the polymer dissolves in the medium. This restrains the possible use of our nanocomposite to external applications, such as antimicrobial clothes or wound dressings.
4 Experimental
All the chemicals were standard reagent grade and were used without further purification. 1H NMR spectra was recorded with 360 MHz spectrometer with residual solvent signal used as reference. Powder X-ray diffractogram were collected on a Stoe StadiP using Cu Kα1 radiation (1.5406 Å). The morphology and the size of particles were determined by scanning electron microscopy (SEM, Philips XL30), transmission electron microscopy (TEM).
4.1 Preparation of the nanocomposite
In a one-neck flask, polystyrene sulfonic acid [Mw: 75,000 g/mol (200 mg)] and 200 mL of water were mixed then a solution of silver oxide ([5 mg for a], [20 mg for b] and [50 mg for c]) in 3 mL of concentrated ammonia was added. The resulting solution was stirred for 24 h then the solvent was evaporated to form a viscous liquid with a pH of 6.5. Slow evaporation of the remaining solvent in 1 or 2 days leads to the nanocomposite film with a thickness < 1 mm. The films are not completely dry, and the content of water is between 13 and 18% after the film formation. 1H NMR (360 MHz, D2O) δ 1.2–1.9 (3H) 6.2–6.8 (2H) 7.3–7.8 (2H). IR ν = 3489 (mb), 3209 (mb), 3055 (wb), 2364 (w), 2368 (w), 1600 (w), 1415 (m), 1166 (s), 1126 (s), 1033 (s), 1006 (s), 835 (s), 777(s), 671 (s).
4.2 Antimicrobial tests
For the antimicrobial tests, the nanocomposite was always dissolved in the medium used for the growth of the bacteria or cells.
4.2.1 Bacterial strains and growth conditions
S. epidermidis 1457 and S. aureus 113 bacteria were freshly grown in tryptic soy broth (TSB) for 7 h at 37 °C without shaking and then diluted 1:100 for an overnight (ON) culture, which was used for the experiments. Bacterial numbers were estimated by determining the optical density at 600 nm and assessed by plating serial dilutions on Müller Hinton Agar (MHA) [25].
4.2.2 In vitro antimicrobial susceptibility
A standard inoculum of 1 × 10⁵ to 5 × 10⁵ CFU/mL of S. epidermidis 1457 or S. aureus 113 was used. MIC and MBC, respectively of silver compounds for logarithmically growing bacteria were determined using a macrodilution method according to the Clinical and Laboratory Standards Institute (CLSI) guidelines [26]. The MIC was the lowest concentration of silver compounds that inhibited visible bacterial growth. The MBC was defined as the lowest concentration of silver compounds which killed ≥ 99.9% of the initial bacterial counts (i.e., ≥ 3 log10 [CFU/mL]) in 24 h.
4.2.3 Agar inhibition assays
Agar inhibition assays were performed in dishes with a size of 24 × 24 cm containing 160 mL of agar. S. epidermidis 1457 or S. aureus 113 was diluted to 104, 106 and 107 CFU/mL in the agar. Solutions of silver compounds were pipetted into the wholes each of 1 cm diameter in the agar. The agar plates were incubated for 18 h at 37 °C, and the inhibition zones around the solutions of the silver compounds were measured.
4.3 Fibroblast cell culture
L-929 fibroblast murine cell lines (ATCC number: CCL-1) were used as a cell model to investigate the effects of material variations on soft tissue response. The fibroblast cultures were maintained in RPMI supplemented with 0.25 mM HEPES, 10% foetal bovine serum, 1X NEAA, 1 mM sodium pyruvate and 1% penicillin/streptomycin at 37 °C in humidified air and 5% CO2. Cultures were subdivided by trypsination using Trypsin–EDTA solution. The culture medium was changed every 3 days.
4.4 MTT tests of fibroblast cells
A quantitative colorimetric MTT test was performed after 2, 3 and 4 days of culture to characterize cellular metabolism (vitality) and, by implication, proliferation. Cells were seeded at the right concentration onto the 96-well plates, grew for 24 h before adding the silver compounds. As a control substrate for cell attachment and growth, fibroblasts were plated directly onto tissue culture polystyrene plastic. At day 2, 3 and 4, 10 μL of MTT solution [5 mg/mL 3-(4,5-dimethylthiazol-2-yl)-2,5-diphenyl-tetrazolium bromide in PBS] was added to each well, and the cells were incubated at 37 °C for 4 h. The reaction was stopped at 4 °C for hours. The medium was then removed and 100 μL of dimethylsulfoxide was added to each well, followed by 30 min incubation at room temperature on a shaker. The optical density (OD) was measured at 540 nm with an ELISA Reader. The OD is directly proportional to the number of cells alive [27]. The mean absorbance values were corrected for a blank (medium only) and results were reported as OD.
4.5 Microcalorimetric analysis
The IMC instrument (TAM 48, TA instruments, New Castle DE USA) was set at 37 °C. The nanocomposite was placed in air, in microcalorimetric ampoules. The ampoules were closed under aerobic conditions and each was placed in the equilibration position in one of the 48 chambers of the IMC instrument for 15 min to allow initial equilibration. After this, the samples were lowered to the measuring position and measurement started after 45 min. During all the measurement time, the instrument maintained the set temperature of 37 °C and heat flow versus elapsed time was recorded for each ampoule.
Acknowledgements
The authors thank the Swiss National Science Foundation, the University of Fribourg and the Fribourg Center for Nanomaterials (FriMat) for generous support.