

1 Introduction
Considerable effort has been made over the last decade in the detailed evaluation of carbon-supported platinum catalyst (Pt/C) degradation under various Polymer Electrolyte Fuel Cell (PEM FC) conditions. For a large and efficient catalyst benchmarking exercise, it would be necessary to evaluate material lifetime, with minimum effort and cost [1–4]. The 21st century challenge is to find greener processes with better atom economy and stability of the catalysts [5–8]. Membrane electrode assembly (MEA) single-cell tests are time consuming and costly [9]. In PEM FCs, the amount of dissolved metals (e.g., Pt, Co, Ni, etc.) during degradation tests is difficult to quantify, since these cations are trapped in the membrane and ionomer of the catalysts layer [10]. In addition, it is difficult to discriminate between the different processes contributing to the overall degradation, as the membrane/ionomer degradation and catalyst layer properties are dependent on the preparation process [11,12]. Furthermore, in order to optimize MEA prototyping, larger amounts of catalyst material are required and not always available. There is a need to assess the long-term performance of catalysts even from the earliest stage of their development. Liquid electrolyte models or half-cell experiments are the preferred techniques to study catalyst durability issues [13–15]. Rotating disk electrode (RDE) testing procedures offer the advantage of fast screening of a high number of catalysts and the ability to distinguish between different degradation mechanisms, while being more efficient and relevant to automotive operational modes [3,16]. However, the development of transfer functions between laboratory experiments and real-world driving conditions has thus far not been reported. In this research, half-cell durability tests are compared with single-cell tests. Triangular wave cycles (TWC) were employed to follow the degradation of Pt-based catalysts in both setups. Different scan rates and cycle counts were analyzed to identify their contribution to the degradation and identify an optimum scan rate for catalyst testing. Finally, the quantitative contribution of each degradation mechanism over the kinetic performance losses is provided.
2 Experimental
2.1 Electrochemical methods
The measurements performed in this research consider different carbon-supported catalysts: 50 wt% Pt/C (commercial Selectra® CRC BASF), 47 wt% Pt/C (commercial TKK), 52 wt% PtCo/C (commercial TKK) and 20 wt% PtNi/C (laboratory sample).
A rotating disk electrode was used for the half-cell measurements. The catalyst dispersion inks were prepared by suspending 2 mg of catalyst in 2 ml of deionized water and ultrasonicating the medium for 30 minutes at room temperature. An aliquot of the catalyst dispersion, without ionomer, was dispersed onto a mirror-polished glassy carbon (GC) disk of 5 mm diameter and dried under nitrogen. The volume of the ink drop cast on to the GC was 40 μl for the durability test and 15 μl for oxygen reduction reaction (ORR) measurements. Subsequently, the ionomer was fixed on top of the dried catalyst layer, with a defined amount of 20 μl of 5% aqueous Nafion solution, following the method proposed by Schmidt et al. [14]. It was shown that the diffusion resistance of the Nafion film is negligible because of its low thickness [14,17]. Each working electrode was transferred to a standard three-compartment electrochemical cell. A Pt wire was used as a counter electrode and a hydrogen electrode (Gaskatel) was used as a reference electrode. Two different bipotentiostats were used to control the potential, a Metrohm (model AUT84597) instrument that allows time intervals of 100 μs and a BioLogic (model SP-300) bipotentiostat that allows low scan rates of 0.33 mV/s. The electrolyte used was 0.1 M HClO4 (Sigma Aldrich) purged with nitrogen of 99.9% purity (Linde). All RDE measurements were conducted at room temperature. The ECSA of each catalyst sample was determined using the mean integral charge of the hydrogen adsorption area (Had). The measurement scan rate was 20 mV/s, and the charge used to determine the ECSA was 210 μC/cm2Pt [19].
The single-cell measurements were performed with a 48-cm2 cell. The MEAs (SolviCore) were 25-μm membranes coated with 0.4 and 0.1 mgPt/cm2 at the cathode and anode sides, respectively. The degradation tests were conducted under H2/N2 gases flowing over anode/cathode at 100% relative humidity (RH), 65 °C and 1 bar absolute pressure. The Pt ECSA was determined using the mean integral charge of the Had areas from the basic cycling voltammograms (BCV). Fig. 1 shows the hydrogen adsorption and desorption areas from BCVs measured for half-cell (solid line) and single-cell (triangles) experiments. Well-defined Had features were found for both measurements, resulting in comparable surface areas. The single-cell BCVs were measured by flowing H2 (0.5 nl/min)/N2 (0.5 nl/min) gases through the anode/cathode with an absolute pressure of 1 bar, following a method proposed in the literature [17–19]. The scan rate was 20 mV/s at room temperature. The anode was used as a reference and a counter electrode, while the cathode was the working electrode.
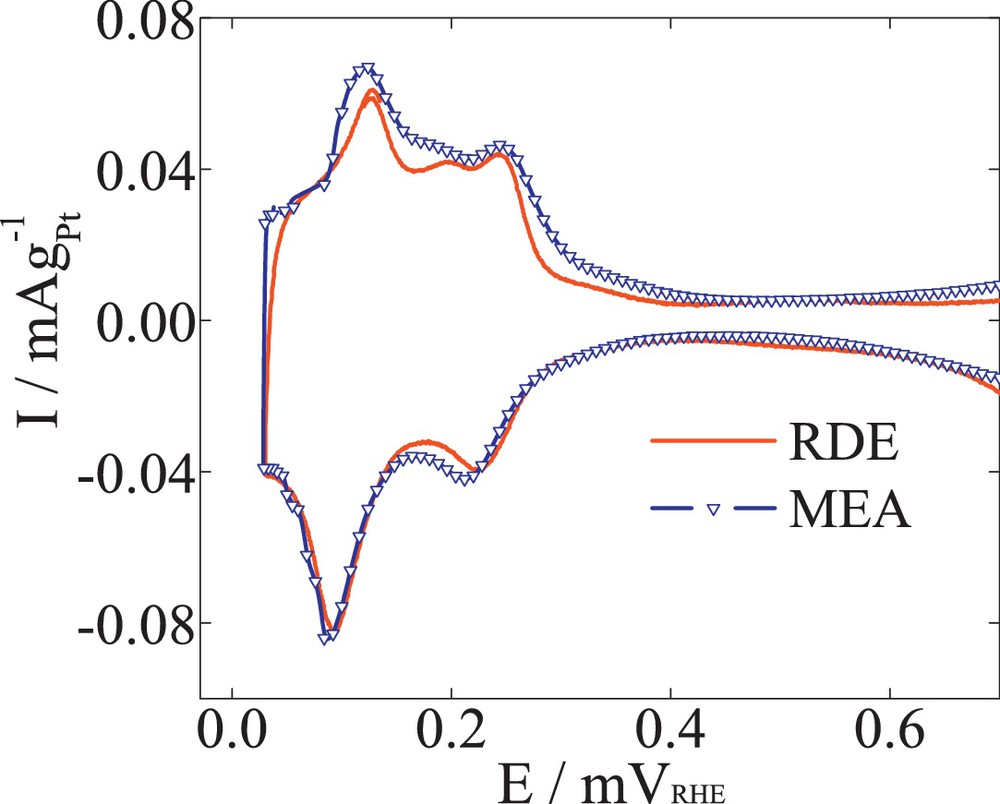
Basic voltammograms of 47 wt% Pt/C catalysts on RDE (solid line) and MEA (circle symbol). The MEA BCV was performed with H2 (0.5 nl/min) purged on anode and N2 (0.5 nl/min) purged on cathode under 1 bar atmospheric pressure and 100% RH, 20 mV/s the scan rate.
The RDE setup allows quantifying metrics related to the major catalyst failure modes, Pt dissolution and Pt growth/agglomeration. The amount of Pt dissolved in the liquid electrolyte was determined by inductively coupled plasma mass spectroscopy (ICP–MS) with a platinum detection limit of 0.001 mg l−1. In order to assure a proper elemental analysis, the amount of Pt at the working electrode was increased to 80 μgPt/cm2electrode.
2.2 Elemental and structural analysis
The changes in particle size and distribution at the beginning and end of life were followed by transmission electron microscopy (TEM) examination. The images were obtained using a Philips CM 20 microscope operated at 200 kV. Particle size and size distribution were obtained by counting 500 particles per sample at the beginning and at the end of the measurements. To follow the change in particle size during the degradation procedures, the dispersion factor was used according to our previous studies [2].
3 Results and discussion
3.1 Effect of scan rate in triangle wave voltammetry – half-cell measurements
A cathode catalyst during its lifetime may expect potential sweeps in between three different regions. For a potential window between 0.6 and 1.2 V, these regions could be classified as:
- • a jump occurring within 10 ms [20];
- • a dynamic region that would include various scan rates and a number of cycles;
- • a steady state where the surface of the catalyst is mainly protected by the building of surface oxides [21,22].
Valuable literature is already available related to the catalyst behavior under the different situations described above [22–26]. However, little or no understanding has been developed so far of how to correlate the three situations above to the vehicle lifetime target. In order to be able to express the proposed target of 40% ECSA loss within 6000 h [27] for the three different regions in this study, we proceeded in two steps:
- • we kept constant the number of cycles to 10 000 and varied the scan rate;
- • we kept constant the testing time and varied the number of cycles.
The potential window was kept constant at 0.6–1.2 V in order to provoke an accelerated degradation of the catalysts from Pt dissolution and growth/agglomeration.
Fig. 2 illustrates the ECSA loss after 10 000 cycles for different scan rates versus the corresponding testing time. A commercial 50 wt% Pt/C (BASF) having a carbon corrosion-resistant support material was subjected to several TWC, at different scan rates of 600, 300, 200, 150, 20 mV/s to match 2, 4, 6, 8, 60 s per cycle. The data show that the ECSA after each 10 000 cycles varied from 20 to 60% loss. However, the individual traces of the ECSA losses overlap each other, resulting in a single profile of the losses over time. Furthermore, similar behavior was observed for 52 wt% PtCo/C (TKK) and 20 wt% PtNi/C (laboratory sample), represented in Fig. 3. Both alloys were initially dealloyed to core-shell structures after a method previously described [28]. The losses of ECSA after 10 000 cycles vary with the scan rates of 60, 150, and 240 mV/s, even though they follow the same loss profile with time. At a given point in time, the ECSA loss was found to be equal for all the different tests, independently of the number of cycles. After 10 000 cycles of a 2-s/cycle test, a 20% ECSA loss was observed, similar to only 300 cycles corresponding to a 60-s/cycle test. This behavior suggests that the number of cycles or the scan rate, within a given time period, does not contribute directly to the ECSA loss, while potential cycling between 0.6 to 1.2 V fits a similar trend. In fact, lowering the scan rate from 600 to 20 mV/s and keeping the number of cycles constant to 10 000 results in an increase of the total time that the catalyst is exposed to potential cycling.
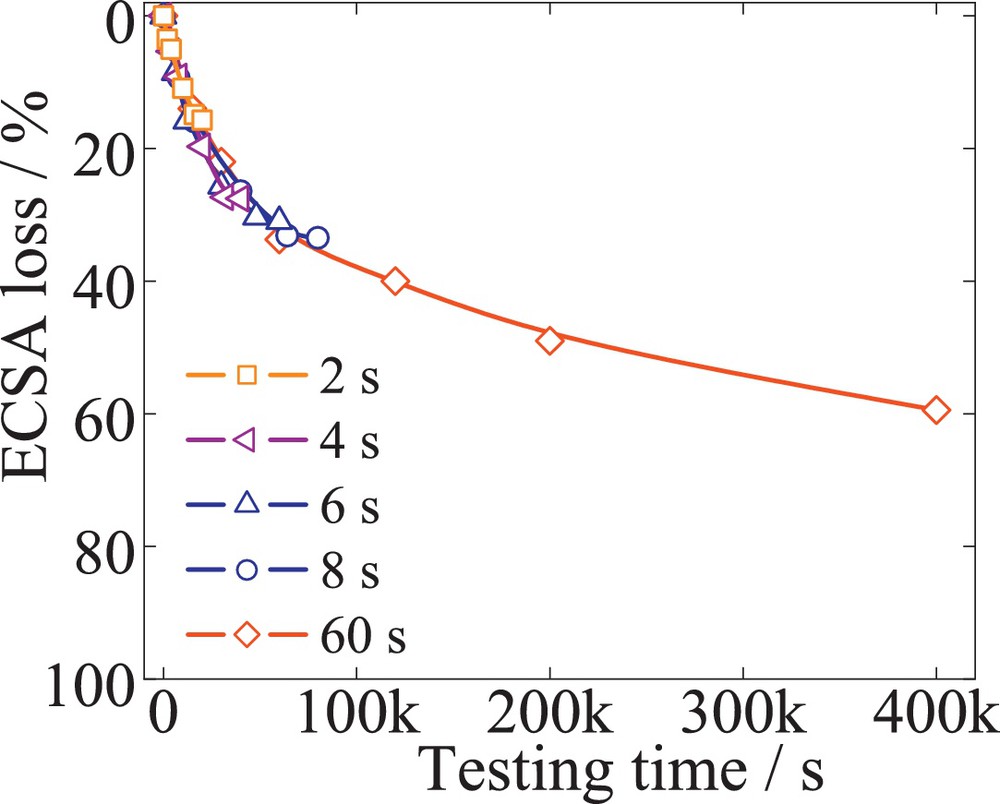
(Color online.) ECSA loss versus the testing time, for 50 wt% Pt/C (BASF), considering TWC with scan rates of 600, 300, 200, 150, 20 mV/s to match 2, 4, 6, 8, 60 s per cycle. For each scan rate, a fresh electrode was considered, and 10 000 cycles. Platinum loading was 80 μgPt/cm2.
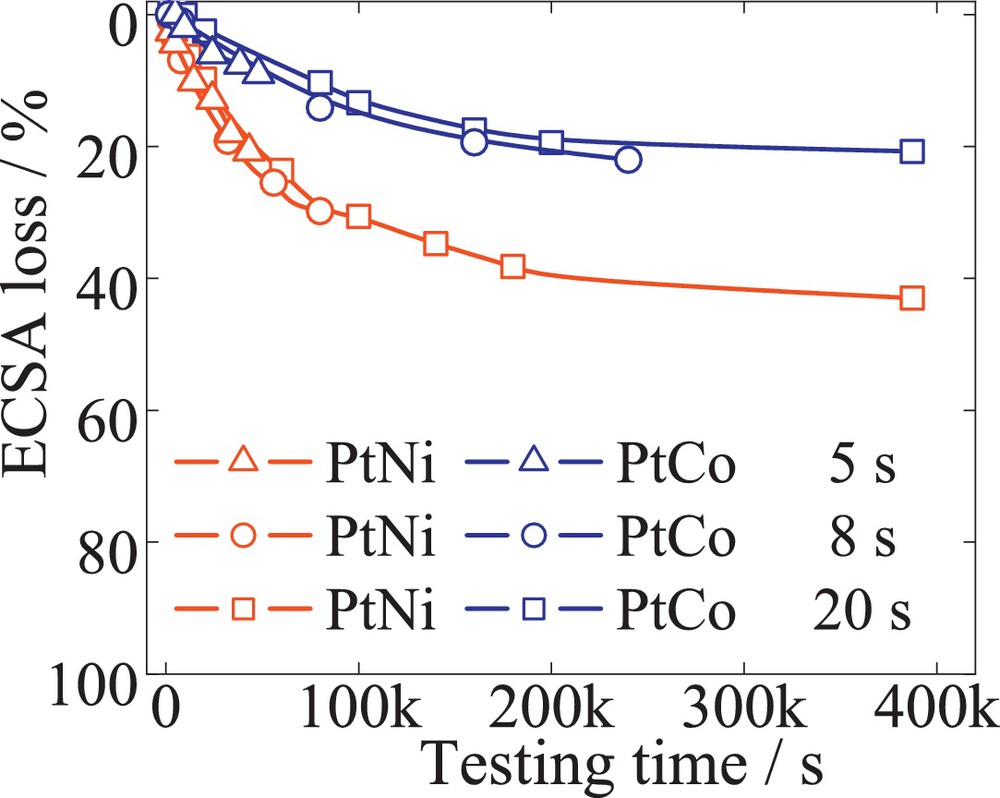
(Color online.) ECSA loss versus the testing time for 52 wt% PtCo/C (open circles), and 20 wt% PtNi/C (open squares). Considering TWC with scan rates of 240, 150 and 60 mV/s to match 5, 8, 20 s per cycle. For each scan rate, a fresh electrode was considered, and 10 000 cycles. Platinum loading was 30 μgPt/cm2.
To further support this observation, different Pt/C electrodes were exposed to cycling under a fixed total test time of 3 h and at scan rates of 0.33, 2.6, 5, 3000, 6000, and 10 000 mV/s, as illustrated in Fig. 4. Two limiting scan rates were found, which allowed us to distinguish between the three regimes described above. Varying the scan rate between 5, 3000 and 6000 mV/s within the same testing time resulted in similar ECSA losses, although the number of cycles was varied from 15 to 18 000 cycles. Due to the various scan rates and a number of cycles that can be found between 5 and 6000 mV/s, this region was identified as being dynamic. Moreover, increasing the time of one cycle to 1 h with a low scan rate of 0.33 mV/s, a steady-state situation develops at the surface of the catalyst. The path for nanoparticle degradation strongly depends on the surface state of Pt. The adsorption and types of oxides formed on the Pt surface depend on the voltage transition that can accelerate or passivate the corrosion mechanism [29–32]. A negligible 4 ± 3% variation in measured ECSA is within the error measurement and was found for different scan rates between 0.33 and 2.6 mV/s. The behavior, similar to a potential hold situation, could be the result of the lower scan rates that allow passivation of the active Pt surface, hindering the degradation process. The data are in good agreement with those of Paik et al. [33], who observed a higher ECSA loss for a 53 mV/s triangle cycle test compared to negligible losses at 2.6 mV/s over an 800-min cycling test. However, they attributed the discrepancy to the different numbers of cycles in between the two regimes. Contrary to the current understanding that the degradation depends on the number of cycles or the scan rate [24,34,35], we show that in the dynamic regime the number of voltage cycles is not observed to influence catalyst degradation. It rather appears to be an effect of ECSA loss with cumulative time spent under voltage transients. The cycling procedures contribute to surface oxide stripping and implicitly to supply with more catalytic active sites through surface roughening.
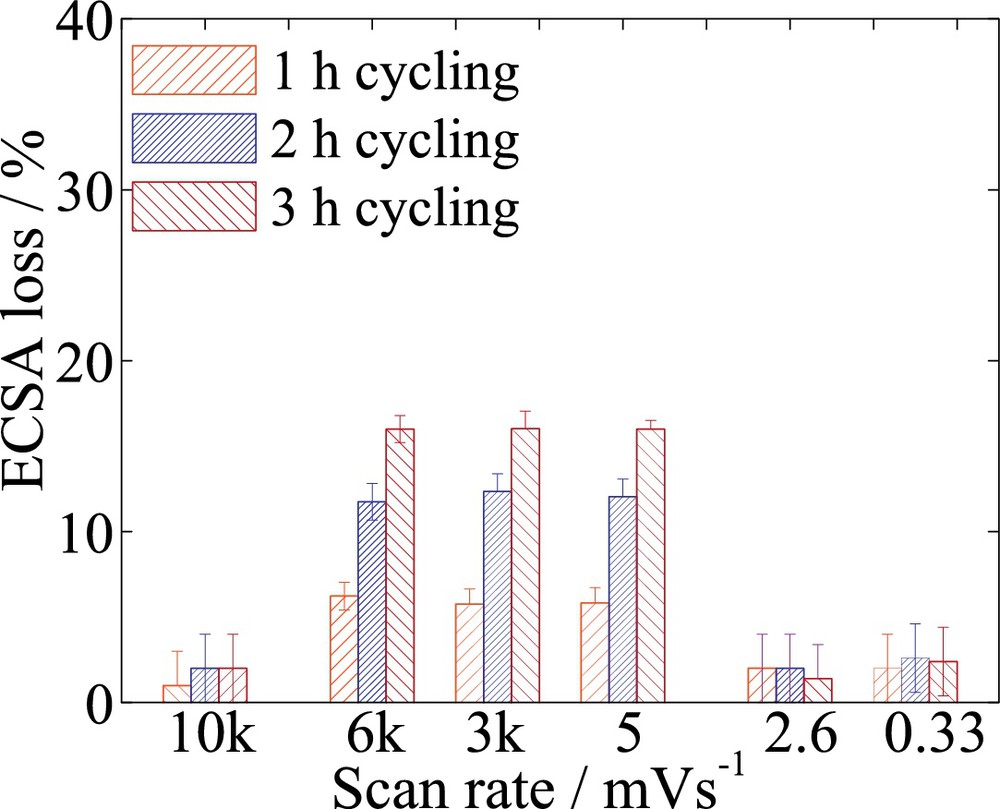
Effect of scan rate and of different numbers of cycles over ECSA loss for 50 wt% Pt/C (BASF). The total testing time was set for 3 h, stopping after each hour for basic voltammogram analysis. The scan rates considered were 0.33, 2.6, 5, 3000, 6000 and 10 000 mV/s. The number of cycles varied from 1, 8 to 15, 9000, 18 000 and 30 000 cycles per hour. Three different regions were identified: (i) jumps within 0.12 s, (ii) dynamic within 0.2–240 s, (iii) steady state from about 8 min to 1 h per cycle potentials. The platinum loading was 30 μgPt/cm2.
Furthermore, increasing the scan rate to 10 V/s in order to approximate a potential jump was found to result in a negligible 5 ± 2% variation in ECSA loss after 3 h of testing for 90 000 cycles. It has been reported by Mitsushima et al. [36] that the extent of Pt mass loss of a Pt wire after cycling between 0.5 and 1.8 V increases as the cycle frequency increases from 8 to 40 Hz. Increasing the scan rate above 10 V/s from 0.6 to 1.2 V requires 120 ms per cycle. In fact, this time is lower than the total time of 410 ms necessary for a square wave cycle to offer complete oxidation/reduction degradation under cycling between 0.6 and 1.2 V for a carbon-supported Pt nanoparticle catalyst [37]. Therefore, in this study, the higher scan rates approach the losses under the potential jump regime where the contribution of the Pt mass loss to the ECSA losses is negligible. In a previous research [38], we showed that Pt supported on high-surface-area carbon and Pt-coated nanowhiskers has similar behaviors using the different scan rates.
In normal fuel cell driving operations, the potential is known to vary between 0.6 and 0.85 V. The narrow voltage window and the low potentials lead to much lower degradation rates than cycling between 0.6 and 1.2 V. Fig. 5 illustrates the ECSA loss versus the testing time for both potential windows 0.6–0.85 V and 0.6–1.2 V. A 277-h test performed under the lower potential window with 400 mV/s resulted in only 20% ECSA loss. A logarithmic extrapolation of the data acquired under low-potential cycling suggests that the degradation of 40% ECSA loss would be achieved after 5000 h (considering a deviation of 10%). Considering that the degradation mechanism may be different, only 20 h were necessary to achieve the same percentages of ECSA loss after potential cycling from 0.6 to 1.2 V. A further acceleration of the testing time to 4 h was achieved with potential cycling between 0.6 and 1.2 V and by changing the potential cycle profile from triangle to square wave. This time would correspond to 5000 h of potential cycling between 0.6 and 0.85 V, as described in our previous research [37]. Furthermore, Fig. 5 shows an excellent correlation between the relative data measured on RDE and a single-cell run at 100% relative humidity (RH) under both potential regimes.
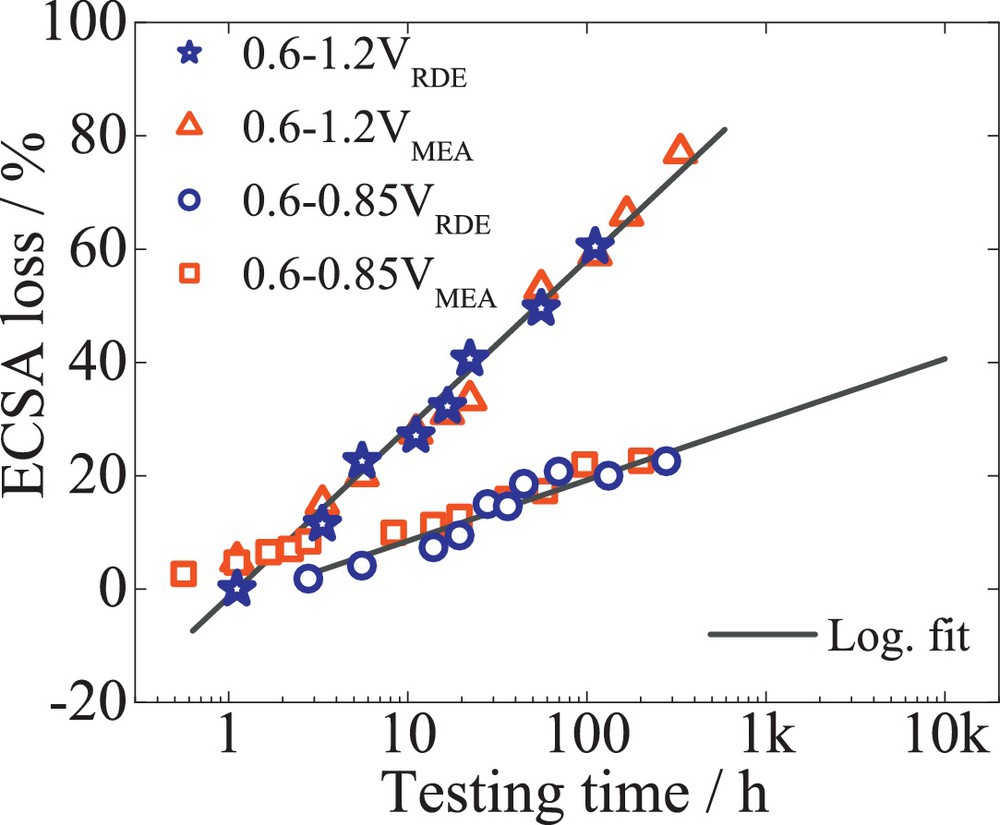
The impact of different potential windows, 0.6–1.2 V (empty triangles) and 0.6–0.9 V (empty circles) over the ECSA loss in time for 47 wt% Pt/C (TKK). The platinum loading was 30 μgPt/cm2. For comparison, the ECSA loss for 47 wt% Pt/C (TKK) determined in single-cell measurements is represented by empty squares.
3.2 Single-cell and half-cell electrochemical catalysts durability investigations
Commercial 47 wt% Pt/C (TKK), 52 wt% PtCo/C (TKK) and 20 wt% PtNi/C (laboratory sample) were subjected to 10 000 TWC, between 0.6 and 1.2 V, with a scan rate of 240 mV/s. The RDE tests were performed at a loading rate of 30 μgPt/cm2. The Pt surface area was determined by quantifying the Had charge of the basic voltammograms. A 5–8% difference was found between the two setup measurements. Fig. 6 reveals the losses of ECSA (empty symbols) and ORR mass activity measured at 0.9 V (filled symbols) versus the number of cycles determined in both RDE (circles) and MEA (squares) for Pt/C catalysts. The half-cell ECSA loss of 40% was found in good agreement with 45% ECSA loss determined from the single-cell. An excellent match was found between the theoretical surface area loss determined from TEM data analysis (filled triangles) and the RDE determined ECSA losses. A good correlation of the mass and specific activities between both setups was also observed, as illustrated in Table 1. Likewise, the losses of ECSA and ORR mass activity, for PtCo/C and PtNi/C alloy, from both setups follow in good agreement with each other, showing comparable degradation for both testing methods. For both alloys, an initial increase in the ECSA could be observed. The zero line in Figs. 7 and 8 represent the maximum ECSA obtained for PtCo/C and PtNi/C, respectively. This was associated with the electrochemical leaching of the transition metal component during cycling [28] and was considered to be the initial state of the catalysts. However, in single-cell testing, this behavior could be observed only for PtNi/C alloy and with a lower intensity than in the case of RDE. This could be attributed to the loss of base metal from conditioning of the MEAs and the potential control of the setup. It is known that all platinum–transition metal alloys are thermodynamically unstable at low pH and leach out the base metal from the nanoparticles, leading to an initial ORR activity decrease [39,40]. The rate of the mass activity decrease was found to be higher for PtNi/C catalysts than for PtCo/C. This could be attributed to the different particle size. The RDE measurements for the Pt alloys may show initially higher ORR mass activities than the single-cell data. Fig. 9 illustrates the loss of mass activities measured at 0.9 V for RDE and single-cell experiments versus the corresponding ECSA loss for PtCo/C catalysts. The measurements in both setups show a linear dependence with ECSA loss. The zero value on the y-axis as described above represents the maximum ECSA obtained for the catalysts. In RDE measurements, to achieve a maximum in ECSA, about 20% of ORR mass activity is lost. In the single-cell setup, a maximum ECSA is found from the beginning of the test. The initial PtCo/C ECSA measured in single-cell measurements (about 48.6 m2/gPt) has a corresponding mass activity of 0.21 A/mgPt, as shown in Table 1. The ECSA measured initially by RDE (43.1 m2/gPt) corresponds to an initial mass activity of 0.27 A/mgPt. The higher mass activity and lower surface area are attributed to the presence of the base metal in the outer layers of the catalyst nanoparticle [28]. However, after 800 potential cycles in an RDE setup, the transition metals leach out of the nanoparticle [28] resulting in a surface area increase to 51.4 m2/gPt. In fact, the increase in ECSA to a maximum value corresponds to the initial surface area measured in the single cell. However, the mass activity after 800 potential cycles, due to the loss of transition metal atoms, decreases to 0.22 A/mgPt, corresponding to the initial mass activity measured in the single-cell.
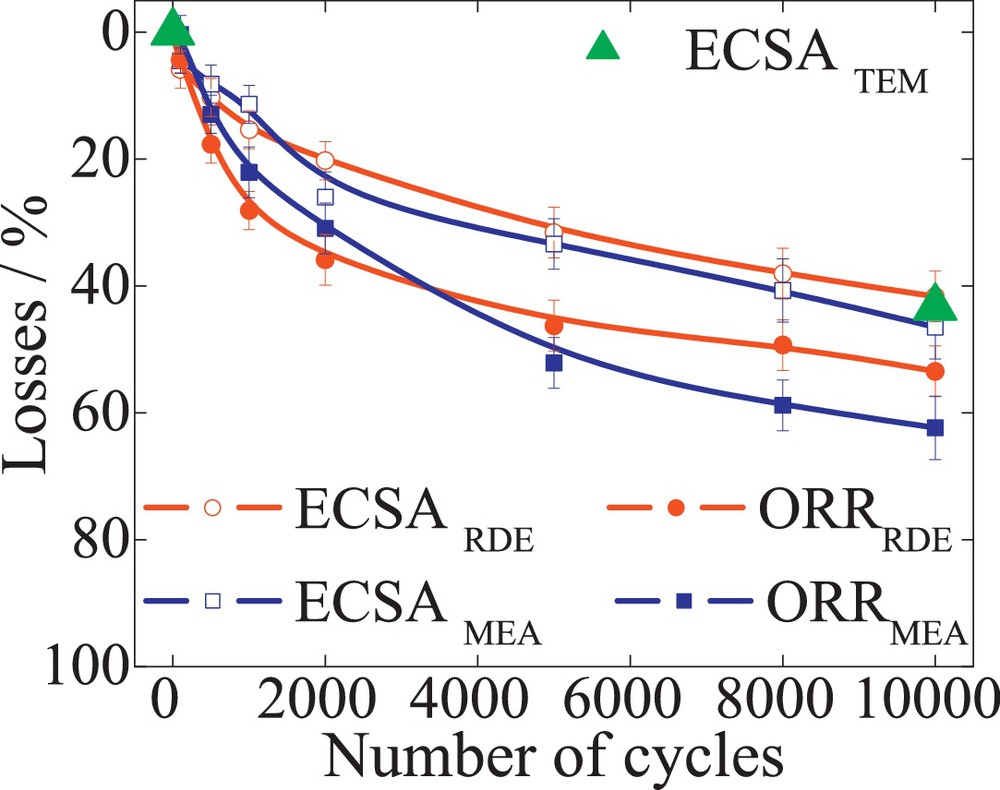
The losses of ECSA (empty symbols) and ORR mass activity (filled symbols) versus the number of cycles for 47 wt% Pt/C (TKK). The losses for the surface area were determined by quantifying the Hupd area for both RDE (circles) and MEA (square). The ECSA loss from TEM analysis is represented by filled triangles.
Catalysts characterization, ECSA and ORR mass activity.
| Single-cella | Half-cell | TEM | ||||||||
| BoL | ZL | EoL | BoL | ZL | EoL | BoL | EoL | |||
| Pt/C | ECSA m2/gPt | 75.6 | – | 40.9 | 90.6 | – | 51.3 | 93.0 | 52.7 | |
| ORR A/mgPt | 0.11 | – | 0.04 | 0.14 | – | 0.07 | – | |||
| PtCo | ECSA m2/gPt | 48.6 | – | 42.2 | 43.1 | 51.4 | 44.0 | 49.0 | 45.0 | |
| ORR A/mgPt | 0.21 | – | 0.08 | 0.27 | 0.22 | 0.11 | – | |||
| PtNi | ECSA m2/gPt | 49.4 | 59.7 | 42.1 | 52.7 | 63.8 | 45.1 | 62.2 | 48.0 | |
| ORR A/mgPt | 0.29 | 0.25 | 0.08 | 0.39 | 0.28 | 0.13 | – |
a ORR mass activities at 0.9 V, 85 °C and normalized to O2 partial pressure to 100 kPaabs.
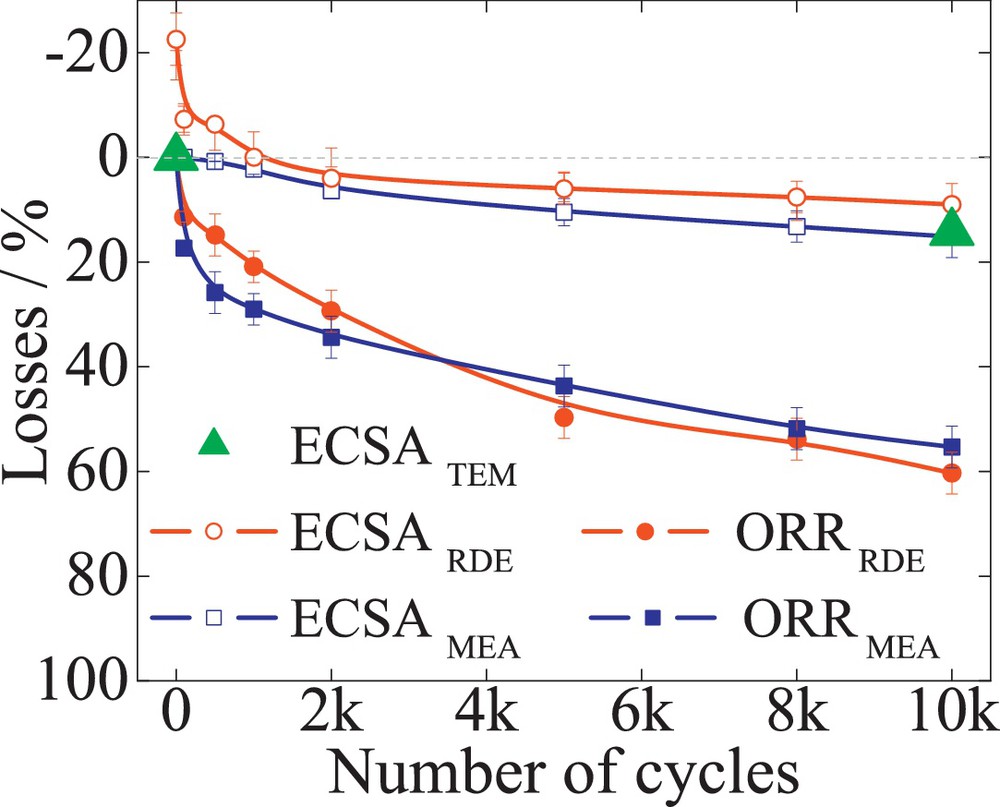
The losses of ECSA (empty symbols) and ORR mass activity (filled symbols) versus the number of cycles for 52 wt% PtCo/C (TKK). The losses for the surface area were determined by quantifying the Hupd area for both RDE (circles) and MEA (square). TEM determined ECSA are the filled triangles. The zero line represents the maximum ECSA obtained due to an electrochemical leaching of the transitional metal Co; this is associated with the formation of a core-shell structure.
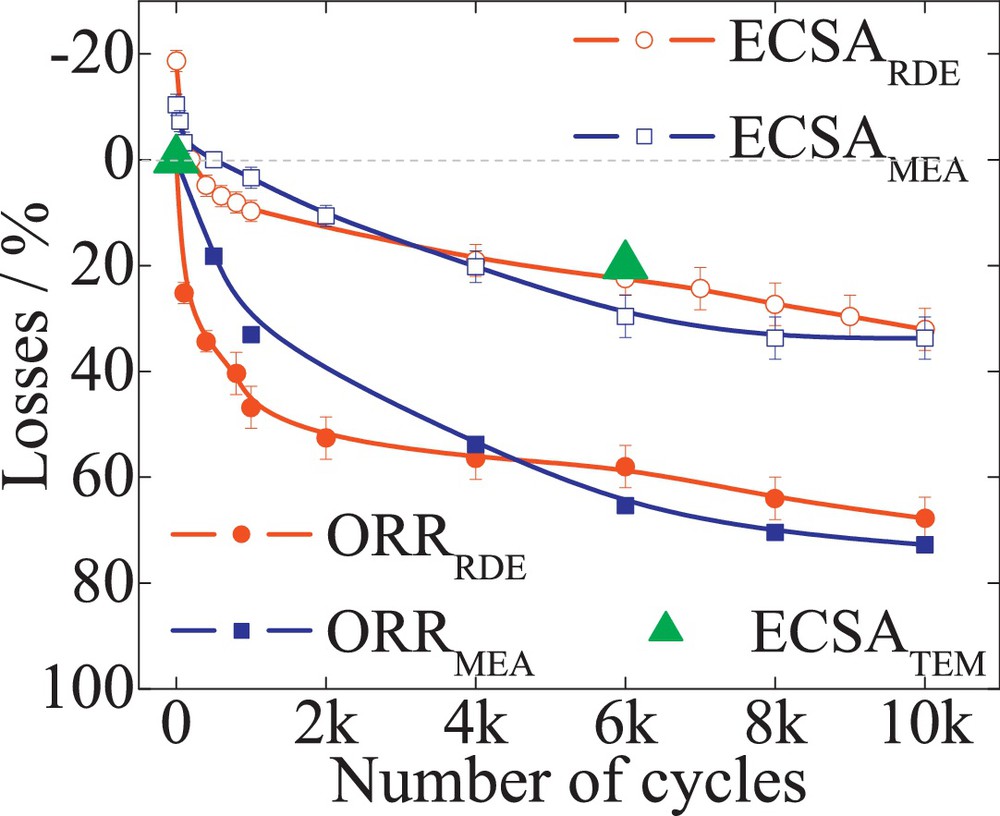
The losses of ECSA (empty symbols) and ORR mass activity (filled symbols) versus the number of cycles for 20 wt% PtNi/C (laboratory sample). The losses for the surface area were determined by quantifying the Hupd area for both RDE (circles) and MEA (square). TEM-determined ECSA are the filled triangles. The zero line represents the maximum ECSA obtained due to an electrochemical leaching of the transitional metal Ni; this is associated with the formation of a core-shell structure.
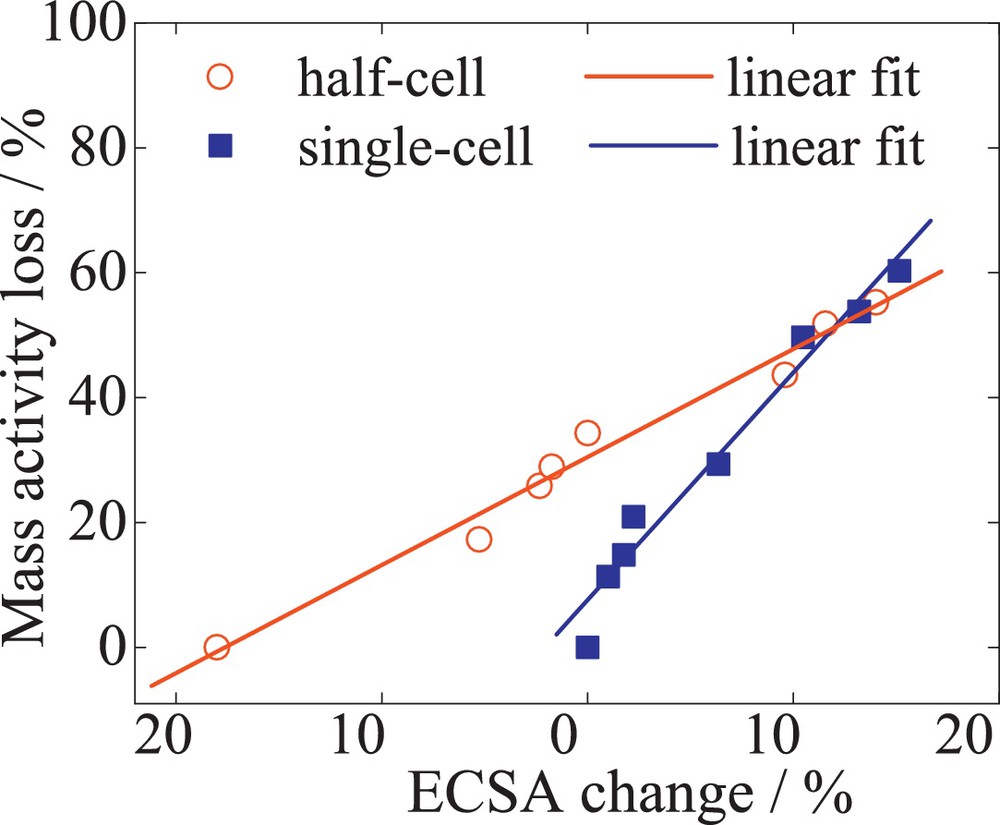
The linear dependence of the mass activity losses with the ECSA for single-cell (square) and half-cell (circles) measurements of 52 wt% PtCo/C (TKK). The single-cell ORR mass activities were determined at 0.9 V, 65 °C and normalized to an O2 partial pressure to 100 kPaabs.
Contrary to the PtCo/C alloy behavior, the PtNi/C test demonstrates an initial ECSA increase in both single-cell and RDE measurements. The matching values in this case, between single-cell and RDE, are recorded at the zero line of Fig. 8. The different observations in the initial behavior of the two catalyst systems could be attributed to the different preparation, processing, and pretreatment process of the catalysts nanoparticle as well as to the potential control over the single-cell setup.
The alloy behavior described above encourages the applicability of catalysts with core-shell structures. Since the initially advantageous characteristics of the catalysts are lost during pretreatment or potential cycling, it is preferable to target a 4 times higher activity than the state of the art after a maximum in ECSA has been achieved, which then represents the post-leached structure of the catalysts. The leaching process depends on the nanoparticle preparation, atomic ratio, and particle size [28,41].
Fig. 10 illustrates the influence of ECSA on the fuel cell performance loss for Pt/C (empty triangles), PtCo/C (empty circles) and PtNi/C (empty squares). H2-air performance losses at 0.1 A/cm2 were measured for 0, 1000, 5000 and 10 000 cycles. The predicted performance losses (solid line) based on Tafel kinetics – ΔE = RT/nF ln(ECA/ECAinitial) [32] were estimated with Tafel slope RT/nF at 65 °C and 2 bar of absolute pressure. The data indicate a decrease in the cell performance with ECSA loss. In good agreement with the predicted data, initially the losses in H2-Air performance are rather small. However, during the test, the losses increase significantly and slightly exceed those predicted. The kinetic performance losses were associated with catalyst degradation. The PtNi/C showed an increased 52 mV kinetic performance loss compared to Pt/C of 40 mV and PtCo/C of 10 mV losses. The increased kinetic loss could be attributed, among all catalyst failure modes, mainly to Ni leaching out of the nanoparticle. Moreover, since both testing methods result in similar losses, a correlation of the performance and the catalyst failure modes is provided.
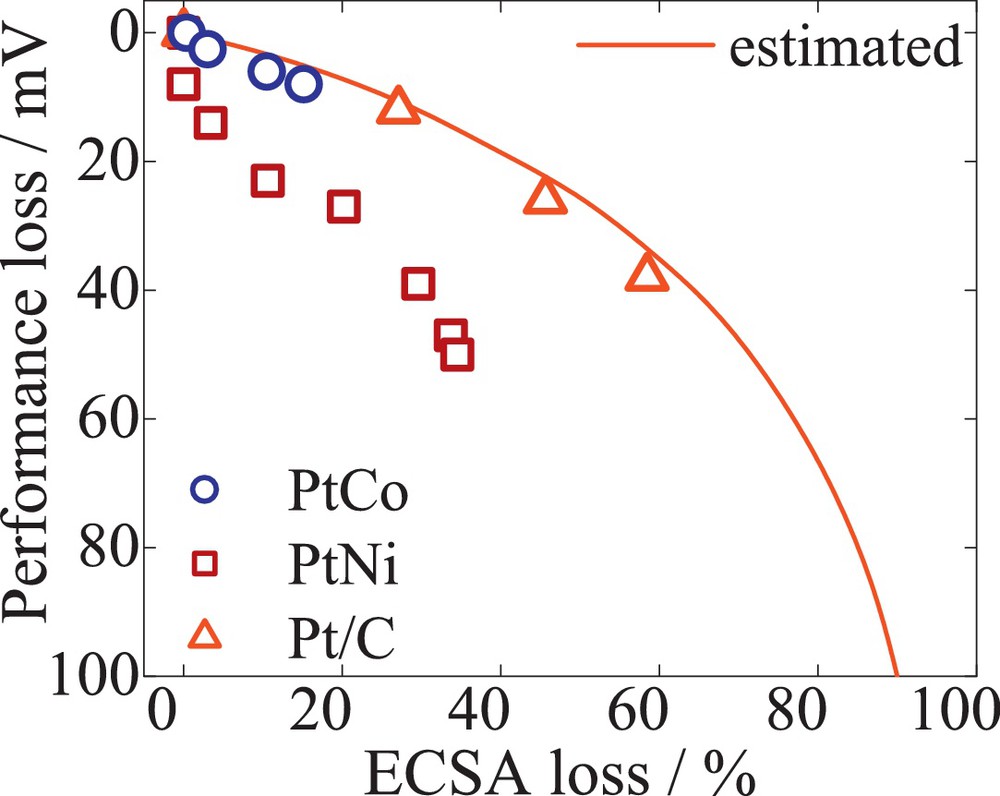
Performance losses due to ECSA decay over the voltage cycling test. The data were selected after 0, 1000, 5000 and 10 000 cycles. The performance was sampled at 0.1 A/cm2 under fully humidified H2/air reactants, the cell temperature was 65 °C, with a pressure of anode and cathode of 2 bar at atmospheric pressure. The predicted performance (solid line) was determined with Butler–Volmer equations, considering oxygen polarization conditions of 100% RH. The measured data were recorded for Pt/C (triangles), PtCo/C (circles), PtNi/C (squares).
3.3 Quantification of the catalysts’ performance loss
To unravel which of the catalysts’ nanoparticle failure modes has the biggest impact on the kinetic performance decay, we quantified the contributions of Pt dissolution, Pt agglomeration, and base metal leaching from RDE measurements. The metal losses were quantified from the liquid electrolyte after the corresponding number of cycles using ICP–MS. The changes in particle size and distribution at the beginning and end of life were followed by TEM imaging counting 500 particles. The initial volume-area mean particle size dva of the Pt/C catalyst was determined to be 2.8 ± 0.4 nm, 4.5 ± 0.3 nm for PtNi/C, and 6.0 ± 0.5 nm for PtCo/C. After voltage cycling, the particle size increased to 5.3 ± 0.4, 5.8 ± 0.4 and 6.2 ± 0.2 nm, respectively. To efficiently quantify the changes in particle size during cycling, the dispersion factor was determined and used according to our previous studies [2,28]. An excellent agreement was found for the ECSA and dispersion factors determined from the experimental data and those derived from TEM analysis for all catalysts, as shown in Table 2.
ECSA and dispersion from RDE and TEM.
| Half-cell | TEM | ||||
| ZL | EoL | ZL | EoL | ||
| Pt/C | ECSA m2/gPt | 90.6 | 51.3 | 93.0 | 52.7 |
| Dispersion | 0.34 | 0.19 | 00.37 | 0.21 | |
| PtCo | ECSA m2/gPt | 51.4 | 44.0 | 49.0 | 45.0 |
| Dispersion | 0.17 | 0.17 | 0.18 | 0.18 | |
| PtNi | ECSA m2/gPt | 63.8 | 45.1 | 62.7 | 48.0 |
| Dispersion | 0.20 | 0.16 | 0.24 | 0.19 |
Fig. 11 shows the measured performance losses at 0.1 A/cm2, and the cumulative Pt mass and dispersion losses versus the ECSA loss of the Pt/C catalyst tested over 10 000 cycles TWC. The results indicate a decrease in the kinetic performance of 40 mV, corresponding to an ECSA loss of 60%. Likewise, the Pt mass at the working electrode decreases with a significant final value of 28% from the initial mass. For the first 30% ECSA loss, the trace of the performance loss resembles that of the Pt mass. The loss in dispersion is rather negligible initially, indicating that the mV decay is initially dominated by irreversible Pt dissolution. After a decrease in ECSA of about 40%, the loss of Pt mass remains constant at 19%. In the same time, the dispersion losses increase and exceed those of Pt dissolution to a final 32% loss. In agreement with previous findings [2,28], the increase in particle size leads to a decrease in Pt mass loss. Therefore, at the end of the test, the loss of performance is mainly dominated by Pt particle growth/agglomeration.
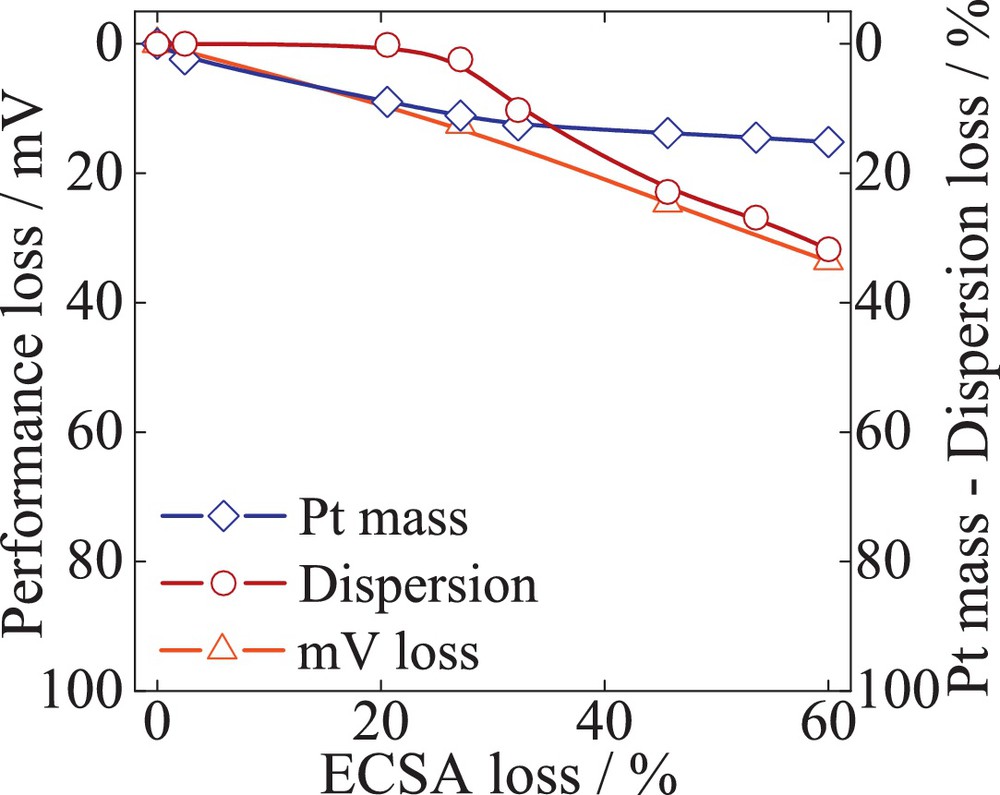
Quantification of the catalyst failures modes – Pt mass (Pt dissolution) and the dispersion (particle size change) correlated with performance mV loss over the cumulative decay of ECSA. The catalyst sample 47 wt% Pt/C (TKK) was exposed to potential cycling (0.6–1.2 V), with a scan rate of 240 mV/s.
Fig. 12 illustrates the losses of PtCo/C alloy catalysts. The data suggest that the total loss in performance of 12 mV is caused mainly by a decrease in Pt mass at the working electrode, with a total 4.5 ± 0.1 μgPt from initial 30 μgPt, while the dispersion losses are negligible. The high stability against growth/agglomeration of the alloy nanoparticle could be explained by the increased initial particle size of 6 nm. The losses of Co mass were found to be only 7%. Fig. 13 evaluates the quantitative contributions of the different degradation processes to the performance decay for PtNi/C catalyst. The data indicated a Pt mass decrease similar to that of the PtCo/C catalyst, 5.2 ± 0.4 μgPt of initial mass from initial 30 μgPt at the working electrode. However, the ECSA and performance losses are considerably higher compared to PtCo/C. About a 52-mV loss was recorded, corresponding to only 32% ECSA loss. Contrary to Pt/C catalysts, the degradation of PtNi/C is not initially dominated by Pt dissolution, but is rather the result of both mechanisms of dissolution and agglomeration occurring in parallel. Due to the initial particle size of 4.7 nm, the dispersion loss increases by 10% and the Pt mass loss by 16%, contributing to the final ECSA loss. Although we could attribute the contribution of Pt dissolution and dispersion to the ECSA loss, the performance decay trace more closely resembles the Ni mass loss. A 58% loss of Ni mass was recorded after 10 000 cycles. Hence the amount of Ni at the working electrode is initially only half of the Co amount. During cycling, however, the loss in specific ORR activity and therefore kinetic performance is considerably higher for PtNi/C catalysts. The comparison amongst the three materials suggests that the catalyst stability is affected by the particle size and the composition of the alloy.
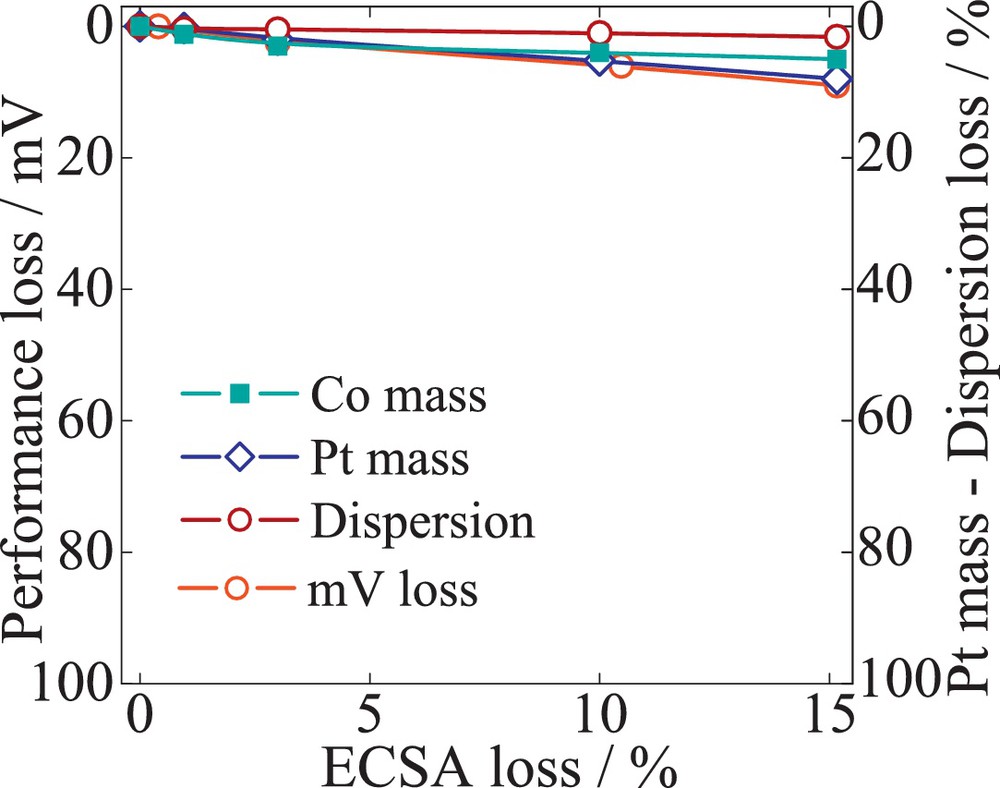
(Color online.) Quantification of the catalyst failures modes – Pt mass (Pt dissolution) and the dispersion (particle size change) correlated with performance mV loss over the cumulative decay of ECSA. The catalyst sample, 52 wt% PtCo/C (TKK), was exposed to potential cycling (0.6–1.2 V), with a scan rate of 240 mV/s.
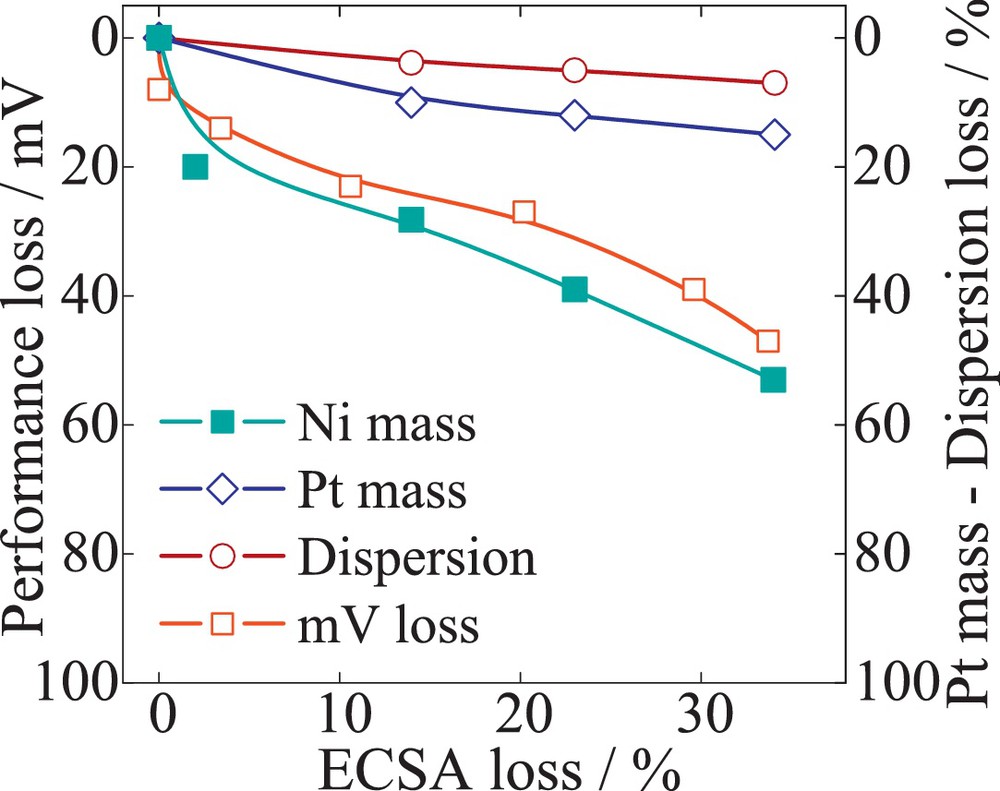
Quantification of the catalyst failures modes – Pt mass (Pt dissolution) and the dispersion (particle size change) correlated with performance mV loss over the cumulative decay of ECSA. The catalyst sample 20 wt% PtNi/C (laboratory sample) was exposed to potential cycling (0.6–1.2 V), with a scan rate of 240 mV/s.
4 Conclusion
Two limiting scan rates have been found to distinguish three different TWC regimes, dynamic: 5–6000 mV/s, steady state: 2.6–0.33 mV/s and jumps within 10 ms under potential cycling between 0.6 and 1.2 V. The last two regions have a negligible effect on the ECSA loss. The dynamic regime is characterized by a decrease in ECSA that is mainly dominated by the cumulative time spent under voltage transients. Furthermore, the losses were estimated and compared to the ECSA loss under normal driving cycles from 0.6 to 0.85 V. After about 5000 h of low-potential cycling, an estimated loss of about 40% was found. By increasing the upper potential limit to 1.2 V, an acceleration of the ECSA percentage losses within about 20 h has been achieved.
Single-cell and half-cell tests were performed and compared in order to understand the catalyst-related degradation in MEA. We show that it is necessary to consider and distinguish between the initial and maximum ECSA of an alloy. Due to the initial instability of the base metal, the characteristics of alloy catalysts in both setups could be different at the beginning of the test. However, we showed that once a core-shell structure is achieved, both testing methods result in similar ECSA and ORR activity losses. Careful consideration is also required when attempting to identify a four times higher activity for alloy materials. A quantification of the catalyst failure mode was provided and correlated with performance losses. Depending on the particle size, the performance loss could be dominated either only by Pt dissolution (PtCo/C) or by dissolution/agglomeration (Pt/C) and base metal loss (PtNi/C).