

1 Introduction
Over the past several decades, rapid depletion of fossil fuels along with an alarming increase in the concentration of greenhouse gases has suggested the requirement of alternative energy sources. Especially, low-temperature fuel cells, which directly convert chemical energy of fuels into electricity via electrochemical reactions, are considered as a clean and sustainable energy technology with low CO2 emission and almost water as a by-product [1]. Among several types of fuel cells, direct methanol fuel cells (DMFCs) have recently attracted great attention owing to simple storage and the low production cost of methanol, high conversion efficiency, low working temperature, and long operation time [2–4]. Moreover, the higher selectivity toward CO2 formation in electrochemical reactions of methanol compared with other alcohols establishes methanol fuel as one of the potential candidates [4,5]. However, there are still some technical challenges that need to be addressed for better commercialization of DMFCs, primarily the catalytic performance and stability. By designing new electrocatalysts with both better activity and CO tolerance for methanol oxidation reaction (MOR), these problems could be solved.
In reality, the support material plays a decisive role in both the activity and durability of catalysts, which is generally used for dispersing catalyst particles [6,7]. At present, black carbon, which is commonly Vulcan XC–72, is widely used as a support for platinum (Pt) catalysts in DMFCs because of its large surface area and high electrical conductivity [8,9]. However, the poor durability of these catalysts under practical conditions is still problematic considering the serious degradation of carbonaceous supports [10]. Recently, Pt supported on modified reducible metal oxide materials, such as SnO2 [11], WO3 [12], SiO2 [13], and CeOx [14], has been considered to be a promising candidate to replace the commercial Pt/C (E-TEK) catalyst for fuel cell applications. Among numerous metal oxides, titanium dioxide (TiO2) with prominent properties, such as effective cost, harmlessness, availability, and especially high corrosion resistance and good electrochemical stability in a highly corrosive environment, attracted great interest of researchers. However, the intrinsically low electric conductivity was the primary barrier for developing TiO2 as a support material for electrocatalysts in fuel cells [15].
In this study, the robust non-carbon Ti1-xIrxO2 (x = 0.1, 0.2, 0.3) supports with the high corrosion resistance in acidic and oxidative environment and high electrical conductivity were prepared by using a facile hydrothermal route without applying any surfactants and further heat treatment for solving the major restriction of the carbon support and the issue of the TiO2 material. Among several transition metals, iridium (Ir) shows many excellent properties, such as high stability, high electrical conductivity of 2.12 × 10⁵ S/cm [16], and the radius approximation of Ti4+ (0.605 Å) and Ir4+ (0.625 Å) [17]. The incorporation of Ir ions into the TiO2 lattice not only could enhance the intrinsically low electric conductivity of TiO2 [18] but also promoted the performance of Ir-doped TiO2-supported Pt NPs by the bifunctional mechanism, the electronic effect, and the strong metal-support interaction (SMSI) effect [19–21]. After doping, the electrical conductivity and surface area of Ti1-xIrxO2 materials are observed to be higher than those of the undoped TiO2 thanks to the very high electrical conductivity of Ir metal. Therefore, Ir-doped TiO2 materials have been considered as the promising materials for replacing carbonaceous materials prone to corrosion.
In addition, the possible applicability of a series of 20 wt. % Pt/Ti1-xIrxO2 catalysts toward methanol electro-oxidation in DMFCs was also investigated and they were compared with the commercial 20 wt. % Pt/C (E-TEK) catalyst. The same Pt loading of 20 wt. % was deposited on Ti1-xIrxO2 materials by a modified sodium borohydride reduction method. The cyclic voltammetry (CV) curves in the methanol solution showed that all of the 20 wt. % Pt/Ti1-xIrxO2 catalysts possess higher forward current density and smaller onset potential, a representative of catalyst activity, as compared with the commercial 20 wt. % Pt/C (E-TEK) catalyst. Moreover, the If/Ib ratios of 20 wt. % Pt/Ti1-xIrxO2 catalysts are significantly higher than that of the commercial 20 wt. % Pt/C (E-TEK) catalyst in all cases, suggesting their superior CO tolerance. The superior stability of 20 wt. % Pt/Ti1-xIrxO2 catalysts to the commercial 20 wt. % Pt/C (E-TEK) catalyst was confirmed by the chronoamperometric (CA) test. Finally, these results suggest that nanostructured 20 wt. % Pt/Ti1-xIrxO2 catalysts could be prospective candidates for anode electrocatalysis in DMFCs.
2 Experimental section
2.1 Materials
Iridium trichloride hydrate (IrCl3·xH2O, 99.9%, 52 wt. % Ir) was purchased from Sigma-Aldrich, USA, and titanium tetrachloride (TiCl4, 99.5%) was purchased from Aladdin, China. Hexachloroplatinic acid (H2PtCl6·xH2O, 99.9%, 38–40% Pt) was purchased from Sigma-Aldrich. Sodium borohydride (NaBH4, ≥98%) and sodium hydroxide (NaOH, ≥98%) were purchased from Sigma-Aldrich. Ethylene glycol (EG, 99.5%) and hydrochloric acid (HCl, 37%) were purchased from Merck, Belgium. All chemical reagents and solvents were used without further purification. Purified water was used during the experiments.
2.2 Synthesis
2.2.1 Synthesis of Ti1-xIrxO2 supports
Ti1-xIrxO2 supports with various iridium compositions (labeled as Ti0.9Ir0.1O2, Ti0.8Ir0.2O2, and Ti0.7Ir0.3O2) were carefully prepared from iridium trichloride hydrate and titanium tetrachloride precursors by the same facile hydrothermal route without applying any surfactants and further heat treatment. The appropriate amounts of titanium tetrachloride were mixed with the specified amounts of iridium trichloride hydrate for the synthesis of Ti1-xIrxO2 materials. Then, the solutions were adjusted to obtain the pH value of 1 by using 37% HCl solution and vigorous stirring at ambient temperature to obtain 50 mL of each homogeneous solution containing 28 mM TiCl4 and 12 mM IrCl3, 32 mM TiCl4 and 8 mM IrCl3, and 36 mM TiCl4 and 4 mM IrCl3 corresponding to the desired molar ratios of Ti:Ir (0.7:0.3, 0.8:0.2, and 0.9:0.1). Thereafter, the final solutions were transferred into Teflon-lined autoclaves to perform the hydrothermal process at 210 °C in 8 h and then the solutions were naturally cooled down to ambient temperature. Subsequently, Ti1-xIrxO2 precipitants were separated by centrifugation, filtered, and dried overnight in an oven at 80 °C for further analysis. Finally, undoped TiO2 materials were prepared by the same procedure as Ti1-xIrxO2 materials were used for comparison.
2.2.2 Synthesis of 20 wt. % Pt/Ti1-xIrxO2 catalysts
The same Pt loadings of 20 wt. % were anchored over the Ti1-xIrxO2 supports by using a modified reduction method with NaBH4 at ambient temperature. In a typical preparation method, the homogeneous suspensions were prepared by dispersing 110 mg of the Ir-doped TiO2 materials into the mixed solution of 3 mL of 0.05 M H2PtCl6, 0.5 mL of EG, and 25 mL of purified water associated with ultrasonic blending for 15 min, followed by adjusting the pH value to 11 by slowly adding the 1 M NaOH solution. Then, the reduction process was carried out by adding 3 mL of NaBH4 dropwise into the mixture under vigorous stirring for 2 h. Thereafter, the resultant products were collected by centrifugation, washed several times with purified water, and dried overnight at 80 °C in an oven. Finally, the obtained catalysts were stored in closed vessels before physical and electrochemical characterization. The 20 wt. % Pt/TiO2 catalyst synthesized by the same route as 20 wt. % Pt/Ti1-xIrxO2 catalysts and the commercial 20 wt. % Pt/C (E-TEK) catalyst were used for comparison.
2.3 Physicochemical characterization
The X-ray powder diffraction (XRD) measurement was performed by using a D2 PHASER-Brucker diffractometer in the 2θ angle range from 20° to 80° with a step width of 0.02°/s to analyze the phase structure of compounds. The catalyst particle size and dispersion were measured by transmission electron microscopy (TEM) on an FEI-TEM–2000 microscope at an acceleration voltage of 3.8 kV. The semiquantitative analysis of the Pt loading and Ti/Ir atomic ratios along with an elemental distribution in samples was carried out by the bulk energy-dispersive X-ray (EDX) technique on an EDX-JSM 6500F, JEOL instrument operating at a voltage of 200 kV. Furthermore, the Ti/Ir atomic ratios of Ti1-xIrxO2 materials were determined by the X-ray fluorescence (XRF) measurement on an S-mobile spectrometer (Xenemetrix, Israel) operating at a voltage of 3050 V. The surface area of Ti1-xIrxO2 materials was calculated based on nitrogen adsorption/desorption isotherms by using the Brunauer−Emmett−Teller (BET) method on a NOVA 1000e instrument at a temperature of 77 K. Before adsorption, the samples were baked at 200 °C for 6 h to eliminate moisture in material pores. The electrical conductivity of Ti1-xIrxO2 specimens was measured by the four-point probe technique on an MWP–6 instrument (Jandel, British). Previously, Ti1-xIrxO2 powders were compressed into cylindrical blocks with a radius of ∼5 mm and a height of ∼1 mm under a hydraulic pressure of approximately 300 MPa.
2.4 Electrochemical characterization
The activity, poisoning tolerance, and stability of catalysts were evaluated by CV and CA measurements on a potentiostat/galvanostat (Bio-Logic SAS) analyzer embedded with a three-electrode apparatus at ambient temperature. The applied auxiliary electrode was a titanium mesh coated with platinum, and the reference electrode was a KCl-saturated Ag/AgCl electrode; all the stated potentials were quoted on the normal hydrogen electrode (NHE) scale. For supporting thin films of catalysts, a glassy carbon electrode (GCE) with a surface area of 0.1964 cm2 was applied as a working electrode. Before catalyst deposition, the surface of the GCE was polished by using 0.4 μm of alumina polishing powder (BAS), and subsequently, it was washed many times with purified water so that there are no traces of impurity on its surface. The predetermined amounts of Pt/Ti1-xIrxO2 catalysts were dispersed into mixtures of ethanol and 0.5% Nafion solution, followed by sonication for 30 min to make homogeneous suspensions of 6.2 mg Pt/mL. Then, 7 μL of catalyst slurries was precisely pipetted on the surface core of the working electrode with the electrode Pt loadings of 0.22 mg Pt/cm2, and thereafter, it was naturally cooled down to form a thin layer. Before conducting CV measurements, the electrolyte solution was nitrogen pretreated for 30 min to remove the absorbed oxygen molecules. Initially, the catalyst-deposited electrode was activated by 20 scanning cycles at 100 mV/s in a potential interval of 0.0–1.2 V versus NHE. To evaluate the electrochemical surface area (ECSA) of catalysts, the CV measurements in the N2-saturated 0.5 M H2SO4 electrolyte at 50 mV/s from 0.0 V to 1.1 V versus NHE were carried out. For evaluating the CO tolerance possibility of catalysts, the CV measurement was galvanostatically conducted at a potential interval of 0.0–1.0 V versus NHE in N2-saturated 10 vol. % CH3OH in 0.5 M H2SO4 electrolyte at a scan rate of 50 mV/s. To examine the durability of 20 wt. % Pt/Ti1-xIrxO2 catalysts, the constant potential CA test for methanol electro-oxidation was conducted at 0.7 V versus NHE for 1 h in N2-saturated 10 vol. % CH3OH in 0.5 M H2SO4 electrolyte.
3 Results and discussion
3.1 Characterization of Ti1−xIrxO2 supports
The XRD measurements were carried out to quantify the phases in the structure of Ti1-xIrxO2 samples. According to XRD patterns, all three Ti1-xIrxO2 samples (Fig. 1) exhibited typical diffraction peaks at 25.1°, 38.1°, 47.5°, 54.4°, and 62.8° corresponding to (101), (004), (200), (105), and (204) facets of anatase TiO2 in the standard anatase TiO2 spectrum (JCPDS 84–1286), respectively. Exclusively, the intensive peak at 27.3° assigned to the rutile phase was observed in the XRD pattern of the Ti0.9Ir0.1O2 and Ti0.8Ir0.2O2 samples, indicating a partial phase transformation from the anatase to the rutile phase. The XRD profile also revealed the characterized peak of the brookite phase at 30.8° according to the (121) facet that distinguishes it from the anatase phase, indicating a minor phase shift from the anatase to the brookite form in the Ti0.7Ir0.3O2 sample. This phase transformation from the anatase to other TiO2 phases could be explained based on the chlorolysis−oxolation process that facilitates the formation of the rutile and the brookite phase [22]. XRD patterns also revealed that there is an inconsiderable decrease in the crystallinity of Ti1-xIrxO2 supports, which is caused by the penetration of chloride ions as well as the incorporation of Ir atoms into the TiO2 lattice [23,24]. No diffraction peaks of iridium oxides formed by the dopants could be defined at 28°, 34.5°, and 54° versus its standard spectrum (JCPDS 15–0870), suggesting that the obtained Ti1-xIrxO2 supports are actually a solid solution and Ir ions have successfully been doped into the TiO2 structure as demonstrated in our previous studies [19,20].
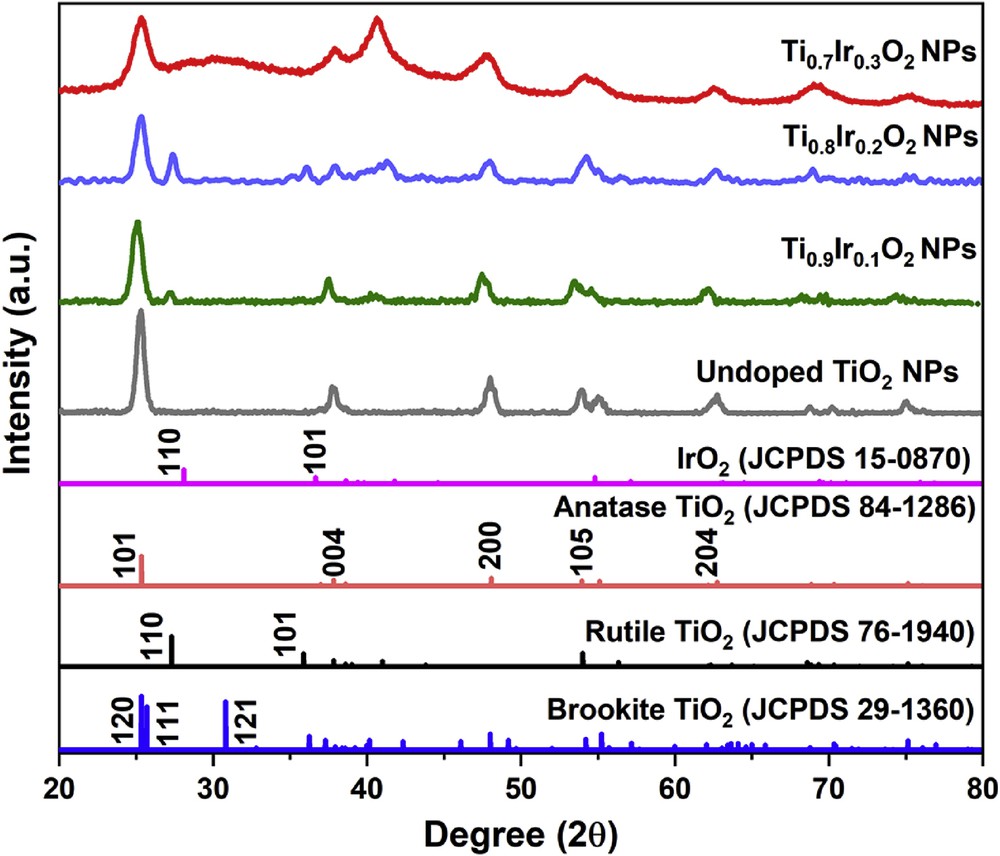
XRD patterns of Ti0.7Ir0.3O2, Ti0.8Ir0.2O2, Ti0.9Ir0.1O2, and undoped TiO2. XRD, X-ray powder diffraction.
To investigate the morphology of the Ti1-xIrxO2 nanomaterials, TEM was performed. The TEM graphs (Fig. 2) not only exhibited sphere-like and rod-like forms with the negligible disparity of less than 10 nm on account of the similar synthesis conditions but also displayed little agglomeration in Ti1-xIrxO2 samples, which could be caused by the facile synthesis route and the absence of surfactants or stabilizers in the procedure. Interestingly, only at a small amount of Ir dopants, the particle size of Ti0.8Ir0.2O2 and Ti0.9Ir0.1O2 was significantly smaller than that of undoped TiO2. Nevertheless, the same grain size of Ti0.7Ir0.3O2 as undoped TiO2 was observed when the atomic ratio of Ti and Ir attained the value of 0.7/0.3. It can be concluded that the appropriate contents of Ir (Ti/Ir atomic ratios over 0.7/0.3) in the TiO2 structure could hinder the grain growth of Ti1-xIrxO2 samples, leading to a decrease in the particle size. However, a reverse trend was followed when these dopant amounts were abundant (Ti/Ir atomic ratios below 0.7/0.3). Controlling the appropriate atomic Ti/Ir ratios (over 0.7/0.3) in the precursor solution could assist in restricting the increase in the particle size of Ti1-xIrxO2 samples to obtain the large surface area.
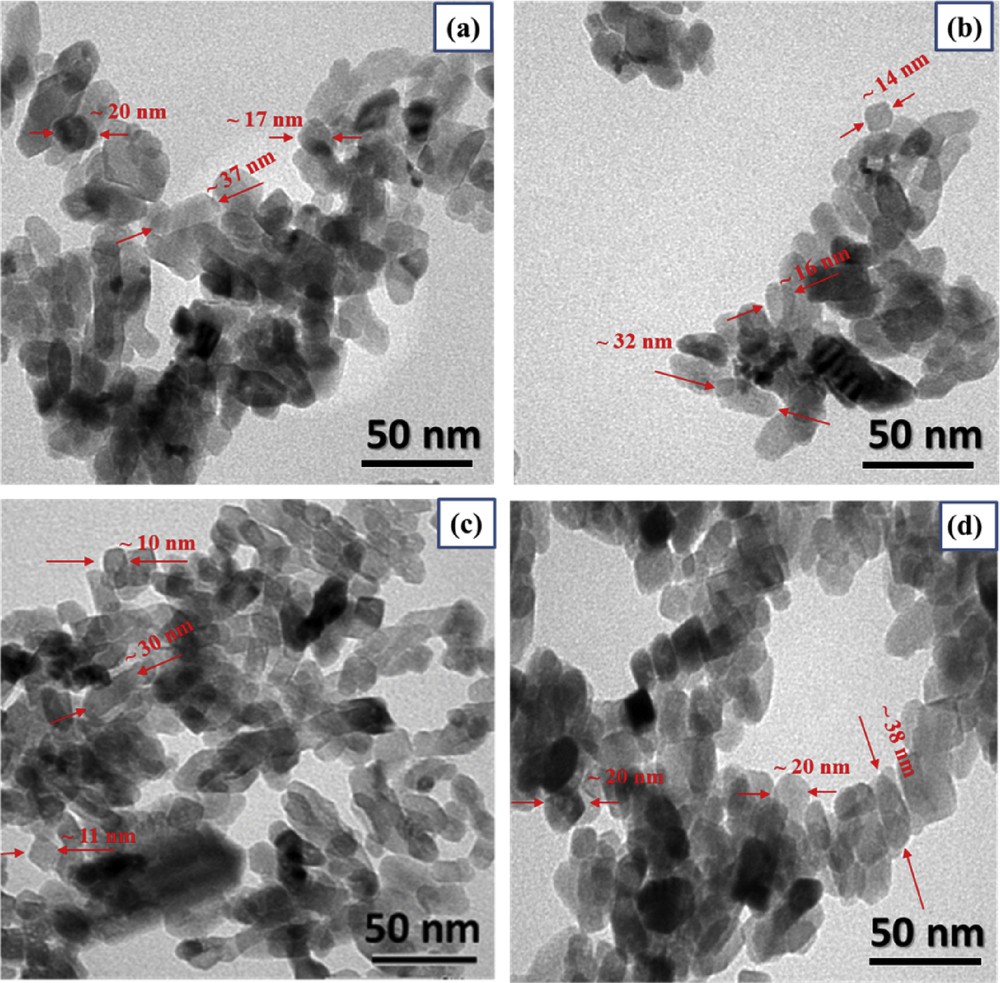
TEM images of (a) Ti0.7Ir0.3O2, (b) Ti0.8Ir0.2O2, (c) Ti0.9Ir0.1O2, and (d) undoped TiO2. TEM, transmission electron microscopy.
The EDX measurement was used to examine the Ti/Ir atomic ratio of Ti1-xIrxO2 materials (Fig. 3). For Ti0.7Ir0.3O2, Ti0.8Ir0.2O2, and Ti0.9Ir0.1O2 supports, the Ti/Ir atomic ratios were found to be 70.97/29.03, 80.65/19.35, and 90.58/9.42, respectively. These measured atomic ratios were compatible with the desired atomic ratios of Ti0.7Ir0.3O2 (70/30), Ti0.8Ir0.2O2 (80/20), and Ti0.9Ir0.1O2 (90/10), demonstrating the feasibility of the adopted synthesis method.
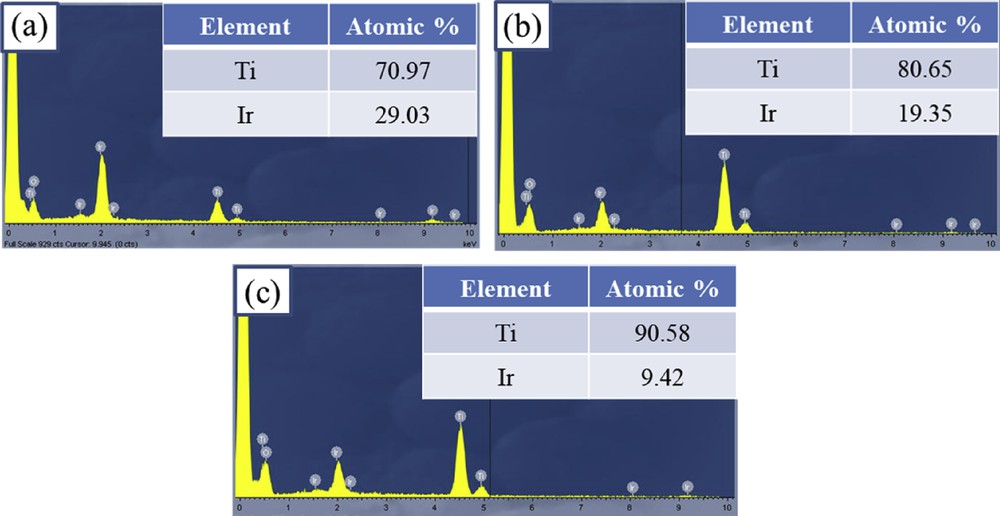
EDX spectroscopies of (a) Ti0.7Ir0.3O2, (b) Ti0.8Ir0.2O2, and (c) Ti0.9Ir0.1O2. EDX, energy-dispersive X-ray.
The XRF measurement was carried out for further examining the atomic ratio of Ti and Ir in Ti1-xIrxO2 materials. As shown in Fig. 4, there is a good correspondence between the measured Ti/Ir atomic ratios, namely, 70.734/29.266, 80.245/19.755, and 90.217/9.783, and the theoretical atomic ratios of Ti0.7Ir0.3O2 (70/30), Ti0.8Ir0.2O2 (80/20), and Ti0.9Ir0.1O2 (90/10). These results demonstrated that the Ti/Ir ratio in Ti1-xIrxO2 supports could be simply controlled by adjusting proportions of the IrCl3·xH2O precursor to the TiCl4 precursor in the facile hydrothermal method without using any surfactant or capping agent.
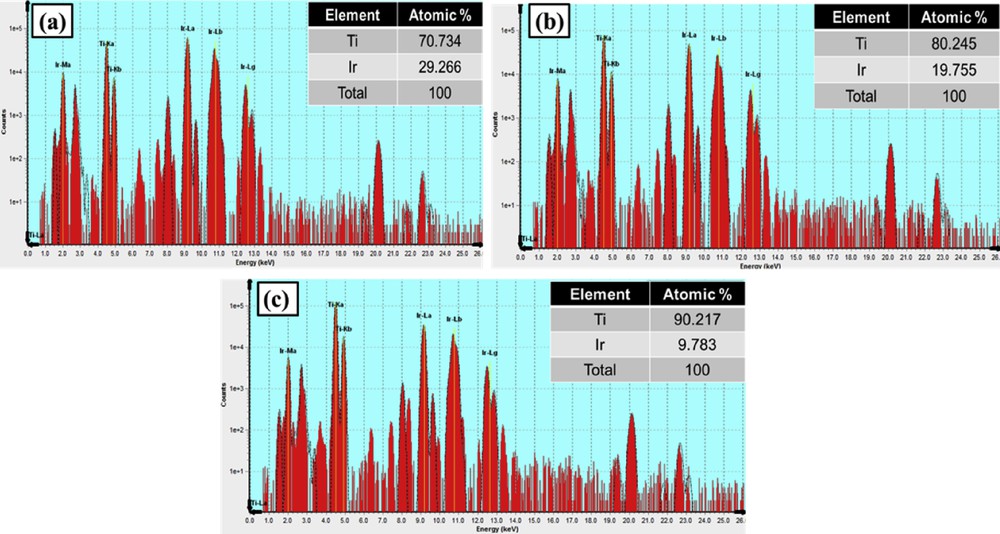
XRF graphs of (a) Ti0.7Ir0.3O2, (b) Ti0.8Ir0.2O2, and (c) Ti0.9Ir0.1O2. XRF, X-ray fluorescence.
A comparison of the surface area and the electrical conductivity between Ti1-xIrxO2 materials and other materials reported in the literature is shown in Table 1. Based on nitrogen adsorption/desorption isotherms, the BET method was used to calculate the surface area of Ti1-xIrxO2 supports. Table 1 shows that the surface area of Ti1-xIrxO2 supports increases with a decrease in the Ir composition in the following order: 87.52 m2/g (Ti0.7Ir0.3O2) < 98.15 m2/g (Ti0.8Ir0.2O2) < 106.03 m2/g (Ti0.9Ir0.1O2). It could be depicted that the surface area of Ti1-xIrxO2 supports strongly depends on their Ir composition and morphology [25]. As shown in TEM images (Fig. 2), the decrease in the surface area of Ti1-xIrxO2 supports with more introduced Ir ions could be attributed to the rise in the particle size of these materials. In this study, all Ti1-xIrxO2 samples exhibited higher surface area than the undoped TiO2 (84.13 m2/g) in this work, which could be caused by the lattice expansion of TiO2 after Ir doping due to the ionic radius difference (0.02 Å) between Ti4+ and Ir4+ [17,26]. In addition, the smaller size and less agglomeration obtained by the facile hydrothermal route without using surfactants and stabilizers were also responsible for the larger surface area of Ti1-xIrxO2 materials as compared with different materials, such as Tin-doped indium oxide (ITO) [27], Ti0.7Nb0.3O2 [28], and Ti0.8Ta0.2O2, studied in others works [10].
The comparison in surface area and electrical conductivity between Ti1-xIrxO2 materials and different materials in other research studies.
| Materials | Synthesis method | Ti:M ratios | Surface area (m2/g) | Electrical conductivity (S/cm) | Literature |
| Ti0.7Ir0.3O2 | Hydrothermal method | 70.97:29.03 | 87.52 | 3 × 10⁻² | In this work |
| Ti0.8Ir0.2O2 | Hydrothermal method | 80.65:19.35 | 98.15 | 2.5 × 10⁻² | In this work |
| Ti0.9Ir0.1O2 | Hydrothermal method | 90.58:9.42 | 106.03 | 1.6 × 10⁻² | In this work |
| TiO2 | Hydrothermal method | 100:0 | 84.13 | 4.15 × 10⁻⁷ | In this work |
| ITO | Solgel method | – | 71.67 | – | [27] |
| Ti0.7Nb0.3O2 | Hydrothermal method | – | 46.00 | 1.4 × 10⁻² | [28] |
| Ti0.8Ta0.2O2 | Solgel method | – | 18.00 | 5.78 × 10⁻³ | [10] |
| Ti0.7Mo0.3O2 | Hydrothermal method | 69.32:30.68 | – | 2.8 × 10⁻⁴ | [29] |
A four-point probe technique was used to measure the electrical conductivity of Ti1-xIrxO2 samples. As shown in Table 1, the electrical conductivity of Ti1-xIrxO2 samples was found to significantly increase with the introduction of more additives into TiO2 materials in the ascending order, Ti0.9Ir0.1O2 (1.6 × 10⁻² S/cm) < Ti0.8Ir0.2O2 (2.5 × 10⁻² S/cm) < Ti0.7Ir0.3O2 (3 × 10⁻² S/cm), thus suggesting that the Ir composition strongly influences the electrical conductivity of Ti1-xIrxO2 materials. Moreover, the electrical conductivity of Ti1-xIrxO2 samples was also higher than that of different materials, such as Ti0.7Nb0.3O2 [28], Ti0.8Ta0.2O2 [10], and Ti0.7Mo0.3O2, used in earlier works [29]. Especially, the highest electrical conductivity observed for Ti1-xIrxO2 with the Ir content of 30 mol.% was 0.03 S/cm, which was ∼105 times higher than that of the self-synthesized undoped TiO2 (4.15 × 10⁻⁷ S/cm). It is proposed that the significantly enhanced electrical conductivity with higher Ir content of these Ti1-xIrxO2 materials can be attributed to the intrinsic high conductivity of the Ir metal (2.12 × 10⁵ S/cm) [27] and the increase in the concentration of aliovalent ions (donors and acceptors) [30,31] resulting from the doping into the TiO2 structure with Ir ions.
The electrochemical stability of Ti1-xIrxO2 materials was determined by using an accelerated durability test in N2-saturated 10 vol. % CH3OH in 0.5 M H2SO4 electrolyte at 50 mV/s and compared with the self-synthesized undoped TiO2. Fig. 5 shows the cyclic voltammograms of Ti1-xIrxO2 materials and the undoped TiO2 material measured by potential scanning from 0.0 V to 1.2 V versus NHE. These voltammograms show the formation of the oxide layer formation through the hydroquinone–quinone (HQ–Q) redox process and a small peak of around 0.6 V according to the oxidation of carbonaceous functional groups in the Nafion solution [32]. Especially, the oxide layer of Ti1-xIrxO2 materials and the undoped TiO2 material almost remains unchanged after the 2000-cycle stability test, confirming the superior electrochemical stability of TiO2-based materials in highly corrosive environments [33,34].
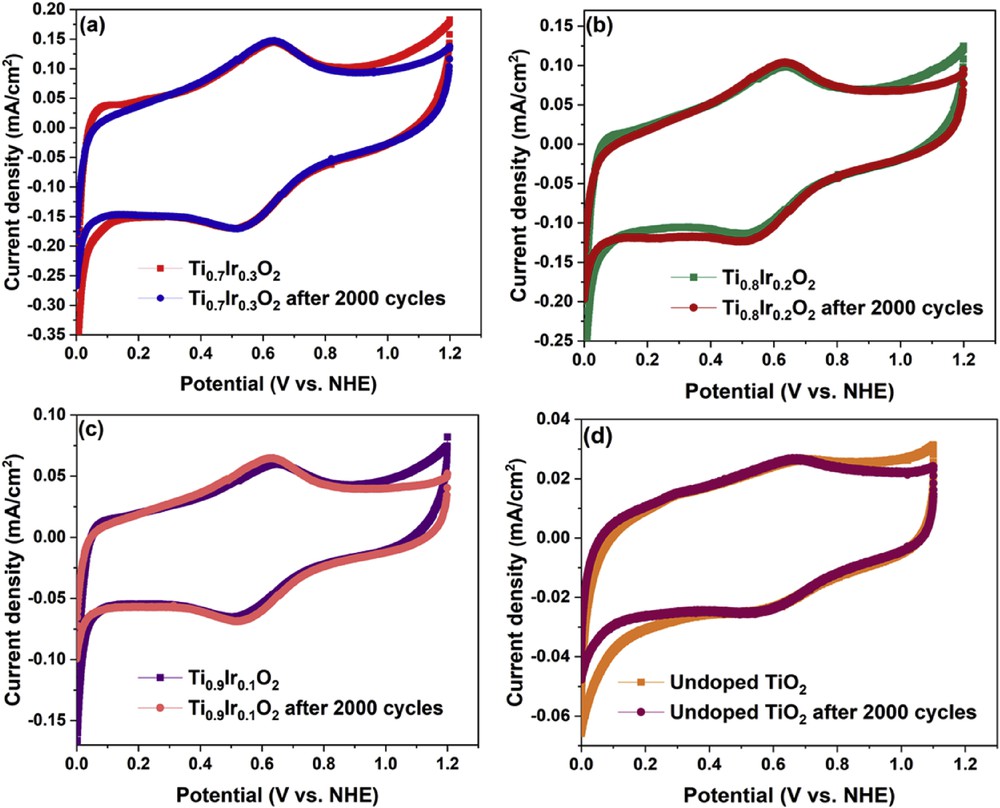
Cyclic voltammetric responses of (a) Ti0.7Ir0.3O2, (b) Ti0.8Ir0.2O2, (c) Ti0.9Ir0.1O2, and (d) undoped TiO2 supports after 1 scanning cycle and 2000 scanning cycles recorded in N2-saturated 10 vol. % CH3OH in 0.5 M H2SO4 electrolyte at a scan rate of 50 mV/s.
3.2 Characterization of 20 wt. % Pt/Ti1-xIrxO2 catalysts
The XRD measurement was used to conduct the structural analysis of 20 wt. % Pt/Ti1-xIrxO2 catalysts. As illustrated in Fig. 6, all catalysts clearly displayed three characteristic peaks of the face-centered cubic structure of Pt crystals at 39.76°, 46.24°, and 67.45° corresponding to the (111), (200), and (220) facets of the Pt standard spectrum (JCPDS 04–0802), respectively. Particularly, the most intensive peak of all three samples at 39.76° corresponding to (111) facet suggests that Pt NPs primarily prefer to form on the (111) plane. In addition, some slightly broadened diffraction peaks might be the result of the small grain size of Pt particles with a wider diffraction peak superimposing on the diffraction peaks of supports as can be seen from TEM images (Fig. 7). No diffraction peaks of the single-phase IrO2 or TiO2 were observed in Pt/Ti1-xIrxO2 samples, suggesting that 20 wt. % Pt/Ti1-xIrxO2 catalysts were stable under the strong reduction of NaBH4.
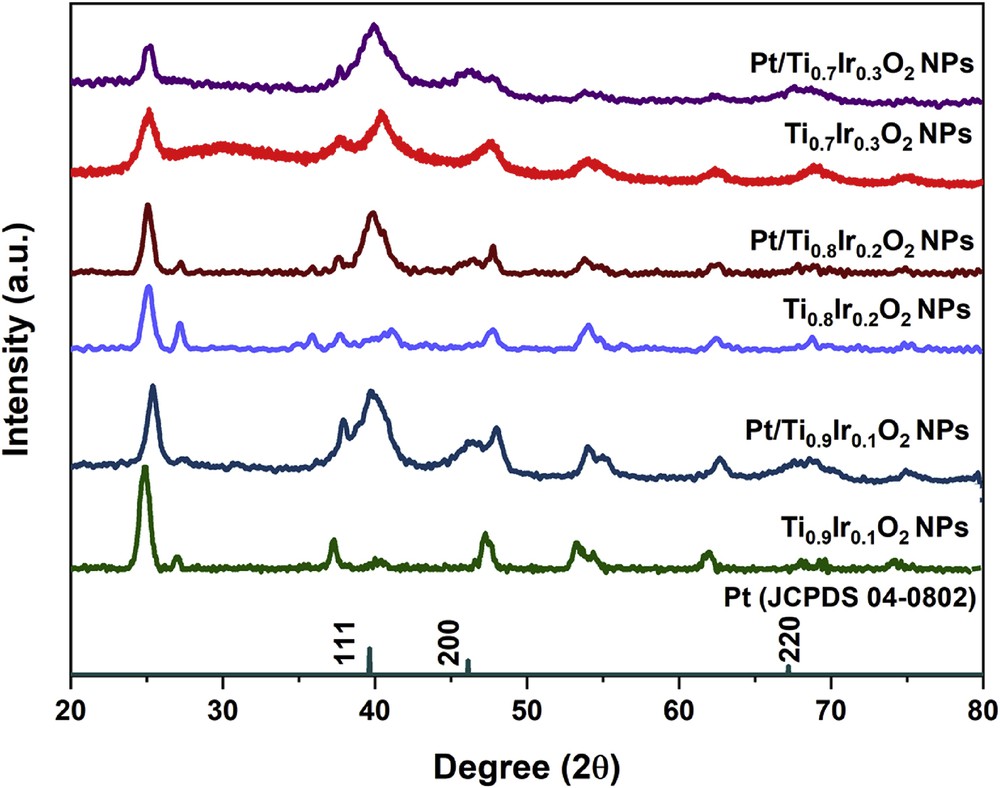
XRD patterns of 20 wt. % Pt/Ti0.7Ir0.3O2, 20 wt. % Pt/Ti0.8Ir0.2O2, and 20 wt. % Pt/Ti0.9Ir0.1O2 catalysts. XRD, X-ray powder diffraction.
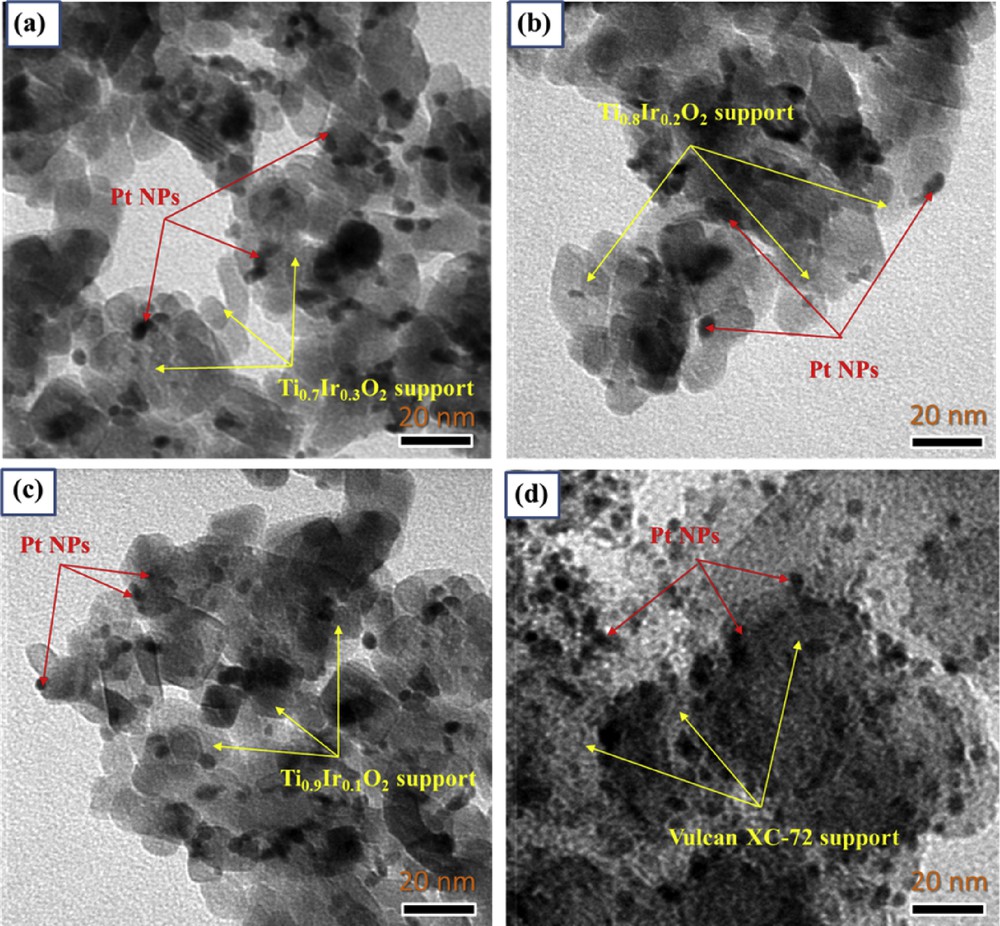
TEM images of catalysts (a) 20 wt. % Pt/Ti0.7Ir0.3O2, (b) 20 wt. % Pt/Ti0.8Ir0.2O2, (c) 20 wt. % Pt/Ti0.9Ir0.1O2, and (d) 20 wt. % Pt/C (E-TEK). TEM, transmission electron microscopy.
The TEM measurements were used to characterize the catalyst particle size and dispersion. Fig. 7 clearly shows that particle sizes of Pt NPs on Ti1-xIrxO2 supports were the same as those of the commercial 20 wt. % Pt/C (E-TEK) catalyst with a diameter of particles of around 3 nm. Particularly, Pt/Ti1-xIrxO2 catalysts showed the relatively uniform distribution of nanosized Pt particles over the surface of Ti1-xIrxO2 supports, which seem to be the result of the good characteristics of nanostructured Ti1-xIrxO2 supports and the strong interaction between Pt NPs and TiO2-based supports as reported in the preceding studies [9,29]. These relatively dispersed Pt NPs with small sizes and the aforementioned good properties of Ti1-xIrxO2 supports have been considered as decisive factors in the performance of fuel cells [35]. Moreover, this also indicates that the modified reduction method with NaBH4 is an appropriate technique to platinize on Ti1-xIrxO2 supports.
To confirm the catalyst loading and elemental distribution in the catalyst samples, the EDX mapping measurement was implemented. As illustrated in Fig. 8, EDX spectroscopies show that the Pt loading for Pt/Ti0.7Ir0.3O2, Pt/Ti0.8Ir0.2O2, and Pt/Ti0.9Ir0.1O2 was found to be 19.75 wt. %, 19.51 wt. %, and 19.64 wt. %, respectively, which in turn were consistent with the desired content of 20 wt. % Pt on the overall weight of catalysts, indicating the complete reduction of Pt through the preparation process. On the other hand, the EDX mapping graphs observed on several selected areas of samples confirmed the good dispersion of Pt NPs over the surface of supports corresponding to the uniform dispersion of Ti and Ir elements in Ti1-xIrxO2 supports. Furthermore, it could be suggested that the facile reduction method with NaBH4 is highly conducive for the deposition of Pt NPs on Ti1-xIrxO2 supports.
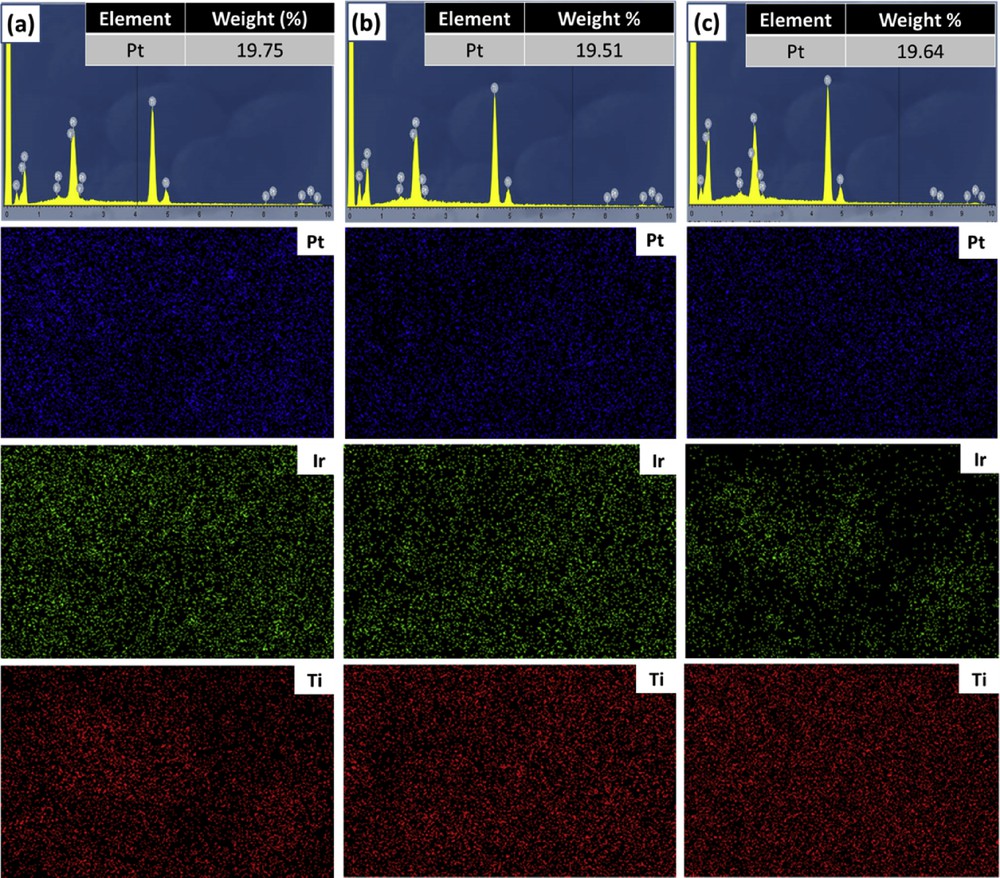
EDX spectroscopies and elemental distribution maps of catalysts (a) 20 wt. % Pt/Ti0.7Ir0.3O2, (b) 20 wt. % Pt/Ti0.8Ir0.2O2, and (c) 20 wt. % Pt/Ti0.9Ir0.1O2. EDX, energy-dispersive X-ray.
Cyclic voltammograms recorded in the N2-saturated 0.5 M H2SO4 electrolyte at 50 mV/s at ambient temperature could be used to evaluate the ECSA of the 20 wt. % Pt/Ti1-xIrxO2 catalysts and the commercial 20 wt. % Pt/C (E-TEK) catalyst. As illustrated in Fig. 9, hydrogen adsorption/desorption peaks with different current intensities were found along with the region where the double layer was formed. Based on the hydrogen adsorption/desorption method [36], the ECSA of 20 wt. % Pt/Ti0.9Ir0.1O2, 20 wt. % Pt/Ti0.8Ir0.2O2, and 20 wt. % Pt/Ti0.7Ir0.3O2 catalysts was estimated to be about 85.12, 86.51, and 89.75 m2/g Pt, respectively, which was much higher than that of the commercial 20 wt. % Pt/C (E-TEK) catalyst (61.39 m2/g Pt) and the 20 wt. % Pt/TiO2 catalyst (48.36 m2/g Pt). It might be caused by the ‘hydrogen spillover’ phenomenon through the migration and adsorption of H2 molecules onto TiO2-based supports, which led to increased ECSA of 20 wt. % Pt/Ti1-xIrxO2 catalysts [37,38] as compared with the 20 wt. % Pt/C (E-TEK) catalyst in conjunction with the much higher electrical conductivity of Ti1-xIrxO2 supports as compared with the undoped TiO2 support which is the reason for the higher ECSA of 20 wt. % Pt/Ti1-xIrxO2 catalysts than that of the 20 wt. % Pt/TiO2 catalyst [8]. In addition, doping more Ir ions into supports inconsiderably augmented ECSA values for the 20 wt. % Pt/Ti1-xIrxO2 catalysts because of the same particle size and a similar dispersion of Pt NPs.
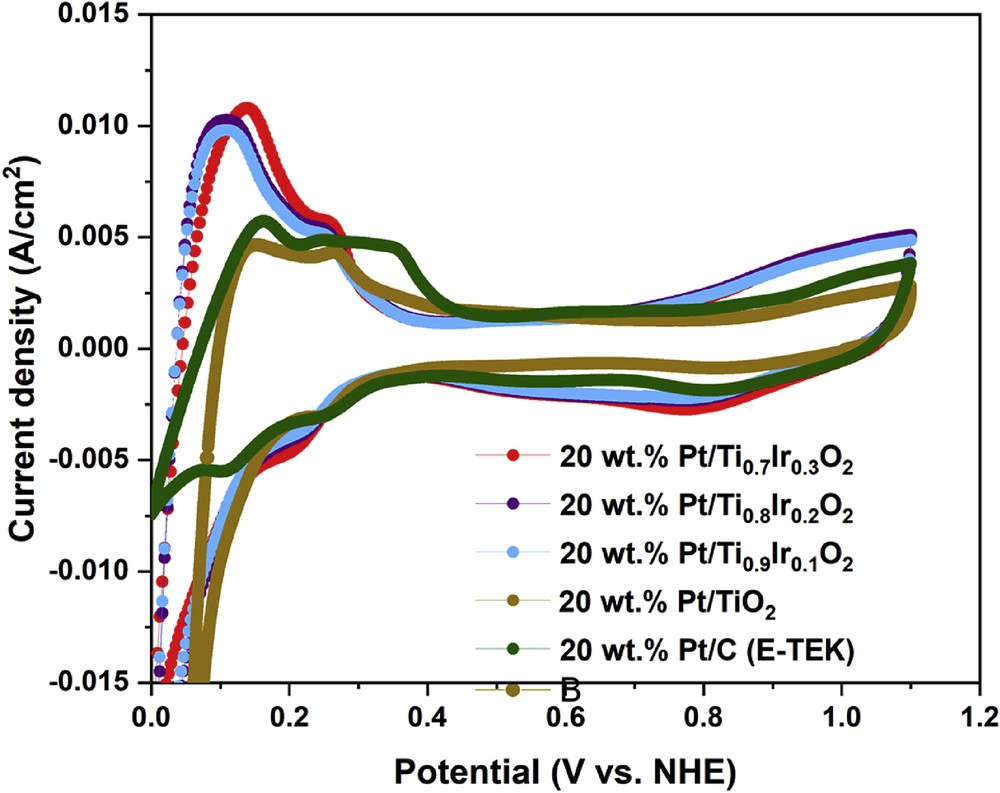
Cyclic voltammograms of the 20 wt. % Pt/Ti0.7Ir0.3O2, 20 wt. % Pt/Ti0.8Ir0.2O2, 20 wt. % Pt/Ti0.9Ir0.1O2, 20 wt. % Pt/TiO2 catalysts, and the commercial 20 wt. % Pt/C (E-TEK) catalyst in N2-saturated 0.5 M H2SO4 solution at a scan rate of 50 mV/s.
Cyclic voltammetric curves in the N2-saturated 10 vol. % CH3OH in 0.5 M H2SO4 electrolyte could be used to characterize the electrocatalytic properties of 20 wt. % Pt/Ti1-xIrxO2 catalysts for methanol oxidation as illustrated in Fig. 10. The efficiencies for methanol oxidation of the 20 wt. % Pt/Ti1-xIrxO2 catalysts were compared with the 20 wt. % Pt/TiO2 catalyst and the commercial 20 wt. % Pt/C (E-TEK) catalyst in terms of onset potential, forward current density (If), and the fraction of the forward current density to the backward current density (Ib). These data are summarized in Table 2. The higher current density and the much smaller onset potential of the 20 wt. % Pt/Ti1-xIrxO2 catalysts (∼21–31 mA/cm2, 0.05 V) than the 20 wt. % Pt/TiO2 catalyst (12.34 mA/cm2, 0.45 V) and the commercial 20 wt. % Pt/C (E-TEK) catalyst (14.42 mA/cm2, 0.50 V) could illustrate the superior activity of 20 wt. % Pt/Ti1-xIrxO2 catalysts, which could be interpreted on the modified electronic structure of Pt because of the electron transfer from Ti1-xIrxO2 supports to Pt [20], as shown in Table 2. Among the different 20 wt. % Pt/Ti1-xIrxO2 catalysts, the 20 wt. % Pt/Ti0.9Ir0.1O2 catalyst showed the highest forward current density (30.48 mA/cm2) despite the lowest Ir composition in the support followed by the 20 wt. % Pt/Ti0.8Ir0.2O2 catalyst (26.50 mA/cm2) and the 20 wt. % Pt/Ti0.7Ir0.3O2 catalyst (21.39 mA/cm2). It is clear that the more the addition of Ir amounts into the supports, the lower the catalytic activity toward the MOR of 20 wt. % Pt/Ti1-xIrxO2 catalysts. Among the 20 wt. % Pt/Ti1-xIrxO2 catalysts, this depletion in the catalytic activity behavior might suffer from (1) the smaller specific surface areas of supports restraining the high distribution of Pt catalysts while increasing the Ir composition and (2) the exceeding richness of Ir in Ti1-xIrxO2 supports totally modifying the nature of the TiO2 material [39].
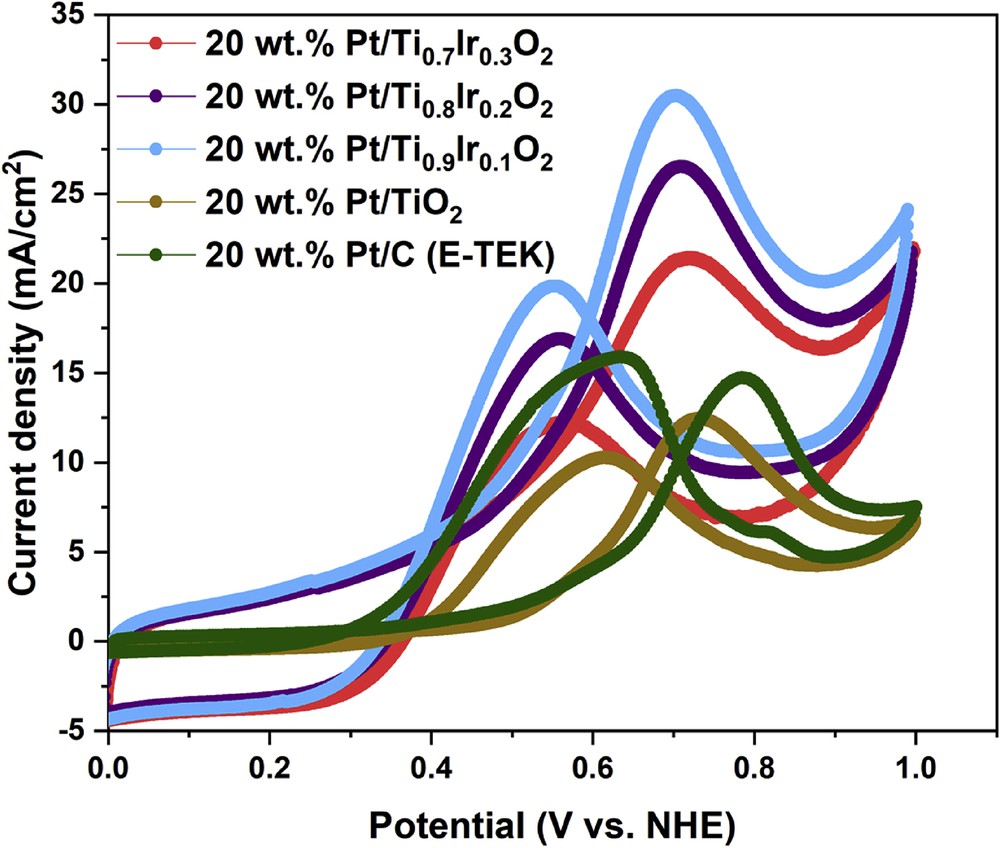
Cyclic voltammograms of the 20 wt. % Pt/Ti0.7Ir0.3O2, 20 wt. % Pt/Ti0.8Ir0.2O2, 20 wt. % Pt/Ti0.9Ir0.1O2, 20 wt. % Pt/TiO2 catalysts, and the commercial 20 wt. % Pt/C (E-TEK) catalyst in N2-saturated 10 vol. % CH3OH in 0.5 M H2SO4 electrolyte at a scan rate of 50 mV/s.
The comparison in electrochemical parameters of 20 wt. % Pt/Ti0.7Ir0.3O2, 20 wt. % Pt/Ti0.8Ir0.2O2, 20 wt. % Pt/Ti0.9Ir0.1O2, 20 wt. % Pt/TiO2, and 20 wt. % Pt/C (E-TEK) catalysts.
| Catalysts | ECSA (m2/g Pt) | Methanol electro-oxidation | ||
| Onset potential (V) | If/Ib | Forward current density (If) (mA/cm2) | ||
| 20 wt. % Pt/Ti0.7Ir0.3O2 | 89.75 | 0.05 | 1.75 | 21.39 |
| 20 wt. % Pt/Ti0.8Ir0.2O2 | 86.51 | 0.05 | 1.57 | 26.50 |
| 20 wt. % Pt/Ti0.9Ir0.1O2 | 85.12 | 0.05 | 1.54 | 30.48 |
| 20 wt. % Pt/TiO2 | 48.36 | 0.45 | 1.21 | 12.34 |
| 20 wt. % Pt/C (E-TEK) | 61.39 | 0.50 | 0.90 | 14.42 |
In addition, If/Ib ratios, the representative value of CO tolerance [40], were found to be 1.75, 1.57, and 1.54, corresponding to 20 wt. % Pt/Ti0.7Ir0.3O2, 20 wt. % Pt/Ti0.8Ir0.2O2, and 20 wt. % Pt/Ti0.9Ir0.1O2 catalysts, respectively, exhibiting their better tolerance to poisoning intermediates than the 20 wt. % Pt/TiO2 catalyst (1.21) and the commercial 20 wt. % Pt/C (E-TEK) catalyst (0.90). Particularly, the highest If/Ib ratio (1.75) could be observed for the 20 wt. % Pt/Ti0.7Ir0.3O2 catalyst, suggesting that it could best facilitate the oxidation of methanol to CO2 and create a fewer CO-like intermediates accumulating on the catalyst surface during the forward potential scanning process. The improvement in the CO tolerance of 20 wt. % Pt/Ti1-xIrxO2 catalysts as compared with the 20 wt. % Pt/TiO2 catalyst and the commercial 20 wt. % Pt/C (E-TEK) catalyst could be explained as follows: (1) the presence of Ir in supports could lessen bonding between Pt NPs and CO-like intermediates, thus limiting the poisoning effect of by-products of methanol oxidation [41] and (2) Ti1-xIrxO2 supports could facilitate the water dissolution, thus generating hydroxyl groups to oxidize CO-like intermediates adsorbed on the surface of the Pt catalyst by the bifunctional mechanism [25,42,43], which could not be performed on Pt/C catalysts. As a result, it could be suggested that the superior activity and CO tolerance of the 20 wt. % Pt/Ti1-xIrxO2 catalysts to the commercial 20 wt. % Pt/C (E-TEK) catalyst seem to be well correlated with the more improved durability of Ti1-xIrxO2 supports as compared with eroded carbon supports. Finally, it could be concluded that the catalytic oxidation of methanol proceeds more efficiently on 20 wt. % Pt/Ti1-xIrxO2 catalysts because of the easier removal of CO on Pt NPs.
The CA responses of 20 wt. % Pt/Ti1-xIrxO2 catalysts, 20 wt. % Pt/TiO2 catalyst, and commercial 20 wt. % Pt/C (E-TEK) catalyst (Fig. 11) were recorded in 10 vol. % CH3OH in 0.5 M H2SO4 electrolyte at a fixed potential of 0.70 V versus NHE within a time period of 60 min to evaluate their stability in harsh methanol environment. As deduced from Fig. 11, the initial current density of 20 wt. % Pt/Ti1-xIrxO2 catalysts were observed to be around 40 mA/cm2, which is much higher than that of the 20 wt. % Pt/TiO2 catalyst (28.37 mA/cm2). This improved current density could be attributed to the increase in the electrical conductivity of Ti1-xIrxO2 supports as compared with undoped TiO2 and the charge transfer from Ti1-xIrxO2 supports to Pt in the presence of Ir [19]. In addition, after the durability test for 1 h, 20 wt. % Pt/Ti0.7Ir0.3O2, 20 wt. % Pt/Ti0.8Ir0.2O2, and 20 wt. % Pt/Ti0.9Ir0.1O2 catalysts also showed the higher percentage of remaining current density (55.37%, 34.37%, and 17.57%, respectively) than that of the 20 wt. % Pt/TiO2 catalyst (14.29%) and the commercial 20 wt. % Pt/C (E-TEK) catalyst (7.66%), indicating a significant improvement in the MOR stability of these electrocatalysts. The enhanced durability of 20 wt. % Pt/Ti1-xIrxO2 catalysts as compared with the 20 wt. % Pt/TiO2 catalyst could be derived from the bifunctional effect [9] in which the selectivity of MOR toward CO2 is improved thanks to the easier oxidation of poisoning species by OH species created on Pt/Ti1-xIrxO2 catalysts [33,43]. Particularly, the 20 wt. % Pt/Ti0.7Ir0.3O2 catalyst showed the lowest degradation rate, indicating the most improved stability toward methanol oxidation under harsh operating conditions of DMFCs. Evidently, the commercial 20 wt. % Pt/C (E-TEK) catalyst exhibits the aggressive decay, particularly at the early stage, and retains the least current density at the end, which results from the strong adsorption of poisonous intermediates on the Pt surface. Finally, it can be concluded that the higher stability of 20 wt. % Pt/Ti1-xIrxO2 catalysts than that of the commercial 20 wt. % Pt/C (E-TEK) catalyst is attributed to the strong metal-support interaction between Pt catalysts and TiO2-based supports [9,21], which facilitated the strong Pt attachment to the supports and the superior durability of Ti1-xIrxO2 supports to eroded carbon supports.
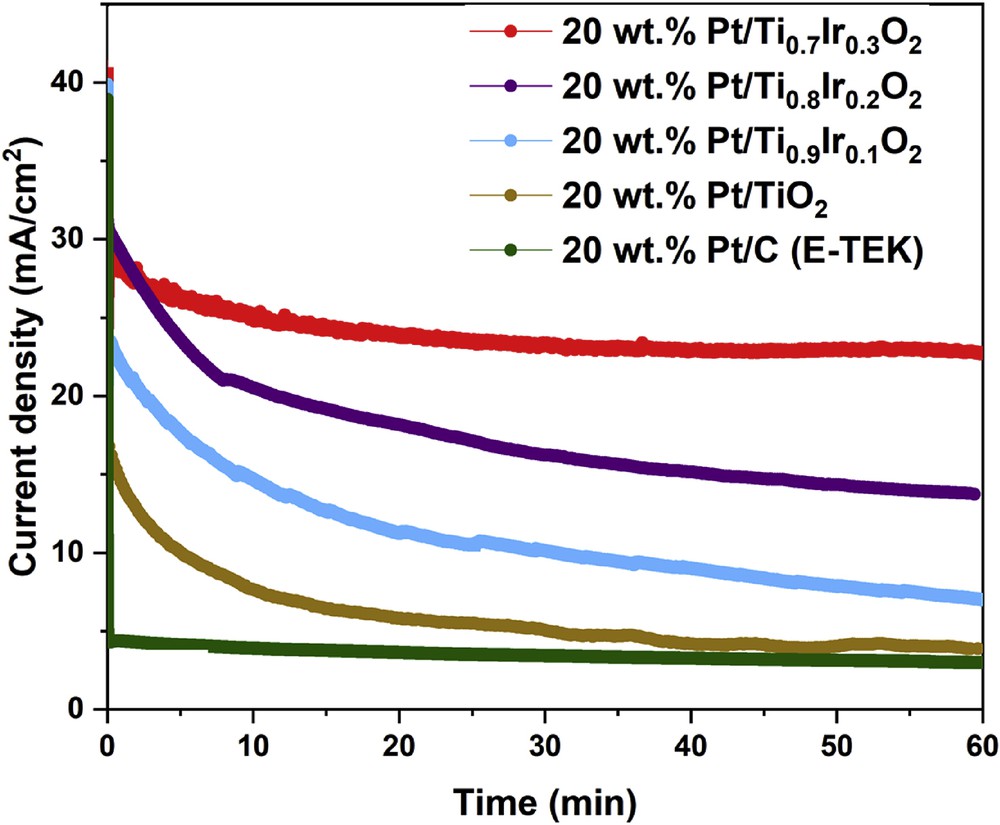
Chronoamperometric responses of the MOR recorded on the 20 wt. % Pt/Ti0.7Ir0.3O2, 20 wt. % Pt/Ti0.8Ir0.2O2, 20 wt. % Pt/Ti0.9Ir0.1O2, 20 wt. % Pt/TiO2 catalysts, and the commercial 20 wt. % Pt/C (E-TEK) catalyst in N2-saturated 10 vol. % CH3OH in 0.5 M H2SO4 electrolyte at a fixed potential of 0.70 V versus NHE in 60 min. NHE, normal hydrogen electrode.
4 Conclusion
In summary, doping Ir into TiO2 structure by the facile hydrothermal method without using any surfactants or further heat treatment could significantly enhance the electric conductivity and moderately enhance the specific surface areas of Ti1-xIrxO2 materials as compared with the undoped TiO2 material. Moreover, among Ti1-xIrxO2 samples, the electrical conductivities linearly increase with the higher Ir content, whereas their surface areas exhibit reverse trends. Nanosized Pt particles with a diameter of around 3 nm can be effectively deposited on Ti1-xIrxO2 supports by using a strong reduction method with NaBH4. The ECSA values of the 20 wt. % Pt/Ti1-xIrxO2 catalysts insignificantly increase with an increase in the Ir dopant, but all of them are higher than the value of the commercial 20 wt. % Pt/C (E-TEK) catalyst, which might be attributed to the ‘hydrogen spillover’ phenomenon taking place on TiO2-based materials that supported the Pt catalysts. The CV curves of MOR clearly show that the 20 wt. % Pt/Ti1-xIrxO2 catalysts display multifold smaller onset potential (0.05 V) and approximately double higher forward current density (in the range of 21–31 mA/cm2) than the 20 wt. % Pt/C (E-TEK) catalyst (0.50 V, 14.42 mA/cm2), suggesting the better catalytic activity of Pt/Ti1-xIrxO2 catalysts than their counterpart because of the electronic modification of Pt on Ti1-xIrxO2 supports. More interestingly, the If/Ib ratios of these catalysts are approximately double to those of the commercial 20 wt. % Pt/C (E-TEK) catalyst, indicating their greater tolerance to CO-like intermediates accumulated on the Pt catalyst based on the bifunctional mechanism. CA results also exhibit the superior stability of the 20 wt. % Pt/Ti1-xIrxO2 catalysts to the commercial 20 wt. % Pt/C (E-TEK) catalyst, which might be interpreted on the much improved durability of Ti1-xIrxO2 supports as compared with eroded carbonaceous supports and the strong interaction between nanosized Pt catalysts and titania-based supports. For as-obtained Pt/Ti1-xIrxO2 electrocatalysts, the as-obtained Pt/Ti0.9Ir0.1O2 catalyst exhibits the highest electrocatalytic activity while the as-obtained Pt/Ti0.7Ir0.3O2 catalyst exhibits the highest electrocatalytic stability and poisoning resistance to intermediate carbonaceous species in methanol acidic media. Particularly, the 20 wt. % Pt/Ti0.9Ir0.1O2 catalyst still exhibits the much enhanced catalytic activity, poisoning tolerance, and stability for MOR despite lowest Ir composition than that of the commercial 20 wt. % Pt/C (E-TEK) catalyst. Thus, reducing the Pt loading on the Ti0.9Ir0.1O2 support could be considered as a promising research approach in the future to decrease the cost of the Pt/Ti0.9Ir0.1O2 catalyst, but it still provides a comparable electrochemical activity and better stability than the commercial 20 wt. % Pt/C (E-TEK) catalyst.
Acknowledgements
This research is funded by Ho Chi Minh City University of Technology, VNU-HCM, under grant number BK-DH–2019–1514019. This study was supported by Dr. Son Truong Nguyen, Viet Nam National University–Ho Chi Minh City University of Technology (VNU-HCMUT) and the Applied Physical Chemistry Laboratory, Viet Nam National University–Ho Chi Minh City University of Science (VNU-HCMUS).