

1 Introduction
Nitrate contamination of natural water becomes very alarming because of its harmful effects on human health. The main sources of nitrate water contamination are industrial wastewater oil fields, sanitary sewers, irrigation, urban runoff and atmospheric gases dissolved in surface water [1].
The primary health risks associated with elevated nitrate levels are methemoglobinemia, which causes the “blue baby syndrome” in infants [2]. The higher pH of their upper respiratory tract accelerates the conversion of nitrate to nitrite. The nitrite oxidizes the infant's hemoglobin to methemoglobin, which is unable to carry oxygen in the bloodstream. Some of the by-reactions of nitrate resulted in the formation of nitrosamines and nitrosamides compounds that are strongly considered as potentially carcinogenic [3].
The maximum admissible concentration for nitrate in drinking water has been set to a level of 10 mg/L as nitrogen (44.3 mg/L as nitrate) in the USA and Canada and at 50 mg/L as nitrate by the World Health Organization and the European Community [4].
Treatment of nitrate is, therefore, very complicated and expensive. The main treatment technologies to reduce nitrate concentration include biological denitrification using the addition of methanol or ethanol [5,6], electrodialysis or reverse electrodialysis [7,8], membrane [9,10] or reverse osmosis [11], catalytic and photocatalytic reactions [12], and ion exchange processes using strong base anion resins [13,14].
Purolite A-520E is a macroporous strong base anionic resin. The polymer matrix structure is a styrene-divinylbenzene type and the functional group is represented by quaternary ammonium salts, with three ethyl groups. These resins are more selective for nitrate ions and retain nitrate more strongly than any other ions including sulfates [15].
In this study, the ion exchange process of nitrate and sulfate ions was investigated, individually and as a mixture with Purolite A-520E anion exchange resin, as a function of pH and initial anions concentration. The experimental data were analyzed using the Langmuir and Freundlich model for equilibrium conditions.
2 Experimental
2.1 Equilibrium sorption
2.1.1 Sorption isotherms
The experiments were carried out under controlled pH by using an initial homoionic synthetic aqueous solution. Purolite A-520E anion exchange resin was used for all equilibrium experiments. Fifty milligrams of the polymer were kept in contact for 48 h (until equilibrium was attained) with 50 mL of aqueous solutions of KNO3 and K2SO4 (the solid/liquid ratio was 1 g/L) with the NO32− and SO42− concentrations ranging from 1 to 25 mequiv/L. The pH of the solutions was maintained at about 5.53 ± 0.02 using buffer solutions (Titrisol, Merck) and monitored by a pH electrode connected to a portable Jenway 370 pH-meter. Vigorous stirring of the solid and liquid phases was ensured by a rotating magnetic stirrer (400 rpm). The working temperature was 20.0 ± 0.5 °C. The liquid phase was analyzed with a SOLAAR 32 UV–Vis absorption spectrophotometer.
The amount a of nitrate and sulfate ions retained at equilibrium was calculated from the mass balance equation [16]:
| (1) |
The nitrate and sulfate sorption data were analyzed using Langmuir and Freudlich equations [17–19].
2.1.2 Effect of pH on NO3− and SO42− exchange
The experiments were carried out under controlled pH by using a two-component synthetic aqueous solution having the concentration of 1.14 mequiv/L nitrate and 1.75 mequiv/L sulfate ions. The pH of the solutions varied from 3.96 ± 0.2 to 8.2 ± 0.2. The limits of the pH values were selected in accordance with the anion exchange resins product. The pH was maintained at the desired value using appropriate buffer solutions. The solid/liquid ratio (X) was 1 g/L. The experimental data concerning the influence of pH on the removal of nitrate and sulfate from the resin are presented in Fig. 1.
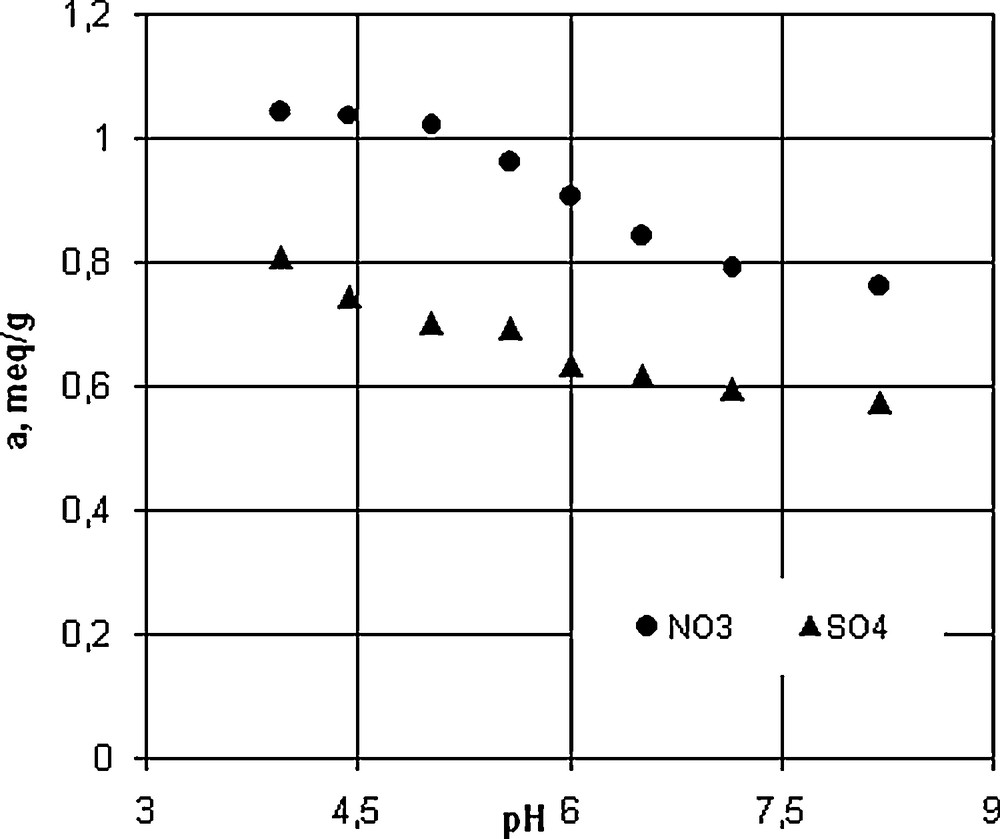
Effect of pH on removal nitrate and sulfate on Purolite A-520E resin.
2.2 A-520 E surface processes
The ion exchange resin used for IR, SEM-EDX and AFM experiments was obtained before and after contact with solutions containing NO3−, SO42− individually and in mixtures. The concentrations in the initial aqueous solution were 1.14 mequiv/L nitrate and 1.75 mequiv/L sulfate ions, the solid/liquid ratio (X) was 1 g/L and the pH of the solutions was about 5.53 ± 0.02.
2.2.1 IR spectroscopy
IR spectra were obtained from the solid phase, using a PerkinElmer Spectrum 100 spectrometer with ATR (Diamond Head), between 4000 and 600 cm−1 (Fig. 2).
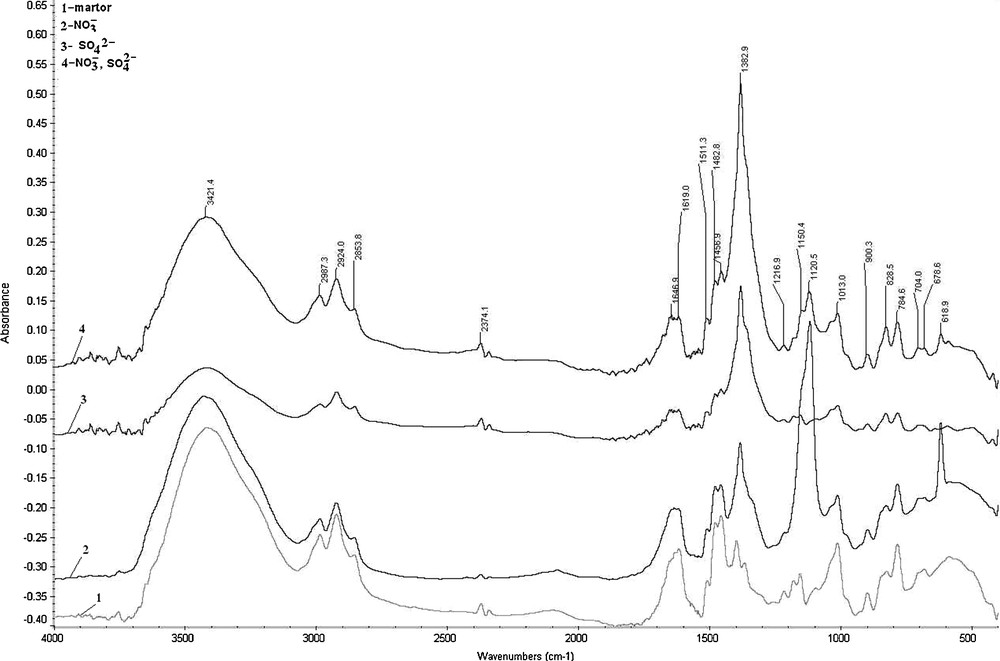
IR spectrum of ion exchange resins: 1: spectrum of initial resin, for comparison; 2: resin contacted with NO3− ions; 3: resin contacted with SO42− ions; 4: resin contacted with a mixture (1:1) of SO42− and NO3− ions.
2.2.2 Scanning electron microscopy analysis
Scanning electron microscopy images (SEM) were obtained using a Quanta Inspect F microscope from FEI company with field emission gun (FEG) and a 1.2-nm resolution, equipped with an energy-dispersive X-ray spectrometer (EDX) with an energy resolution of 133 eV (Mn Kα). Images were collected with a beam potential of 5 kV and a magnification of ×100 000. The results obtained from EDX and SEM analysis are presented in Figs. 3 and 4.
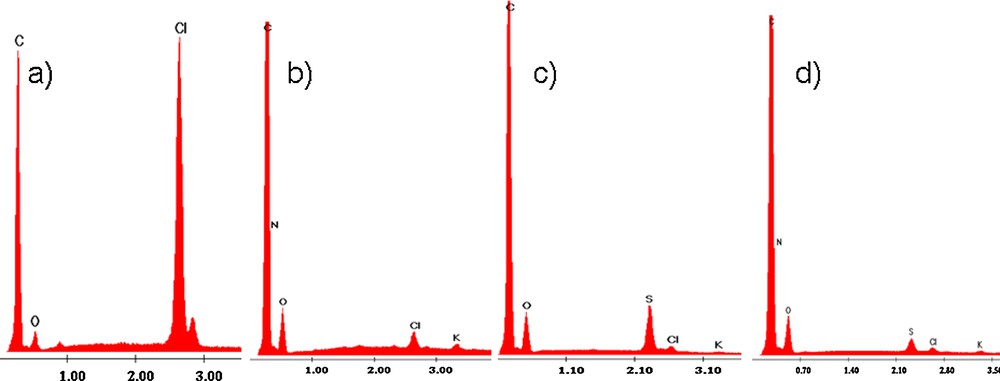
EDX analysis for A-520 E contacted with chloride, nitrate and sulfate salts: a) initial, b) after contact with nitrate, c) after contact with sulfate, d) after contact with both salts.
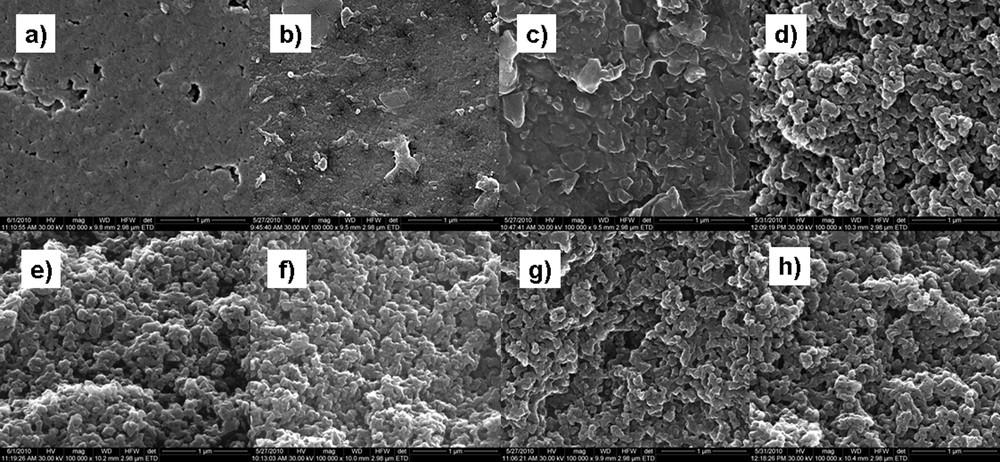
SEM analysis for A-520E resin grains on the surface and in a fracture initially and after contact with solutions that contain nitrate, sulfate, and both of them: a) initial surface, b) NO3− on surface, c) SO42– on surface, d) NO3− and SO42− on surface, e) initial in fracture, f) NO3– in fracture g) SO42− in fracture, h) NO3− and SO42− in fracture.
2.2.3 Atomic Force Microscopy analysis
To investigate the tendency of aggregation of NO3− and SO42− ions individually and in a mixture, an AFM set-up has been used [20,21].
AFM experiments were performed using Agilent Technologies 5500 Scanning Probe Microscope (Agilent Technologies, Inc., Santa Clara, CA) in air at room temperature with a 10-um multipurpose scanner. Images were acquired in contact mode at scan rates from 0.7 to 1 line/s, the images being recorded with 512 × 512 pixels resolution. PicoView 1.6, from Agilent Technologies, Chandler AZ, was used as imaging and analysis software. Topography image data obtained by AFM are three-dimensional, making it possible to estimate both lateral (xy) and height (z) measurements. The usual method for displaying data is by using a color mapping for height, for example black for low features and white for high features. The images were processed by first-order flattening in order to remove the background slope, and the contrast and brightness were adjusted.
The sample solutions for AFM imaging were freshly prepared before each experiment by suspending the appropriate quantity of each sample in absolute ethanol purchased from Sigma-Aldrich and by placing 100 μL of the obtained suspension on a clean glass substrate. In order to improve the stability of the particles onto the microscope slide surface, all samples have been dried before being observed by AFM.
The obtained images for ethanolic suspensions of A-520E – resin alone as well as resin in contact with nitrate and sulfate – are presented in Figs. 5 and 6.
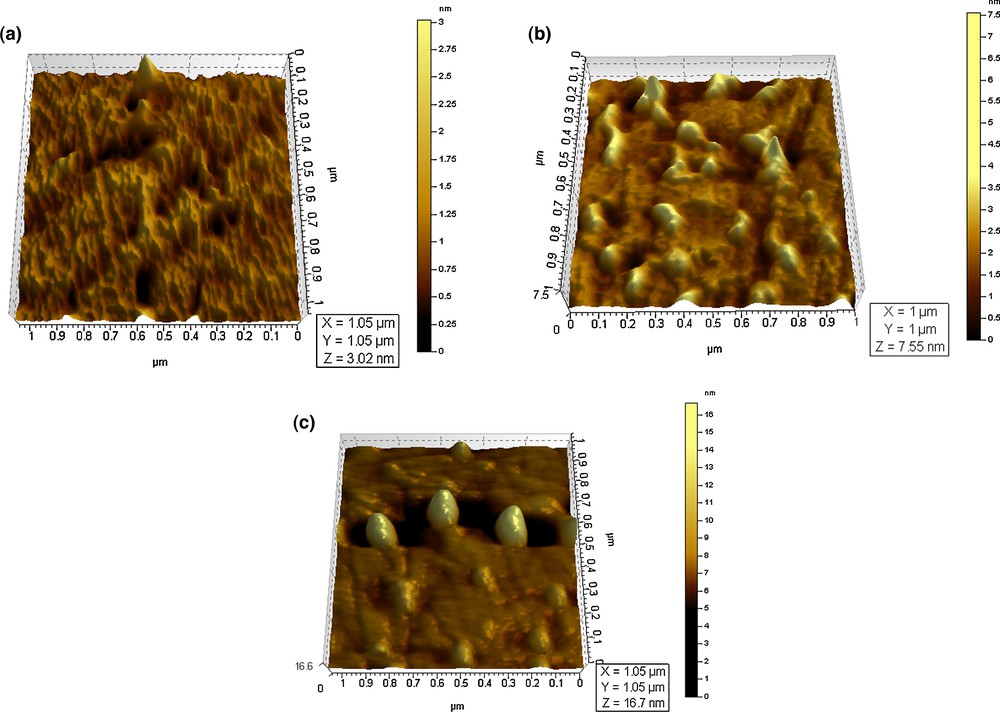
AFM topographical images of salts aggregates formed from ethanolic suspension: a) initial – chloride, b) nitrate, c) sulfate.
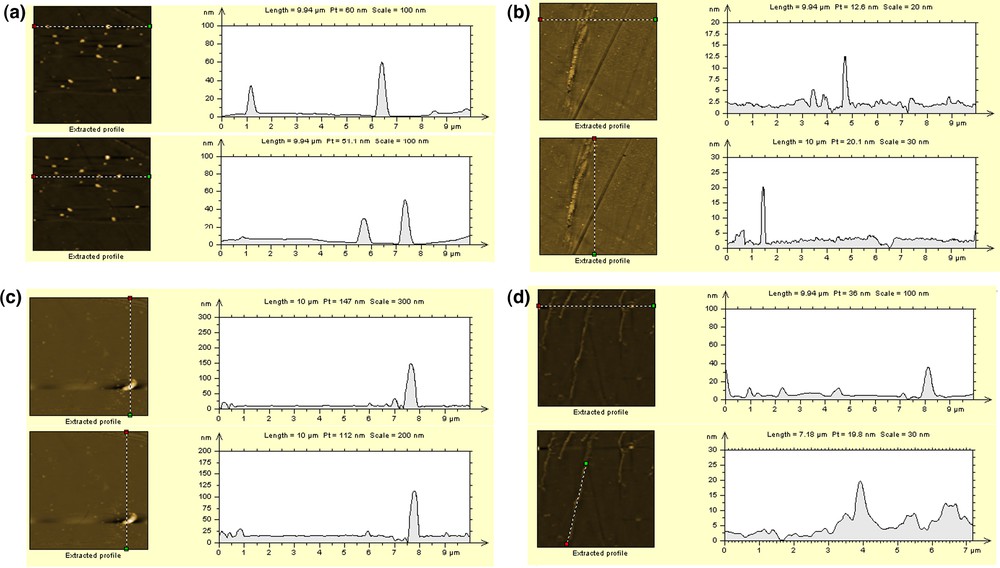
AFM topography in 2D for a scan area (1 × 1um) and accompanying line profile for salts: a) initial – chloride, b) nitrate, c) sulfate, d) nitrate and sulfate.
3 Results and discussions
3.1 Equilibrium sorption
3.1.1 Sorption isotherm
A comparison of the adsorption isotherms for nitrate and sulfate ions on Purolite A-520E anion exchange resin in the same initial conditions, but at variable initial contact concentrations, revealed an increase of the adsorption capacity with an increase of the initial anions’ concentration (Fig. 7). The resin has a higher uptake capacity for nitrate than for sulfate. The maximum amounts of anions that adsorb onto the resin varied in the descending order: NO3− > SO42−, 2.1 mequiv NO3−/g and 0.9 mequiv SO42−/g.
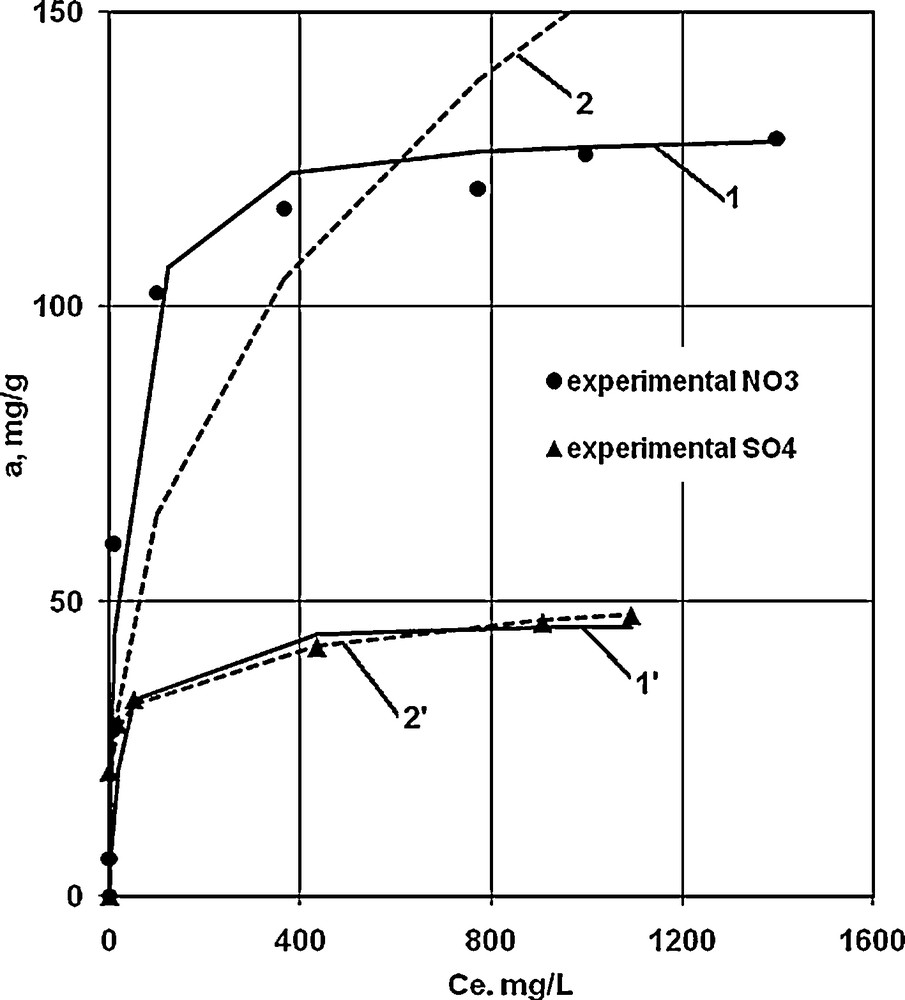
Nitrate and sulfate adsorption isotherms on Purolite A-520E resin. 1, 1’: theoretical curves obtained from Langmuir's model for nitrate and sulfate respectively; 2, 2’: theoretical curves obtained from Freundlich's model for nitrate and sulfate respectively. Experimental points were also shown.
The sorption data of both anions were analyzed using Langmuir and Freudlich equations.
The characteristic equation of Langmuir isotherm is:
| (2) |
The linearized form of Langmuir equation is, after rearrangement of the terms:
| (3) |
Based on this linear dependence, the constant b and the maximal sorption capacity am can be easily determined in order to estimate the degree of fitting of this model.
In a similar manner, the characteristic equation of the Freudlich isotherm is:
| (4) |
| (5) |
Langmuir and Freudlich sorption parameters of resins for each one of the two anions were calculated by using least-square fitting. The values of parameters and the correlation coefficients are shown in Table 1.
Calculated equilibrium parameters for fitting Langmuir and Freudlich equations.
| Anion | Isotherm type Langmuir | Isotherm type Freudlich | ||||
| am | b | R2 | K | n | R2 | |
| NO3− | 129.87 | 0.04646 | 0.9983 | 11.8059 | 1.27 | 0.9154 |
| SO42− | 46.51 | 0.04893 | 0.9535 | 19.7 | 1.19 | 0.9951 |
The results revealed that the experimental data fitted the Langmuir equation for nitrate anions with a square regression coefficient (R2) equal to 0.9983. We can therefore assume that the nitrate anion exchange respects the Langmuir model. Experimental data also fitted the Freudlich equation for the sulfate anion with a regression coefficient that has the value 0.9951 on Purolite A-520E, and it can therefore be assumed that sulfate anion exchange obeys the Freudlich model.
3.1.2 Effect of pH on anions sorption
Nitrate and sulfate removal from aqueous solution depends on the pH value (Fig. 1).
An increase in the pH value in the range of 3.9 and 8.2 resulted in a decrease of the sorption capacity of the resin. The pH sorption media is related to the anion ion exchange mechanism onto Purolite A-520E. The ionic species that participate to the ion exchange process are nitrate sulfate and hydroxyl anions in aqueous system, and chloride anions in solid phase, respectively. The processes involve the exchange of chloride anion from resin with nitrate, sulfate or hydroxyl anion, respectively from aqueous solution. At low pH values, the concentration of hydroxyl anion is low and both nitrate and sulfate ions are adsorbed in larger amounts. When the pH value increases, the amount of hydroxyl ions increases and a larger number of active centers are occupied.
3.2 A-520 E surface processes
3.2.1 IR spectrum
The recorded IR spectrum is highly complex, reflecting the nature of both ions inside the anion exchange resin. Despite this complexity, some characteristic peaks can be assigned. The spectrum FTIR presents the characteristic peaks for the copolymer styrene–divinylbenzene [22] and other peaks characteristic of ethyl quaternary ammonium salts [23].
Fig. 2 presents the IR spectrum before and after contact with individual and mixed solutions that contained NO3− and SO42− species, respectively.
The IR spectrum clearly indicates the changes in the presence of sulfate groups where the vibration intensities for more groups accordingly decrease, except the one at 1382.9 cm−1 that increases significantly, despite the complexity of the IR spectra.
The spectrum further clearly indicates the presence of nitrate, with a slight decrease in the intensity of characteristic resin vibrations, except those that characterized the aromatic ring deformation in the α-(C–C–C) plane at 618.9 cm−1 and the C–H vibration in double (bi) substituted aromatic ring in positions 1,2; 1,3; 1,4 at 1120,5 cm−1 [24,25].
3.2.2 SEM and EDX analysis
Analyzing the EDX data, one can see that the initial matrix of the resin contains the following elements: carbon, nitrogen, oxygen, and chloride. Potassium and sulfur were introduced into structures after contact with solutions; they originate from the dissolved salt used in the experiments. We notice that the intensity of the Cl− peaks decreases largely by contact of the resin with solutions containing nitrate and sulfate that were now retained in the resin. Also, the characteristic nitrogen peak is much higher than that corresponding to sulfur, which proves that nitrogen is retained in a larger quantity. Fig. 3 presents the EDX spectrum for A-520E ion exchange resin before and after sorption experiments.
We can also see from our SEM analyses that the initial surface of ion exchange grains presents a uniform and compact structure (Fig. 4a). The surface of the grains is changing after contact with solutions that contain nitrate and/or sulfate anions, as evidenced by morphological features (Fig. 4b–d). The swelling of particles and the creation of channels inside the grain are due to the physical and chemical processes that are occurring in the resin. When one looks at the grains in the fracture initially and after contact with solutions that contain nitrate, sulfate as well as a mixture of both (Fig. 4e–h), the texture and morphology are uniform, and significant changes can be seen, depending on ion types and on individual ways of forming aggregates.
3.2.3 AFM analysis
High-resolution imaging using AFM has been applied to observe the differences between the height of the aggregates formed after immersion in the ethanol solution for the untreated ion exchanger and the height of the aggregates formed after the ion exchanger has been treated with solutions containing nitrate and sulfate. Fig. 5a–c presents the AFM images in 3D mode and a scan area of 1 × 1 um for the ethanol suspension of ion exchange resin A-520E, initially, before and after resin contact with solutions that contained nitrate and sulfate, respectively, while Fig. 6a–d represents the extracted profile from AFM topographical images.
The topography of the surfaces was investigated by AFM in contact mode in a range of scan lengths from 100 um to 1 um.
Using atomic force microscopy, it could be observed that the height of the aggregates formed by chloride salts onto the resin surface ranges between 3 and 17 nm (Fig. 5a).
The 3D topographical image for the aggregates formed from the ethanolic suspension of the untreated ion exchanger shows a relatively uniform distribution of the chloride salts onto surface with a z value of about 3 nm for an area of 1 um distance around. The extracted profile for the topographical image of an area of 10 um presents a uniform distribution of the aggregates onto the surface and a height of the aggregates between 40 and 60 nm (Fig. 6a).
Fig. 5b shows the 3D image for nitrate salts formed onto the glass surface. It can be seen that, in this case, the shape of the aggregates formed by nitrate salts is chain-like, instead of pyramidal for chloride salts. The z value is in the 12–15-nm range for an area of 10 um. It can be seen from all images that the shape of aggregates with nitrate salts is very different from what was obtained for other samples onto the same surface. From the extracted profile (Fig. 6b) for the topographical image, the height of the aggregates has a value of about 12 to 15 um, which is higher than the reference one and suggests a tendency to form aggregates; the presence of the nitrate salts onto the glass surface, as well as on the polymer surface, is obvious.
Fig. 5c shows the 3D image of the sulfate salts aggregates, where it can be seen that the z value is about 7.6 nm for an area of 1 um. The extracted profile for the same sample and on an area of 10 um presents a height of the aggregates between 125 and 150 nm (Fig. 6c).
By comparing with chloride salts, the images for sulfate salts show a different shape of the aggregates, thus indicating that the entrapping of the sulfate salts into the polymeric matrix changes the shape and size of the sample from a pyramidal shape with a sharp tip corresponding to chloride salts to a pear-shape for sulfate salts.
In order to see the possible selectivity of the ions onto the polymer surface, the topographical images of the salts mixture were investigated, in the same conditions as those for the individual salt type. Fig. 6d shows the extracted profile image for the nitrate and sulfate salts mixture, where one can see the presence of aggregates with the same shape as that for nitrate salts in Fig. 6b. In this case, the height of the salts aggregates is in the 10–40-nm range for an area of 10 um, probably due to the superposition of two nitrate chains in areas where the height is almost 40 nm. It can also be observed, from both images, that the shape features of aggregates containing both nitrate and sulfate salts are not different from those obtained for individually salts, as shown previously. From the extracted profile (Fig. 6d), the height of the aggregates has a value from about 0.4 to 1 um, which is close to the reference one. The presented data show that the presence of sulfate salts into the nitrate and sulfate salts mixture does not modify the shape and the size of the aggregates.
The AFM measurements reveal important data regarding morphological images, such as shape and size of the salts aggregates, formed by different ions types.
The interface process is influenced by the ions salts’ characteristics, their ionic radius and their electrical charge. The ionic radius of the studied anions varies from: 1.81 Å for Cl− [26] to 1.97 Å for NO3− [27], and to 2.3 Å for SO42− [28].
4 Conclusions
Purolite A-520E represents a strong basic macro porous resin; the matrix is a cross-linked polystyrene type which is functionalized with triethyl amine exchange sites. These resins are more selective for nitrate ions, retaining nitrate more strongly than any other ions including sulfates. The sorption capacity of nitrate ions on Purolite A-520E is larger than that of sulfate ions. Equilibrium data are fitted very well with the Langmuir isotherm for nitrate ions and with the Freudlich isotherm for sulfate ions. The maximal sorption capacity on Purolite A-520E was determined as 2.1 mequiv NO3−/g and 0.9 mequiv SO42−/g, respectively. pH is one of the most important environmental factors that influence the equilibrium uptake. The increase of the pH value in the range from 3.9 to 8.2 determines the decrease of the sorption capacity from aqueous solution for nitrate and sulfate ions.
AFM analysis identified the changes that occur in forming aggregates depending on the ion type, after the ion exchanger was brought in contact with solutions containing nitrate and sulfate ions and ethanolic solutions have been analyzed. The data indicate that the presence of sulfate salts in both nitrate- and sulfate salt-containing mixtures does not modify the morphology of the surface. It can be concluded that the selectivity of the resin exchanger for salts/ions exists, and is obvious even in ethanolic suspension.
Therefore, polymer A-520E could be very well used for the removal of nitrate anions from aqueous solutions due to its high selectivity toward nitrate ions.
Acknowledgements
The authors gratefully thank PhD Eng. Simona Cornelia Balasoiu for AFM measurements.
Vous devez vous connecter pour continuer.
S'authentifier