

olive-stone-activated carbon prepared by chemical activation using phosphoric acid
ICP-AESinductively coupled plasma atomic emission spectrometry
FTIRFourier Transformed Infrared Spectroscopy
SEMscanning electron microscope
XDRX-ray diffraction
A, BRedlich–Peterson parameters (L/g) and (L/mol)β
qadsorption amount (mmol/g)
qbinaryadsorption uptake from a binary system (mmol/g)
qsingleadsorption uptake from a single solution (mmol/g)
kLexternal mass transfer coefficient (m/s)
hinitial adsorption rate (mmol/g·min)
KFFreundlich parameter (mmol/L)(L/g)(1/n)
nFreundlich constant
Cliquid phase concentration of metal ion concentration (mmol/L)
Ciintraparticle diffusion constant
KLLangmuir parameter (L/mmol)
k1pseudo-first-order rate constant (min−1)
k2pseudo-second order rate constant (g/mmol·s)
kidintraparticle diffusion constant rate
mmass of adsorbent (g)
msSips constant
Vvolume of metal ion solution (L)
Sextexternal surface area (m2/g)
Greek lettersβRedlich–Peterson constant
λradiation (Ǻ)
θscanning temperature (°C)
Subscriptseequilibrium
expexperimental value
calvalue calculated by the model
sSips model
maxmaximum adsorbed quantity
PZCpoint of zero charge
tat time t (min)
tottotal adsorbed
0initial
NMLnon-modified Langmuir
ELFextended Langmuir–Freundlich model
imetal species
1 Introduction
Heavy metals are the most common pollutants present in industrial effluents. Their discharge into the environment causes serious environmental problems. Among the hazardous heavy metals, lead, cadmium and copper have received much attention due to their harmful, carcinogenic, non-biodegradable, and toxic effects at low concentrations. In drinking water, concentrations of 0.005 mg/L for Pb(II), 0.001 mg/L for Cd(II) and 0.1 mg/L for Cu(II) can cause illness in humans and can even be fatal [1]. Their hazardous risks are complicated by their accumulation character in the life cycle of the nutrient chain.
Many conventional processes, such as coagulation, filtration, ion exchanges, reverse osmosis, adsorption, are used to reduce the level of hazardous heavy metals in water effluents. Among these processes, adsorption on activated carbons (AC) is considered as one of the most practical and economical ways for water treatment [2]. The use of low-cost agriculture by-products as precursors for AC production supports the economic competitiveness of this adsorbent. It was shown that the porosity and the specific area are not the only determinant parameters in AC. In fact, surface chemistry is also a key parameter in the adsorption process of metal ions. The Copper (II) adsorption investigated on modified AC indicated that the quantity of adsorbed ions depends on the nature and quantity of surface acid-base functionalities and on the pH equilibrium in the aqueous solution [3]. Frequently activated carbon surfaces are modified by oxidation, acidic treatment, ammonization or heating to enhance metal species removal [4,5]. Adsorption of Pb2+ and Cd2+ ions on carbons obtained from date pits using different activation methods were investigated in both oxidized and non-oxidized carbons, at different solution pH [6]. The carbon with a higher oxidation degree shows the greatest capacity to remove Pb (II).
Some authors conclude that the dominant mechanism of lead adsorption on basic carbon samples is the formation of hydroxylcomplex and hydroxyoxide species with the participation of surface basic centres. For oxidized activated carbon samples, surface ionization and ion exchange mechanisms can describe cationic sorption from aqueous solutions [7]. Solution pH, initial concentration and adsorbent dose are found to be important operating parameters for Pb(II) adsorption from aqueous solutions on AC from coconut shell [8]. In the same work, the adsorption isotherm of Pb(II) onto coconut shell carbon (CSC) was found to follow Langmuir, Freundlich and Temkin isotherm models. The kinetics of adsorption of Pb(II) on CSC follows first-order reversible kinetics [8].
The main challenge in heavy metals’ removal is to be able to select the activated carbon with suitable properties. Two aspects must be considered: the thermodynamic equilibrium of adsorption at operating temperature and the dynamic process or kinetic rate of the adsorption. A lot of published works have addressed at the same time the thermodynamics and the kinetics of metals adsorption on AC from aqueous solutions, but most of them examined only single-cation adsorption systems.
Several metallic cations are often present in real systems on solid–liquid separation boundaries. These different adsorbates compete for adsorption sites characterized by maximum heat of adsorption and minimum free energy of adsorption. The adsorption of different metallic cations, which differ just by their size or their coupled anion, on a heterogeneous surface must occur on the same type of sites. In this case, the competition may become important and some complex mutual effect could be observed.
As in multicomponent adsorption from the gas-phase, various Langmuir models are often used to describe multicomponent adsorption equilibrium [9]. Studies of competitive adsorption hold great importance, since the selectivity of adsorbents, efficiency of concentrating and separating compounds, filtration, heterogeneous catalysis, biocompatibility of artificial biomaterials, and many other methods, effects, and phenomena depend in some way specifically on competitive adsorption on phase separation boundaries [3–8].
Olive stones, solid waste of the oleic industry, are available in important quantity in olive oil producing countries as Tunisia, where there are more than 60 million olive trees [10]. In order to valorize this waste byproduct generated during olive oil production, activated carbon (COSAC) was prepared by chemical processing using H3PO4 as an activating agent. The activated carbon produced is characterized by its high surface area, its developed micropores and heterogeneous surface functional groups [11,12].
The main objective of the present work is to investigate the potential valorization of olive in the adsorption process. This study will evaluate its uses after conversion to activated carbon, as adsorbent material for the removal of copper, cadmium and lead ions in single and binary aqueous solutions. The reversibility or irreversibility of the adsorption reaction is studied in order to qualify olive-stone activated carbon in term of regeneration.
2 Experiment
2.1 Materials
Stock solutions were prepared by dissolving a required amount of nitrate salt of each studied metal in double-distilled water. Copper nitrate (99.5%), cadmium nitrate (99%) and lead nitrate (99.5%) used in the current study were of analytical grade. After acidification with nitric acid, the concentrations of heavy metal ion samples before and after adsorption were determined using inductively coupled plasma–atomic emission spectrometer (ICP–AES; Activa-M, HORIBA Jobin Yvon). The detection limits of the analysis method were 0.5 μg/L for Cu(II), 0.15 μg/L for Cd(II) and 5 μg/L for Pb(II). The olive-stone-activated carbon was obtained by chemical activation using phosphoric acid as an activating agent according to the protocol optimized by Gharib and Ouederni [11]. Raw milled olive stones were impregnated with a phosphoric acid solution (50% by weight) at 110 °C for 9 h. After drying, the impregnated material was subjected to thermal activation at 380 °C for 2.5 h in a vertical tubular reactor fed by a stream of nitrogen and heated by an electric furnace. The activated carbon obtained, labeled as COSAC, was washed thoroughly with distilled water to eliminate impurities, dried at 60 °C for 24 h and then sieved to the desired particle sizes to be used for adsorption experiments.
2.2 Characterization of the adsorbent
The textural properties of COSAC were determined from the nitrogen adsorption isotherms recorded at 77.4 K using an automatic Sorptiometer Autosorb-1 C Quantachrome apparatus in the range of relative pressures from 10−5 to 1.0. The specific surface area and pore volumes were calculated by applying Brunauer–Emmett–Teller (BET) and DR methods, respectively. X-ray powder diffraction data (XRD) were obtained on A X’Pert Pro Panalytical diffractometer with Cu Kα radiation (λ = 1.5418 Ǻ) and graphite monochromator. Scanning was done between 0° < 2θ < 80°. The surface structure of COSAC was analyzed by SEM (Jeol JSM-6400).
The pH of the point of zero charge (pHpzc) was determined by the batch equilibrium technique [13]: 50 mL of a 0.01 M NaCl solution were placed in closed Erlenmeyer flasks. The pH was adjusted to a value between 2 and 12 by adding 0.1 M HCl or a 0.1 M NaOH solutions. After, 0.15 g of COSAC was added and the final pH was measured after 48 h under agitation at room temperature. The intersection of the curve [(pHfinal–pHinitial) vs. (pHinitial)] and the bisector gives the value pHpzc. Furthermore, surface functional groups were determined by Boehm titration [14]. The Boehm titration method can be described as follows: 1 g of COSAC was placed in five Erlenmeyer flasks containing 50 mL of 0.1 M of HCl, NaOH, NaHCO3, Na2CO3, and NaOC2H5 solutions, respectively. Then the mixtures were agitated for 48 h. The suspensions were filtered through a 0.45-μm membrane filter and the excess of base or acid was titrated with 0.1 M HCl or 0.1 M NaOH solutions, respectively. The amount of acidic groups on the activated carbon was calculated under the assumption that NaOC2H5 neutralizes carbonyl, carboxylic, lactones, and phenolic groups; NaOH, carboxylic, lactones, and phenolic groups; Na2CO3, carboxylic and lactones; NaHCO3, only carboxylic group. The number of surface basic sites is calculated from the amount of HCl that reacted with the carbon. In order to investigate the vibrational modes of functional groups of COSAC, its FTIR spectrum was measured in the range of 500–4000 cm−1 using a PerkinElmer spectrophotometer.
2.3 Adsorption experiments
Equilibrium experiments were conducted by batch mode in isothermal conditions at 30 ± 2 °C. To obtain the adsorption equilibrium isotherms, 0.3 g of COSAC samples, with an average particle size of 0.375 mm, were placed into 250-mL Erlenmeyer flasks containing 50 mL of metal ions solutions having different initial concentrations within the range of 0.5 to 5.0 mmol/L for Cu(II), Cd(II) and Pb(II) metal ions at optimum pH value. The flasks were being agitated during 10 h at 400 rpm. Then, the samples were filtrated through a 0.45-μm cellulose filter paper, and free metal concentrations in filtered solutions were analyzed.
The evaluation of the initial solution pH effect was undertaken with an initial metal ion concentration of 1.0 mM and an equilibrium time of 10 h. Initial pH solutions were adjusted within the range of 2.0 to 6.0 by adding some volume of 0.1 M NaOH or 0.1 M HNO3. The maximum tested pH value was fixed at 6 in order to avoid the precipitation of metal ions that can occur for higher pH values.
Experiments of binary adsorption isotherms were performed in the same conditions as for single metal adsorption isotherms. Initial copper concentration varied from 0.5 to 5.0 mmol/L, while the initial concentration of the interferential metal ions, Cd(II) or Pb(II), was fixed to 5.0 mmol/L.
The effect of the contact time was studied for an initial metal ion concentration of 2.0 mmol/L with a fixed adsorbent dose of 6.00 g COSAC/L in a batch mixed suspension with 500 mL of solution. The temperature of the suspension was maintained at 30 ± 2 °C by using a thermostatic bath. Two-milliliter samples of the solution were withdrawn at pre-set time intervals, then the free metal concentration was measured.
In order to qualify olive-stone-activated carbon in terms of regeneration, desorption tests were performed. The first step consists in separating, after adsorption, the particles of activated carbon from the metal cation solution by simple filtration then drying to the solid state. A given weight of used AC was filled in a fixed tubular bed fed by a constant flow rate of an aqueous acid solution of H2SO4 or HNO3.
Each experiment was carried out in duplicate and the average results are presented here. After measurement of the final pH, heavy metal samples are diluted with a nitric acid solution to be ready for analysis by ICP–AES.
The amount of metal ion by COSAC was calculated using simple mass balance as is given by the following equation:
| (1) |
3 Results and discussion
3.1 Characterization of the adsorbent
The nitrogen gas adsorption-desorption isotherm of the synthesized COSAC at 77 K is given by Fig. 1. The isotherm appears to have a well-defined plateau that could be classified as Type I according to the UIPAC classification [15]. The N2-isotherm shows also a small hysteresis shape in the desorption curve, showing the presence of mesopores with the possible occurrence of a capillary condensation phenomenon. The shape of this isotherm is similar to that determined by Chafik et al. using a commercial AC of NORIT type as an adsorbent material [16].
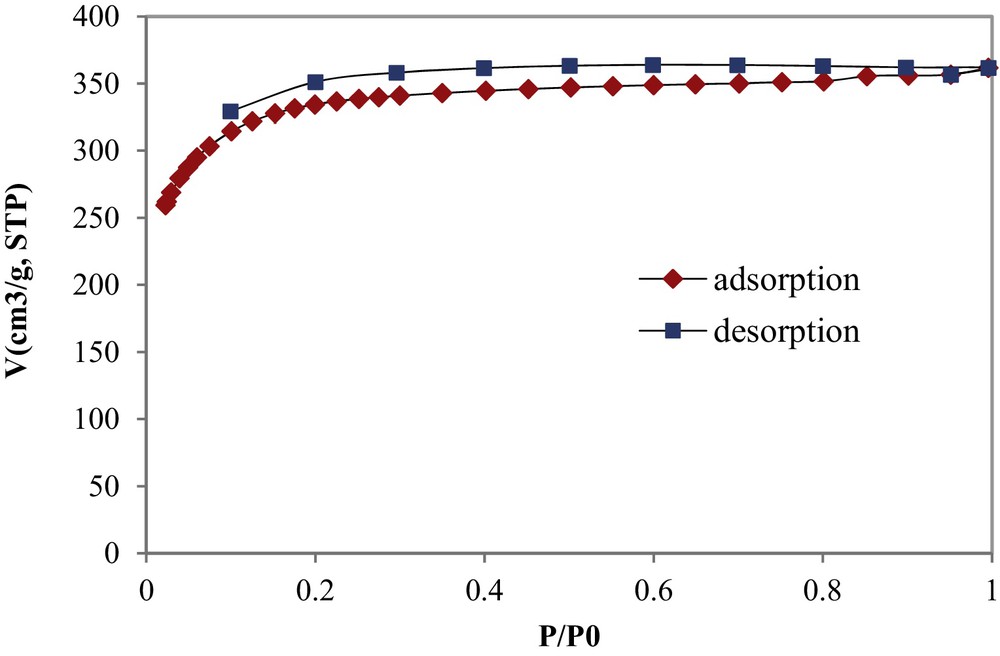
N2 adsorption–desorption isotherm of COSAC at 77 K.
The micropores’ and mesopores’ volumes were calculated to be 0.552 and 0.009 cm3/g, respectively, so micropores take about 98.4% of the total pore volume, thus asserting that COSAC is a microporous–structure material. The average pore diameter and the specific surface area of COSAC were determined to be 20.72 Ǻ and 1194 m2/g, respectively.
A SEM image of COSAC is represented in Fig. 2. We observe that the microscopic shape of COSAC is an agglomeration of sub-micrometric particles. The powder XRD data (Fig. 3) show that the main structures of activated carbons are amorphous as expected.
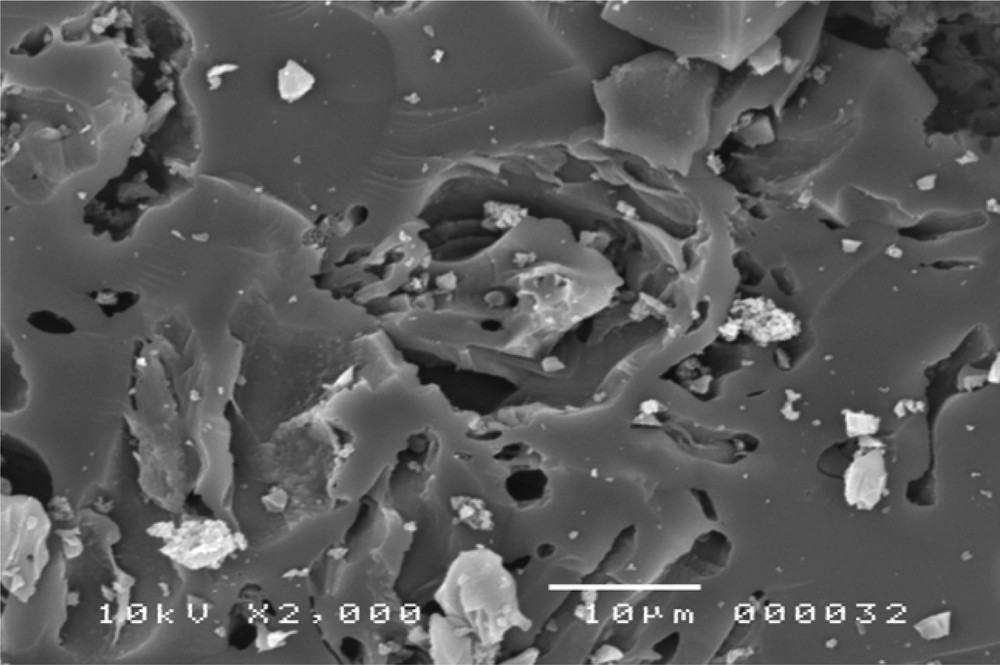
SEM photograph of COSAC.
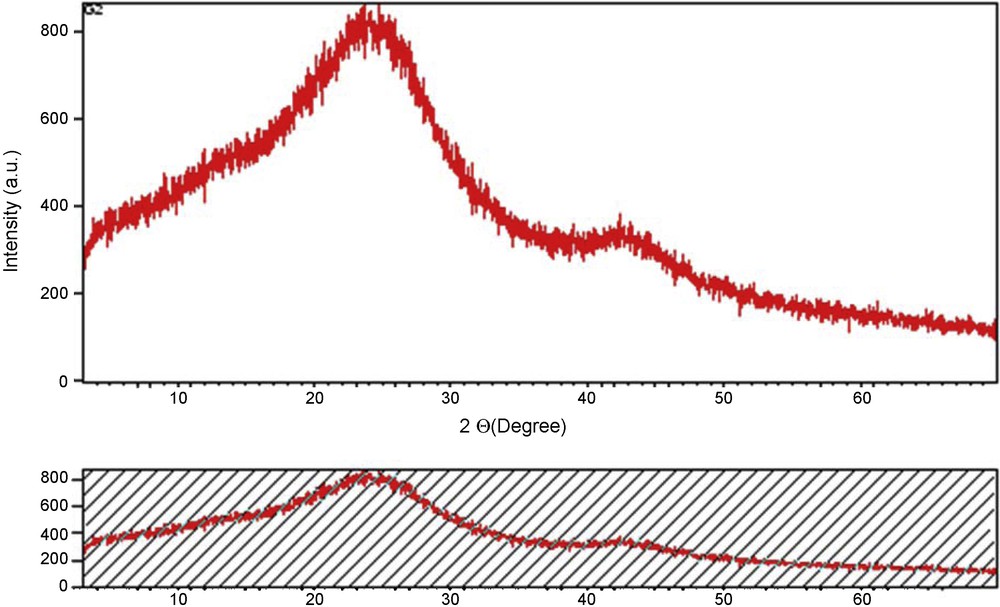
X-Ray diffraction (DRX) patterns for COSAC.
The pHpzc is an important parameter that determined the range of pH sensibility and allows the surface active and adsorption capacities to be predicted [17]. The pHpzc value of COSAC was found equal to 3.40.
Some functional groups occurring on the surface of COSAC were determined by Boehm titration. The results of surface functional group analysis reported in Fig. 4 indicate the predominance of acidic functional groups on the COSAC surface, such as carbonyl, phenol, and carboxylic functional groups. The total acidity titration gives 3.581 mequiv/g. The use of phosphoric acid in the activation process provides a high amount of acid groups on the activated carbon surface, whereas the total basic amount on the COSAC surface was about 0.213 mequiv/g.
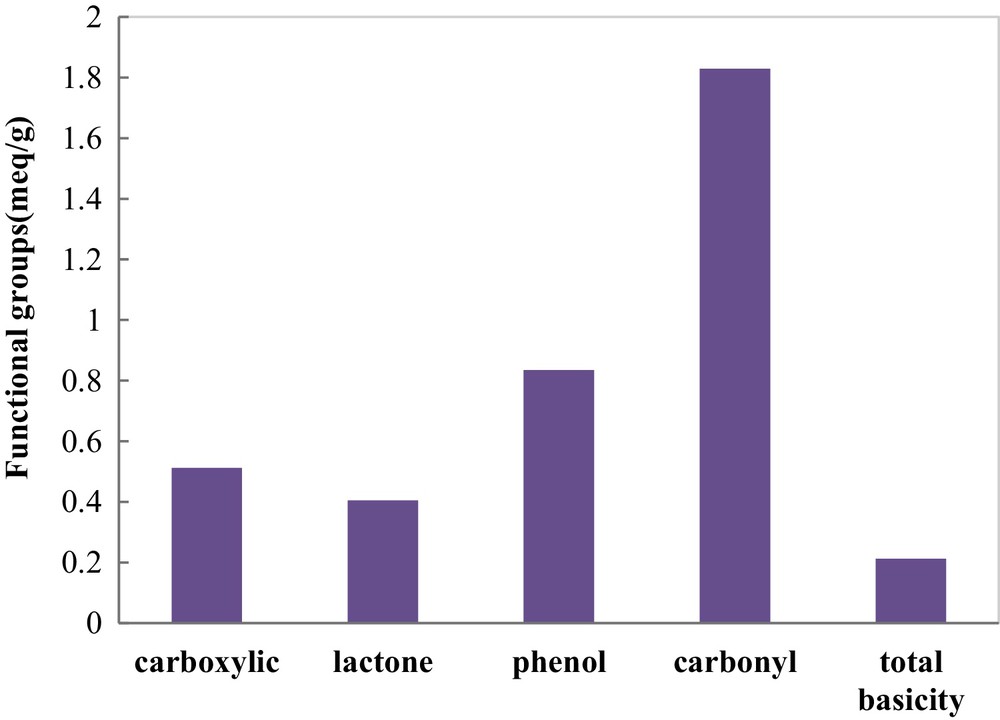
Relative contents of surface functional groups of COSAC.
The surface chemistry characterization of COSAC was accomplished by FTIR spectroscopy. Fig. 5 shows FTIR spectra of prepared activated carbons obtained by phosphoric acid. The wide transmittance band appearing at 3423 cm−1 is related to the OH stretching vibration mode in alcohol and phenol. The region between 2923 cm−1 and 2840 cm−1 is assigned to C–H stretching vibrations. The peak at 2359 cm−1 could be attributed to CN stretching. Bands appearing between 1622 and 1543 cm−1 are ascribed to C–C vibrations in aromatic rings [18]. The band between 1340–1360 cm−1 may be attributed to the aromatic CH and carboxyl–carbonate structures [19]. The bands located at 1111 cm−1 and 1052 cm−1 are related to C–O stretching in alcohols and phenols [20]. The bands observed between 1000 cm−1 and 500 cm−1 are due to the out-of-plane deformation mode of C–H for alkene aromatic rings. The bands observed at 668 cm−1 and 539 cm−1 are ascribed to C–H in out-of-plane bending in the edges of aromatic rings or are assigned to cyclic amides [18]. These results are in agreement with that found by Boehm titrations.
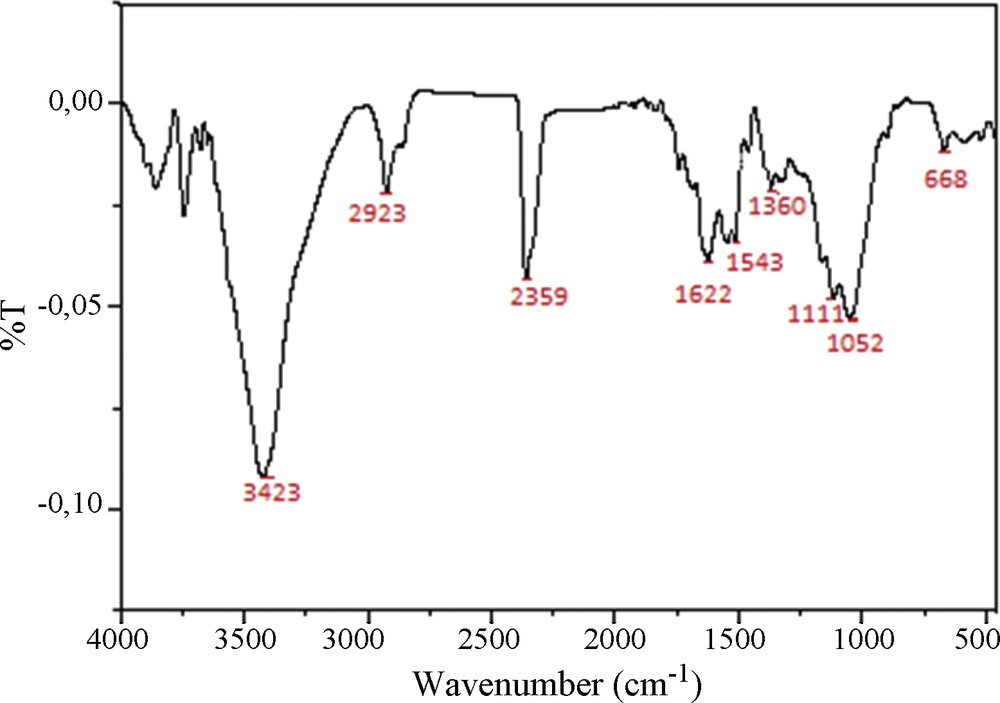
FTIR spectra of COSAC.
3.2 Effect of initial pH
In Fig. 6, the percentage uptake of metal ions by COSAC was plotted versus initial solution pH. As can be seen, metal adsorption is strongly pH-dependent and increases with increasing initial solution pH until it reaches a maximum at around pH 5. At this pH, the totality of Pb(II) and Cd(II) were adsorbed, while only 62% of Cu(II) were removed by COSAC. An increase in metal ion uptake with increasing pH was also observed by other authors. An optimum pH value of 5–8 was found by Teker et al. [21]. Kobya et al. obtained good retention of Cu(II), Cd(II) and Pb(II) in the range 3–6 and noted that at pH < 3 there was excessive protonation of the apricot stone AC surface, resulting in a decrease in the adsorption of the studied metal ions [22]. Kadirvelu and Namasivayam found that the maximum uptake of Cd(II) occurred at a pH value of 5–10 by coconut coir pith AC [23]. Using hazelnut husks AC for the adsorption of copper and lead metal ions, an optimum pH value of 5.7 was found by Imamoglu and Tekir for [24]. Lo et al. studied the removal efficiency of copper, cadmium and lead by Moso and Ma bamboo ACs [25]. The study of the effect of initial pH showed that the optimum pH values found for Moso and Ma bamboo activated carbons were 5.81–7.52 and 7.10–9.77, respectively.
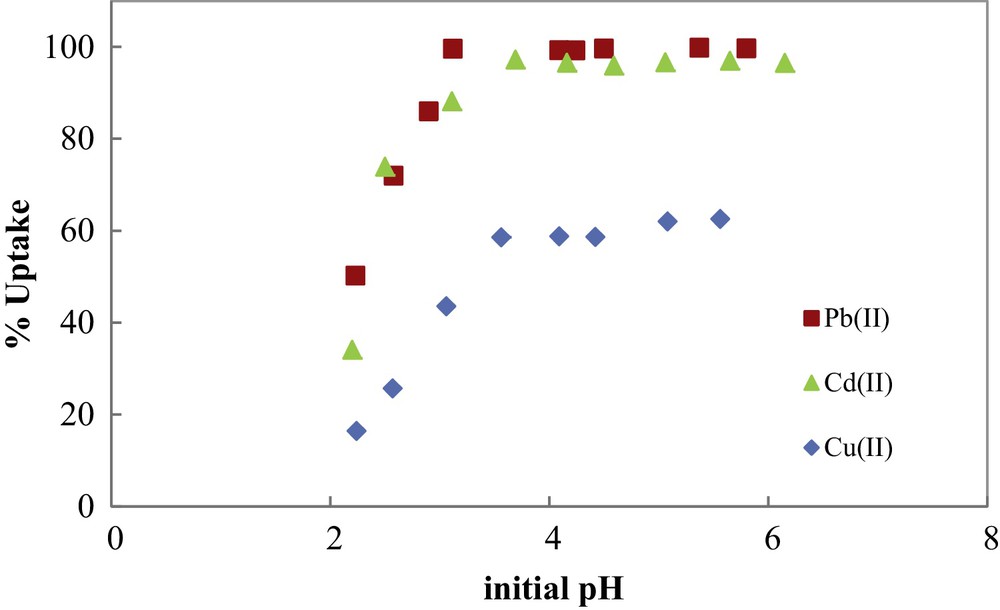
Metal ions uptake by COSAC as a function of initial solution pH. (C0: 1 mmol/L, equilibrium time: 10 h, temperature: 30 °C).
The low adsorption at low pH is due to the competition between protons and metal ions for the same adsorption sites. The effect of pH can also be explained by considering the sorbent surface charge. The measured isoelectric pH of COSAC, pHpzc = 3.40, indicates that for solution pHs lower than 3.40, the surface of the COSAC is positively charged and metal adsorption is inhibited, due to an electrostatic repulsion between metal ions and positively charged functional groups. Inversely, for pH > 3.40, the number of negatively charged sites on the COSAC surface increases, and metal adsorption becomes more important. So, for further experiments, initial pH solution will be fixed at 5.0.
3.3 Effect of contact time
The effect of contact time (from 0 to 300 min) on the adsorption of Cu(II), Cd(II) and Pb(II) metal ions was reported in Fig. 7. The evolution of the adsorbed amount of metal ions with the contact time indicates that the equilibrium was relatively fast and was totally reached in about 200 min for the three metal ions. This equilibrium time is very short compared with other literature results [26–31], which is one of the advantages of COSAC. In Fig. 7, two kinetic regions can be observed: the first one is characterized by a high adsorption rate, and this is due to the fact that initially the number of sites of available activated carbon is higher and the driving force for mass transfer is greater. Metal ions easily access first the adsorption sites. As time progresses, the number of COSAC free sites decreases and the non-adsorbed cations in solution are assembled on the surface, thus limiting adsorption capacity.
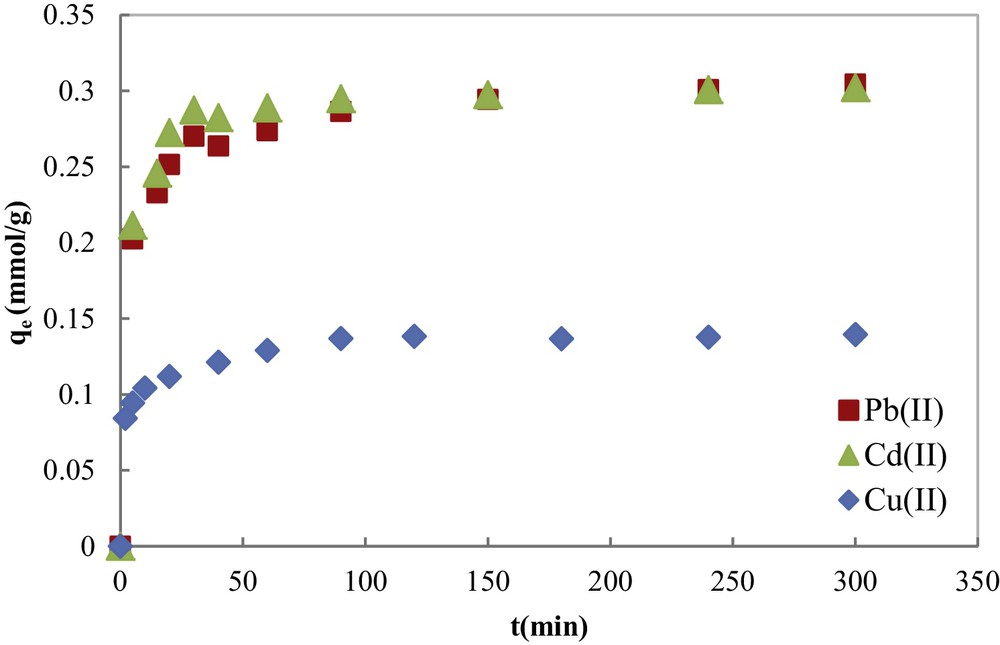
Kinetic curves of contact time on heavy metal adsorption onto COSAC from an aqueous solution (T = 30 °C; pH = 5).
The non-linear pseudo-first-order equation [Eq. (2)], pseudo-second-order equation [Eq. (3)] and the intraparticle [Eq. (4)] kinetic models were used to predict the mechanism involved in the adsorption processes of Cu(II), Cd(II) and Pb(II) metal ions onto COSAC.
| (2) |
| (3) |
| (4) |
Using the pseudo-second-order constant k2, the initial adsorption rate defined as can be determined. The external mass transfer coefficient, kL (m/s) can also be calculated through the following equation [31]:
| (5) |
The fitting of the experimental adsorption data to the pseudo-second-order kinetic model in its linear form is illustrated in Fig. 8. Pseudo-first-order and pseudo-second-order calculated parameters are listed in Table 1. The results show that the amounts of metal adsorbed (qe,cal) calculated using the pseudo-second-order kinetic model were very close to the experimental ones with quite good correlation coefficients (0.983 ≤ R2 ≤ 0.999). These values were much higher than those found by the pseudo-first-order kinetic model, suggesting that the adsorption systems can be well described by the pseudo-second-order kinetic model. This model was found more suitable to the description of the kinetics of heavy metal ions adsorbed onto different materials [31–34].
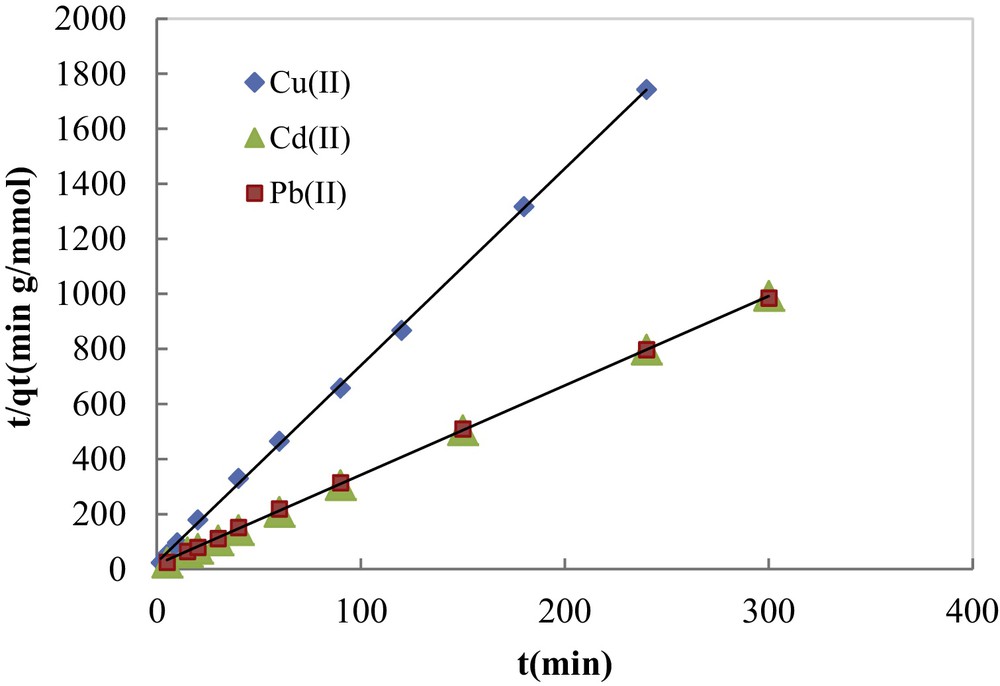
Experimental data fitting by the pseudo-second-order kinetic model.
Kinetic parameters for the adsorption of Pb(II), Cd(II) and Cu(II) onto COSAC (T = 30 °C, pH = 5).
| Cu(II) | Cd(II) | Pb(II) | |
| qe,exp (mmol·g−1) | 0.139 | 0.304 | 0.407 |
| Pseudo-first-order model | |||
| qe,cal (mmol/g) | 0.045 | 0.059 | 0.079 |
| k1 (min−1) | 0.038 | 0.023 | 0.013 |
| R2 | 0.970 | 0.973 | 0.971 |
| Pseudo-second-order model | |||
| qe,cal (mmol/g) | 0.139 | 0.304 | 0.308 |
| k2 (g/mmol·min) | 2.099 | 1.173 | 0.612 |
| 102 h (mmol/g·min) | 4.055 | 5.472 | 5.805 |
| 108 kL (cm/s) | 8.664 | 11.390 | 12.083 |
| R2 | 0.999 | 1 | 0.999 |
| Intraparticle diffusion model | |||
| k1d (mg/g·min1/2) | 0.009 | 0.024 | 0.021 |
| C1 | 0.073 | 0.156 | 0.154 |
| R2 | 0.969 | 0.975 | 0.992 |
| k2d (mg/g·min1/2) | 0.004 | 0.003 | 0.007 |
| C2 | 0.090 | 0.257 | 0.218 |
| R2 | 0.996 | 0.995 | 0.998 |
Table 1 shows that the calculated initial rate h (mmol/g·min) and the external mass transfer coefficient kL (m/s) values for the studied metal ions follow the trend below: Pb(II) > Cd(II) > Cu(II). Comparable kL values were calculated by Depci et al. [31] using Van apple pulp AC as an adsorbent for Pb(II).
The plot of the intraparticle diffusion model for each metal ion (Fig. 9) evidences the same trend in three steps. The first (fast) step covers the time range between 0 and 25 min, and corresponds to external metal ion diffusion and binding by active sites that are distributed onto the outer surface of COSAC. The second linear portion includes the adsorption period of 25–100 min, assigned to the diffusion-limited gradual adsorption of metal ions in the micropores of the adsorbed particles: intraparticle diffusion. The third linear portion lasts from 100 to 300 min, and corresponds to the establishment of the equilibrium.
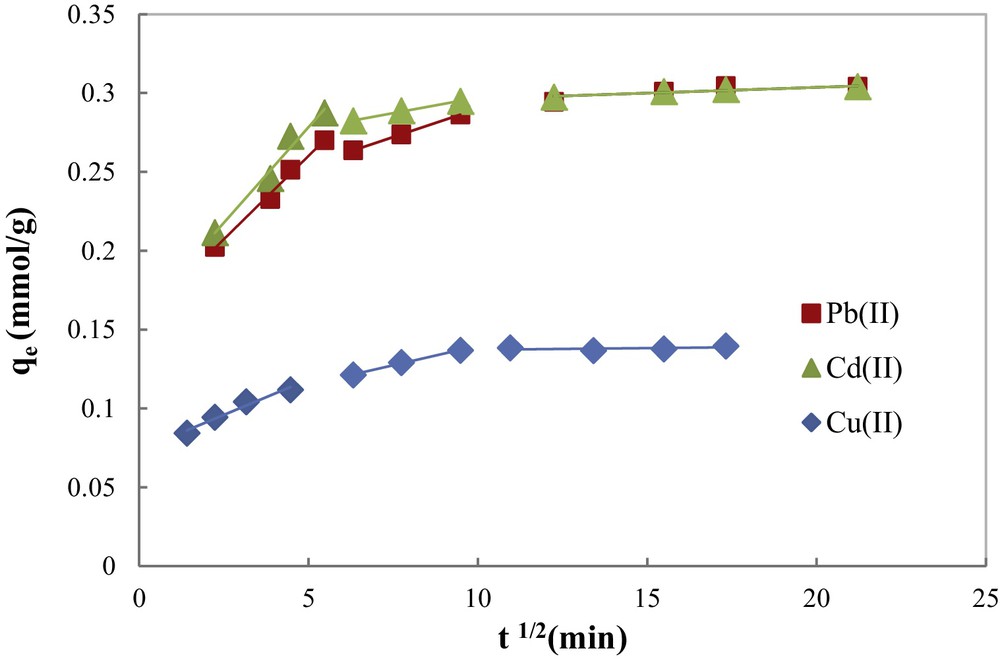
Intraparticle diffusion kinetic model for the adsorption of Cu(II), Cd(II) and Pb(II) onto COSAC (pH: 5, equilibrium time: 10 h, temperature: 30 °C, C0 = 2 mmol/L).
According to Weber and Morris [35], if intraparticle diffusion is the rate-controlling step, the plot of heavy metal uptake (qe (mmol/g)) against the square root of the contact time (t1/2) should yield a straight line passing through the origin.
The correlation coefficients of the intraparticle diffusion model (Table 1) were found to be lower than that of the pseudo-second-order model (0.969 ≤ R2 ≤ 0.998). Besides, the linear plot of each metal ion did not pass through the origin. Therefore, intraparticle diffusion was not the rate-limiting step. These results are consistent with those reported by Argun et al. [28] and Depci et al. [31].
3.4 Adsorption isotherms
Equilibrium adsorption studies were performed to determine the maximum metal adsorption capacities of COSAC. Experimental equilibrium isotherms of metal ions determined at pH 5.0 and 30 °C are shown in Fig. 10. Isotherms are of L-type according to Giles’ classification [36] describing high adsorbate–adsorbent interaction and showing initially a rapid adsorption tending to be asymptotic at higher concentrations.
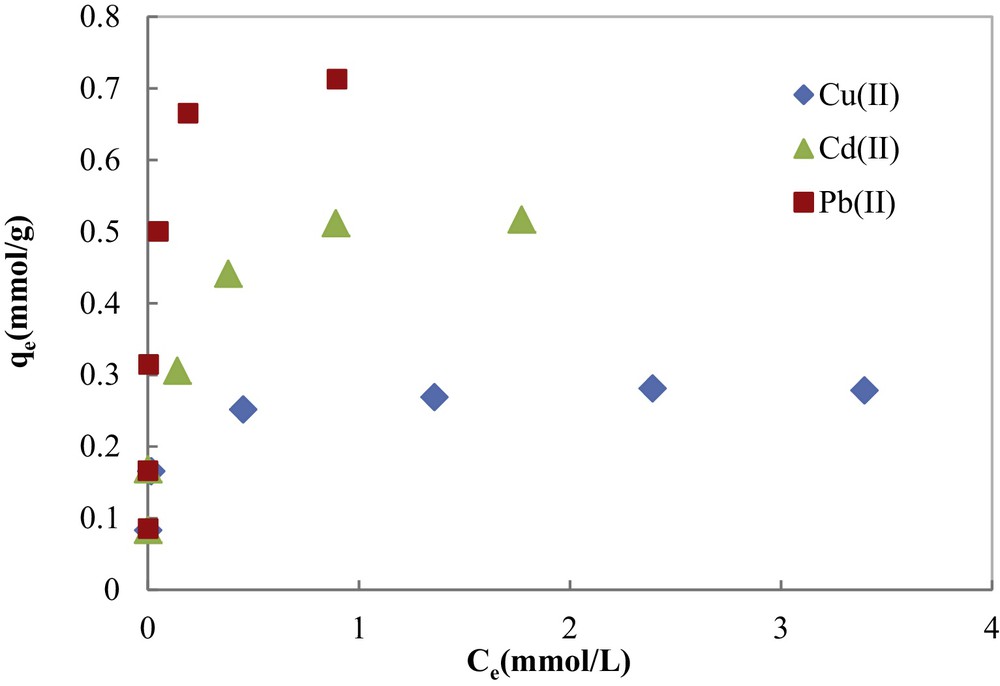
Adsorption isotherms of Cu(II), Cd(II) and Pb(II) onto COSAC (pH: 5, equilibrium time: 10 h, temperature: 30 °C).
The Langmuir [Eq. (6)], Freundlich [Eq. (7)], Redlich–Peterson [Eq. (8)] and Sips [Eq. (9)] isotherm models were used to fit the equilibrium adsorption data of copper, cadmium and lead onto COSAC, which can be expressed respectively as [18,37]:
Langmuir model:
| (6) |
Freundlich model:
| (7) |
Redlich–Peterson model:
| (8) |
Sips model:
| (9) |
Experimental equilibrium data fitted by non-linear Langmuir, Freundlich, Redlich–Peterson and Sips equations of the adsorption of Pb(II), Cd(II) and Cu(II) are presented in Fig. 10. The corresponding parameters and correlation coefficients are illustrated in Table 2.
Calculated Langmuir, Freundlich and Redlich Peterson constants and correlation coefficients for the adsorption of Pb(II), Cd (II) and Cu(II) onto COSAC.
| Metal ion | Cu(II) | Cd(II) | Pb(II) | |
| Model | qexp (mg/g) | 17.665 | 57.098 | 147.526 |
| qexp (mmol/g) | 0.278 | 0.516 | 0.712 | |
| Langmuir | KL (L/mmol) | 152.273 | 9.285 | 241.092 |
| qmax (mmol/g) | 0.268 | 0.559 | 0.654 | |
| R2 | 0.974 | 0.981 | 0.961 | |
| Freundlich | KF (mmol/L)(L/g)(1/n) | 0.253 | 0.489 | 0.797 |
| n | 7.92 | 5.958 | 5.219 | |
| R2 | 0.971 | 0.983 | 0.95 | |
| Redlich–Peterson | A (L/g) | 115.984 | 4.25 | 262.035 |
| B (L/mmol)β | 444.76 | 7.353 | 354.89 | |
| β | 0.923 | 1.057 | 0.904 | |
| R2 | 0.997 | 0.982 | 0.978 | |
| Sips | qms (mmol/g) | 0.298 | 0.805 | 2.276 |
| Ks (Lm/mmol) | 8.424 | 9.014 | 0.272 | |
| ms | 0.467 | 0.513 | 0.192 | |
| R2 | 0.999 | 0.986 | 0.989 |
In spite of the good correlation coefficients (0.986 ≤ R2 ≤ 0.999), the maximum adsorption capacities for the studied metal ions determined using a three-parameter equation of Sips (Table 2) are higher than experimental ones. Thus, Sips model cannot describe the experimental equilibrium data, especially for Cd(II) and Pb(II).
Fig. 11 and Table 2 show that the Redlich–Peterson model fits the best to the experimental data with the highest correlation coefficients (0.978 ≤ R2 ≤ 0.997) as compared to the other models: Langmuir (0.961 ≤ R2 ≤ 0.981) and Freundlich (0.950 ≤ R2 ≤ 0.983). Furthermore, the theoretical maximum values of the adsorption capacity of COSAC given by the Langmuir equation (qmax) were comparable to experimentally measured values (Table 2), thus the Redlich–Peterson and Langmuir models can perfectly describe the adsorption behavior of Cu(II), Cd(II) and Pb(II) on COSAC. This is in agreement with the work of Depci et al. [31] and Li et al. [34]. The calculated qmax values for Cu(II), Cd(II) and Pb(II) were 17.667 mg/g, 57.098 mg/g and 147.526 mg/g, respectively, which suggested that the adsorption affinity of COSAC decreased in the order Pb(II) > Cd(II) > Cu(II). This is in agreement with the kinetic adsorption order.
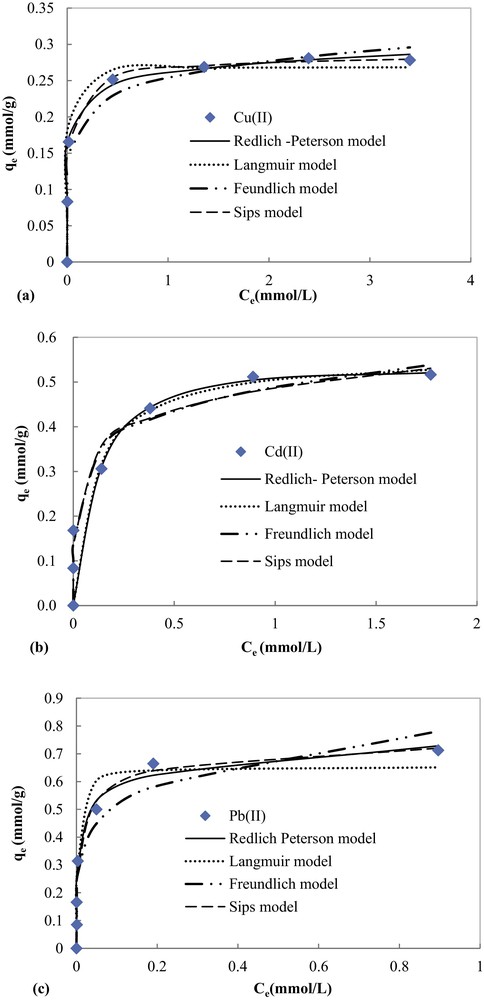
Modeling results with Langmuir, Freundlich and Redlich Peterson equations of the adsorption of (a) Cu(II), (b) Cd(II), and (c) Pb(II) onto COSAC.
A comparison of the maximum experimental adsorption capacities of different adsorbents towards the metals under study has been made and is given in Table 3. From these results, it is possible to verify that the activated carbon obtained from olive stones has a good adsorption capacity in comparison with other adsorbents, essentially for lead.
Comparison between adsorption capacities of several AC for Cu(II), Cd(II) and Pb(II) from single solutions.
| Adsorbent | qe (mg/g) | References | ||
| Cu(II) | Cd(II) | Pb(II) | ||
| Apricot stone AC | 24.080 | 33.570 | 22.840 | [20] |
| Coconut coir pith AC | – | 93.200 | – | [21] |
| Moso bamboo | ||||
| A.C | 0.401 | 0.174 | 0.407 | [23] |
| S1C1 | 0.400 | 0.257 | 0.396 | |
| S2C1 | ||||
| Ma bamboo AC | 0.634 | 0.398 | 0.404 | |
| S1M1 | 0.398 | 0.396 | 0.397 | |
| S2M1 | ||||
| Carbon coated monolith | ||||
| CCM600 | – | – | 62.900 | [24] |
| CCM8000 | 71.950 | |||
| Cow bone AC | 32.10 | [25] | ||
| Pine cone AC | – | – | 27.530 | [28] |
| Olive stone AC | 17.667 | 57.098 | 147.526 | This work |
The adsorption trend detected in this work was similar to that found by Gurgel and Gil [38]. Using black carbon as an adsorbent for the removal of Cu(II), Cd(II) and Pb(II), Wang et al. found the following order: Pb(II) > Cu(II) > Cd(II), and linked this equilibrium adsorption order to the reverse order of the hydrated ionic radii: Pb(II) 0.401 nm > Cu(II) 0.419 nm > Cd(II) 0.424 nm [39].
The difference in the adsorption capacities must be related to the behavior of these metal ions in aqueous solution, which may affect the energy of surface binding and interactions. The physicochemical properties of the studied heavy metals are illustrated in Table 4. The examination of the physicochemical properties of Pb(II), Cd(II) and Cu(II) metal ions reveals that the affinity of these metal ions to COSAC is dependent upon the molecular weight, the ionic radius, and the hydration energy of the metal ions.
Properties of the heavy metals studied [15,18,19].
| Cu(II) | Cd(II) | Pb(II) | |
| Molecular weight (g/mol) | 63.556 | 112.4 | 207.2 |
| Standard electrode potential E (V) | 0.342 | –0.403 | –0.130 |
| Ionic radius (Ǻ) | 0.73 | 0.95 | 1.19 |
| Atomic radius (Ǻ) | 1.57 | 1.71 | 1.81 |
| Hydrated ionic radius (Ǻ) | 4.19 | 4.26 | 4.01 |
| Electronic configuration | [Ar] 3d10 4s1 2, 8, 18, 1 | [Kr] 4d105s2 2, 8, 18, 18, 2 | [Xe] 4f14 5d10 6s2 6p2 2, 8, 18, 32, 18, 4 |
| Electro-negativity (Pauling) | 1.90 | 1.69 | 2.33 |
| Ionization energies (eV) | 20.292 | 16.908 | 15.03248 |
| Polarizability (10−24 cm3) | 6.10 | 7.36 | 6.8 |
| Hydration enthalpy (kJ/mol) | –2174 | –1882 | –1556 |
| softness | 2.89 | 3.04 | 3.58 |
Good relationship between the adsorbed amounts qm (mmol/g) determined by Langmuir model and the ionic radius (ri) was noted. The larger the ionic radius is, the higher the maximum adsorption capacity of COSAC will be. Pb(II) has the largest ionic radius (1.19 Å) followed by Cd(II) (0.95 Å) and Cu(II) (0.73 Å). Conversely, the order of the hydrated ionic radii (Pb(II) (4.01 Å) > Cu(II) (4.19 Å) > Cd(II) (4.26 Å) is not consistent with the adsorption preference onto COSAC evidenced by the studied metal ion. Despite this, ionic radii and hydrated radii cannot be used directly to explain the affinity order of Cu(II), Cd(II) and Pb(II) metal ions for COSAC. The effects of the ionic and hydrated radius on adsorption seem to be irrelevant when considering the average pore diameter of COSAC, which is 20.72 Å, i.e. at least 5 and 20 times greater than the hydrated and ionic radii of these metals, respectively.
Auboiroux et al. [40] and Padilla-Ortegaused et al. [41] claimed that using the hard soft acid–base (HSAB) theory can explain the metal affinity sequence of heavy metal ions studied onto activated carbon adsorbents. The values of increasing softness, presented in Table 4, are in good agreement with the maximum adsorption order found in this study.
Gao et al. [42] declared that the ions’ enthalpy is the factor that can explain the adsorption order of metal ions onto the adsorbent surface. These authors mentioned that hydration enthalpy decreases for high atomic numbers and ionic sizes. So, in this study and referring to Table 4, Pb(II) ions have greater accessibility to COSAC than Cd(II) and Cu(II).
If we consider that heavy metal adsorption onto COSAC is due to ion exchanges, it is expected that metals with higher electro-negativity will show a higher adsorption tendency [43]. The Pauling electro-negativity for each metal is Pb(II) 2.33 > Cu(II) 1.90 > Cd(II) 1.69. The adsorption affinity for heavy metal observed here (Pb(II) > Cd(II) > Cu(II)) is not in agreement with the order of electro-negativity.
When comparing COSAC sorption capacity it can be observed that the qmax value of higher-molecular-weight metals: Pb(II) (207.2 mol/g) and Cd(II) (112.4 mol/g)) is higher than that of lower-molecular-weight metals: Cu(II) (63.546 mol/g).
It could be estimated that the affinity order on COSAC for metal ions was in agreement with the order of the outer electronic configuration of the metal ions: Cu ([Ar] 3d104s1) < Cd ([Kr] 4d10 5s2) < Pb(II) ([Xe] 4f145d106s26p2) [44].
3.5 Binary equilibrium adsorption
From the analysis of data given in Fig. 12, it can be seen that both binary adsorption isotherms for copper in the presence of cadmium and lead showed a change in the shape as compared to the single copper adsorption isotherm. For single system, copper adsorption isotherm was of L-type (monolayer adsorption), whereas in binary adsorption systems, copper adsorption isotherms were of S-type, characterizing multi-layer adsorption [36].
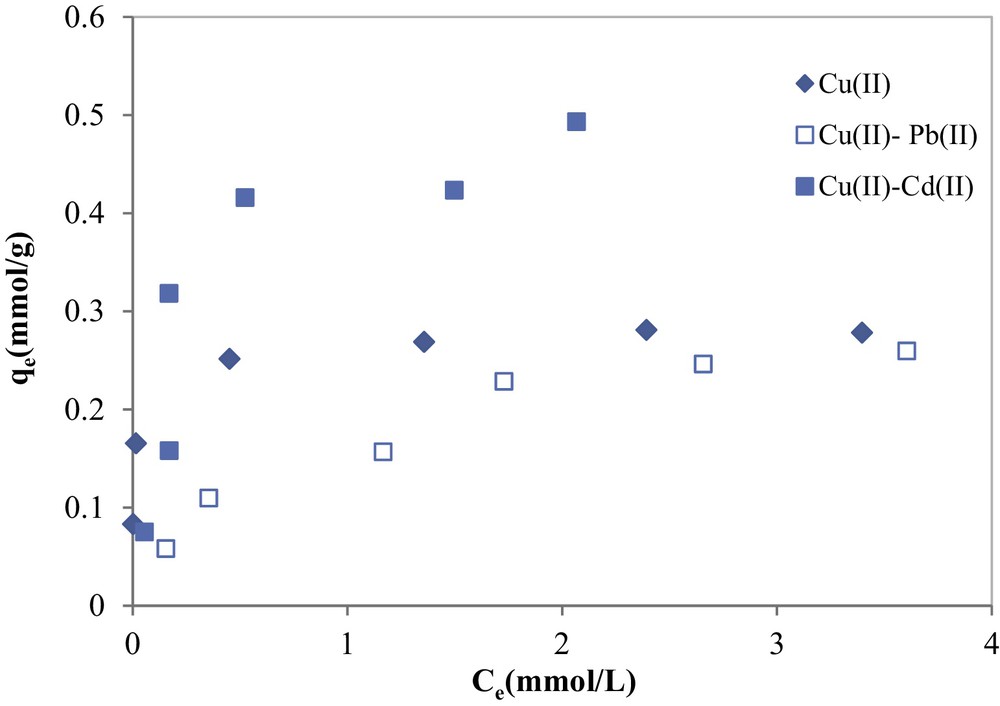
Copper adsorption in binary systems in the presence of cadmium and lead onto COSAC (initial Cd(II) = 5 mmol/L; initial Pb(II) =5 mmol/L; pH: 5, equilibrium time: 10 h, temperature: 30 °C).
The effect of the ionic interactions on the adsorption of copper in binary solutions may be represented by the ratio of the maximum adsorption capacity for copper ion in the presence of cadmium or lead ions, , to the adsorption amount of the copper in mono-solution (single adsorption), , such that for [45]:
- • : adsorption is promoted by the presence of the second metal ions;
- • : no interaction exists between adsorbing species;
- • : adsorption is inhibited by the presence of the second metal ions.
For the adsorption of copper in the presence of cadmium onto COSAC, the ratio was found to be 1.723, indicating a synergistic effect; this means that the adsorbed amount of copper in the mixture system (qe = 0.493 mmol/g) is greater than that of the individual copper in a single solution system (qe = 0.286 mmol/g), while the adsorbed amount of copper decreases in the presence of Pb(II) in solution, especially at low initial copper concentrations; in this case the ratio was found to be less than unity (0.931).
Adsorption isotherms data of copper from binary mixtures were fitted to the non-modified Langmuir model (NML) (Eq.9) and the extended Langmuir–Freundlich model (ELF) (Eq.10) [46]:
- • non-modified Langmuir model:
(10) - • extended Langmuir–Freundlich model:
(11)
Fig. 13 shows the comparison between the experimental data and the predictions with both isotherm equations for the metal ion binary systems. The parameters of both models were found using the lsqnonlin function of the optimization Toolbox in Matlab software. Model parameters and correlation coefficients are reported in Table 5.
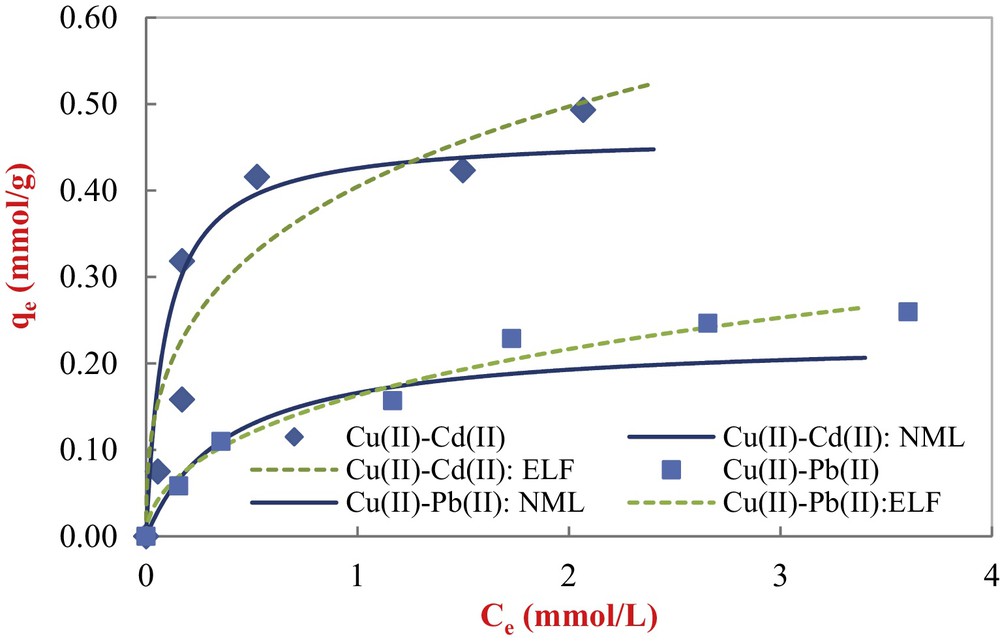
Modeling results of binary equilibrium Cu(II)–Cd(II) and Cu(II)–Pb(II) adsorption onto COSAC with non-modified Langmuir and extended Langmuir-Freundlich equations (initial Cd(II) = 5 mmol/L; initial Pb(II) = 5 mmol/L; pH: 5, equilibrium time: 10 h, temperature: 30 °C).
Estimated parameters for copper adsorption from binary mixtures using the extended Langmuir and extended Langmuir–Freundlich isotherm models.
| Parameters | Pb(II) | Cd(II) |
| qe tot (mmol/g) | 0.663 | 0.986 |
| qe Cu,exp (mmol/g) | 0.259 | 0.493 |
| Non-modified Langmuir (NML) | ||
| qm1(mmol/g) | 1.010 | 0.511 |
| K1 | 0.589 | 9.879 |
| R2 | 0.963 | 0.94 |
| Extended Langmuir-Freundlich (ELF) | ||
| qmELF1 (mmol/g) | 0.87 | 1.998 |
| KELF1 | 0.227 | 0.17 |
| nELF1 | 0.523 | 0.383 |
| R2 | 0.982 | 0.893 |
Visually, the non-modified Langmuir model provides the best fit for copper adsorption in binary systems just for the first parts of isotherms (first layer). From Table 5, the obtained correlation coefficients values are satisfactory. The non-modified Langmuir model describes satisfactorily the equilibrium data of copper in the presence of Cd(II), whereas the extended Langmuir–Freundlich model gives a reasonable fit to the copper isotherm in the presence of Pb(II), with a good correlation coefficient (R2 = 0.982).
3.6 Desorption experiments
The main goal of the desorption study was to test the ability of sulfuric acid and nitric acid solution, with normality 0.05 N to desorb Cu(II) and Cd(II) metal ions fixed on COSAC. Acid solutions of H2SO4 and HNO3 were used as solvents of choice because of their high efficiency in metal desorption, as reported by many authors [47].
Fixed-bed desorption experiments were carried out and desorption efficiencies of copper and cadmium are compared in Fig. 14. A 0.05 N solution of HNO3 showed the maximum desorption efficiency with 59.5% for Cu(II) and only 15% for Cd(II). A 0.05 N solution of H2SO4 shows the highest efficiency and gives higher recovery of about 68% for Cu(II) and 23% for Cd(II). The protons released from H2SO4 easily displace the metal cations bonded to AC during the desorption process. For both used nitric and sulfuric acid solvents, the desorption of Cd(II) from COSAC was the weakest.
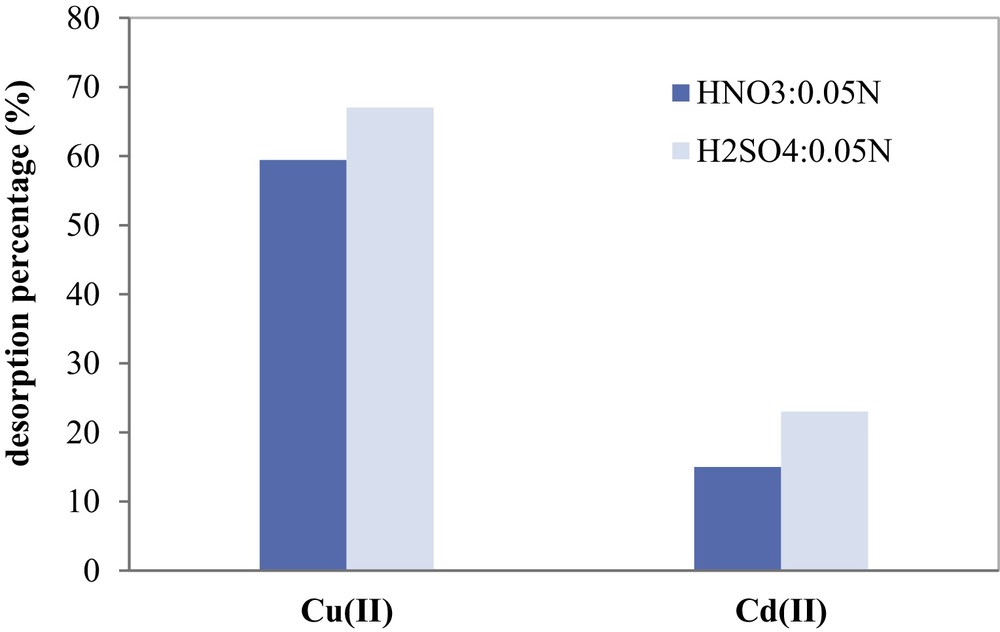
Desorption efficiencies of Cu(II) and Cd(II) fixed on COSAC using NHO3 and H2SO4 as eluents.
4 Conclusions
In this study, the removal of copper, cadmium and lead metal ions from aqueous solution by adsorption on olive-stone activated carbon produced by thermo chemical process using phosphoric acid (COSAC) was investigated.
The obtained results show that metal adsorption is pH-dependent and maximum adsorption was found to occur at an initial pH of 5.0. The adsorption equilibrium was fast and was achieved, in our experimental conditions, after 200 min for the three metal ions studied. The kinetics of metal adsorption on COSAC follows the pseudo-second-order rate model and calculated initial rate constants (h) and external mass transfer coefficients (kL) follow the order: Pb(II) > Cd(II) > Cu(II). The equilibrium adsorption data are best fitted by the Redlich–Peterson model as compared to Langmuir, Freundlich and Sips models, and the adsorption capacity of COSAC decreased in the order: Pb(II) (147.526 mg/g) > Cd(II) (57.098 mg/g) > Cu(II) (17.665 mg/g).
Our binary adsorption study evidences that the affinity of copper toward the carbon surface is stronger than that of nickel or lead. The examination of binary adsorption systems Cu–Cd and Cu–Pb shows that the affinity of copper toward prepared activated carbon surfaces was strongly dependent on the initial concentration of nickel and lead. The adsorption amount of copper increased in the presence of nickel and decreased in the presence of lead.
The results evidence that COSAC is a promising material for metal ions elimination in single and binary mixtures, due to its high specific surface area and to the presence of specific oxygen functional groups such as carbonyl, phenol and carboxylic ones, responsible for heavy metal ion uptake.
Acknowledgment
The authors gratefully acknowledge the members of the Common Service Research Unit (USCR) of ENIG, Tunisia, and of MiMA Lab, UdG, Spain.