

1 Introduction
The purification of water by ozone has been experimentally confirmed as the most appropriate way [1]. Ozone is known as a powerful oxidant of organic and inorganic micro-pollutants [2]. It acts either through a direct reaction of molecular ozone or through a radical-type reaction involving hydroxyl radical (OH°) generation induced by ozone decomposition in water [3]. However, ozone reacts slowly with some organic compounds such as nitro-aromatic compounds. For this reason, many works focused on developing catalysts for ozonation in order to enhance ozone's action and to achieve higher oxidation efficiencies. The combination of ozone with homogeneous or heterogeneous catalysts, with or without metallic compounds, has been investigated [4]. Adding a catalyst can improve the oxidation rate and the ozone concentration required to achieve the same degradation level [5]. Metal ions in acidic solution and metal oxides are usually used as catalysts for ozonation [6]. Using metal salts dissolved in solutions or solid powder metal oxides can cause secondary polluting problems because catalysts have to be removed after the oxidation reaction of the organic compounds. Those particles are unstable and will aggregate together to form large particles. These problems can be overcome and the performance of such catalysts can be improved by highly distributing the catalyst components over a porous support [5–7]. The advantages of using catalysts supported on porous materials are as follows: the active agent could be kept in a dispersed and stable state, the organic compound to be oxidized can be adsorbed onto the porous support at first to enhance its surface concentration, which is favored by the catalytic reaction as it accelerates oxidation during the reaction. The oxidation reaction occurs at the support surface so that the reaction activation energy can be reduced; so the residence time for reaction completion can be shortened. As a consequence, the investment and operation costs can be reduced [6].
The use of carbonaceous materials as catalytic supports continues to increase because of the high versatility of this material [8]. The most important carbon support material is activated carbon (AC), followed by carbon black and graphite materials [6]. Based on its porous structure and surface functional groups, activated carbon exhibits the most favorable physical and chemical characteristics [9] for the preparation of supported catalysts [8,10–13]. The active metals will be dispersed into the small pores; oxidized intermediate products could achieve total oxidation, giving as final products carbon dioxide and water [6]. In the view of these characteristics, activated carbons are used as supports for a great number of active phases, including noble metals [7,8,14,15]. In catalytic processes, metal dispersion in a final catalyst plays a key role as it enhances its efficiency [16]. The interaction of the support surface both with the metal precursor and with the solvent during the impregnation step greatly influences metal uptake and dispersion into the catalyst [8]. It is necessary to maximize the dispersion of the metal on the surface of the support. The porous structure controls the availability of surface active sites and thereby the degree of catalyst dispersion. Pore size distribution plays a crucial role in catalyst preparation. The access of metals can be also improved by surface groups due to the decrease of the hydrophobicity of the carbon [16]. There are only a few studies, which were interested in investigating the effect of preparation conditions on the dispersion of metals and the structure of the final catalyst [6,8].
The use of a supported catalyst is common in the oxidation of a great number of organic compounds [17–22], such as nitrobenzene [23,24]. This molecule is considered to be highly toxic; unfortunately, it is resistant to oxidation by biological treatment processes due to its carcinogenesis and mutagenesis [24]. It is also considered as a hard biodegradable compound and inhibitor for activated sludge [25]. This important class of industrial chemicals is widely used in the synthesis of many products, including dyes, polymers, pesticides, and explosives [26,27]. Unfortunately, the widespread application of nitro-aromatic compounds and their improper disposal has resulted in their release into the environment [28]. The nitro group, which provides chemical and functional diversity in these molecules, also contributes to the recalcitrance of these compounds to biodegradation [27]. There is abundant literature [23,29] dealing with the oxidation of nitrobenzene using Cu-based catalysts. The results indicate that supported catalysts show significant activities for the catalytic oxidation of nitrobenzene.
The aim of this work is to investigate the effects of preparation conditions, metal precursor nature and texture of the support on the properties of the final catalyst, its adsorption capacity, and its catalytic activity in the ozonation of nitrobenzene.
2 Experimental
2.1 Materials and reagents
A commercial granular activated carbon (AC), type Chemviron CAL, produced from selected-grade bituminous coal by a highly developed and strictly controlled manufacturing process, with a specific surface area ranging from 1050 to 1100 m2/g and an apparent density between 0.45 and 0.52, was selected as a porous catalyst support due to its high surface area and its high porosity. The precursor salt employed as an active agent for the deposition of copper on AC was a solution of pure Cu(NO3)2·3H2O (Riedel–de Haën).
2.2 Preparation of the activated carbon-supported copper catalyst
The wetness impregnation method was implemented to prepare the Cu/AC catalyst with high activity and high distribution. The raw AC was washed by distilled water until the effluent was clear in color. The water was then removed and the AC was dried at 110 °C for 24 h, then it was immersed in a solution of copper nitrate (0.001 M) under constant shaking (400 rpm) for 24 h at ambient temperature. Different impregnation rates (2, 4, 10 and 12%) were used in terms of relative activated carbon mass added. After impregnation, activated carbon is dried overnight at ambient temperature then filled into an oven for thermal treatment. Nitrogen was used as the carrier gas; the temperature ramp rate was 7 °C/min. Three oven temperatures (350 °C, 450 °C, and 550 °C) and three calcination durations (1 h, 2 h, and 3 h) were examined. The calcination step aims at removing the counterion of the metallic cation and thus to fix the metallic species on the carbon matrix [9]. The impregnated copper amount of the prepared catalysts was measured by soaking 1 g of catalyst in 10 mL of 65% nitric acid for 24 h at ambient temperature to dissolve the metal or metal oxide from the support. The solid was filtered out from the acidic solution and the solution diluted to a copper concentration between 0 and 20 ppm. The concentration of copper ions was determined using Inductivity Plasma Coupled with Atomic Emission Spectrophotometer: ICP–AES (Activa-M Horiba Jobin Yvon). The impregnation amount was found to be around 0.8 to 0.9 times that intended for different samples.
The final obtained catalyst was called “Cu/ACx”, where x indicates the percentage of copper used in the preparation, as specified in Table 1. The impregnation rate is the relative activated carbon mass per gram of copper nitrate solution.
Experimental conditions for the preparation of Cu–AC catalysts.
| Sample | Treatment |
| Cu–AC2 | Impregnated with 2% of copper calcined at 450 °C for 2 h |
| Cu–AC4 | Impregnated with 4% of copper calcined at 450 °C for 2 h |
| Cu–AC10 | Impregnated with 10% of copper calcined at 450 °C for 2 h |
| Cu–AC12 | Impregnated with 12% of copper calcined at 450 °C for 2 h |
| Cu–AC12/350 | Impregnated with 12% of copper calcined at 350 °C for 2 h |
| Cu–AC12/550 | Impregnated with 12% of copper calcined at 550 °C for 2 h |
| Cu–AC12/1 | Impregnated with 12% of copper calcined at 450 °C for 1 h |
| Cu–AC12/3 | Impregnated with 12% of copper calcined at 450 °C for 3 h |
2.3 Characterization of the activated carbons
2.3.1 Texture
The adsorption–desorption isotherm of nitrogen at 77 K was determined by using an automatic apparatus (Autosorb AS1-C, Quantachrome). Prior to measurement, the sample was out-gassed at 250 °C under vacuum for 24 h. The specific surface areas SBET of the samples were calculated using the Brunauer–Emmett–Teller (BET) method, using adsorption isotherms in the relative pressure range of 0.05 ≤ P/P0 ≤ 0.30. The total pore volume of the sample was estimated from the volume of adsorbed N2 at the maximum relative pressure close to P/P0 = 1.
2.3.2 Point of zero charge: pHpzc
The point of zero charge was determined following standard acid–base titration procedures. The method proposed by Revira Utrilla et al. [30] was used. Six different solutions made from 50 mL of a 0.1 M NaCl solution were prepared at different pH values between 2 and 12. Their pH was adjusted by adding adequate quantities of 0.01 M NaOH or HCl solutions. When the pH value was stable, 0.15 g of AC or Cu/AC was added to each flask, which was shaken at 400 rpm for 48 h. The pHpzc value was located at the point where the pHfinal vs. pHinitial curve crossed the pHinitial = pHfinal line.
2.3.3 Acid and basic surface groups
Boehm's titration method [31] was applied to determine the total content of acidic and basic surface functional groups onto both AC and Cu/AC. One gram of the sample was dispersed into 0.1 N solutions of each one of the following reactants: NaHCO3, Na2CO3, NaOH, and HCl. The flasks were then shaken at 400 rpm for 72 h at room temperature.
Then, the solutions were filtered and titrated by volumetric method. From different titration results, the various acidic and basic groups were quantified.
2.4 Nitrobenzene adsorption tests on AC and Cu/AC
Nitrobenzene was supplied by Prolab, its typical properties are presented in Table 2. Different masses of activated carbon (7.5–100 mg) were introduced into well-closed flasks with 100 mL of a nitrobenzene solution (20 mg/L) at 25 °C for 24 h. It was previously checked that this period of time was enough to reach the equilibrium adsorption. After equilibrium has been obtained, the suspensions were filtered and the concentrations of residual nitrobenzene in solution were measured by UV spectrophotometry absorption at a wavelength of 268 nm, for which the compound's absorbance was maximum (λmax, Table 2), using a Shimatzu 1700 UV visible spectrophotometer. This was carried out for different pH values (2–11). NaOH and HCl solutions with different concentrations were used for adjusting the pH. The added amounts of these solutions were insignificant compared to the total volume of the suspensions, so the concentration of the solute was not affected by these additions.
Selected properties of nitrobenzene.
| Solute | Mass molar (g/mol) | Density at 20 °C (mg/L) | Solubility in water at 20 °C (g/L) | λmax (nm) |
| Nitrobenzene | 123.11 | 1.2 | 1.9 | 268 |
2.5 Ozonation procedure
The oxidation of nitrobenzene was carried out in a 2-L gas–liquid stirred reactor of controlled temperature equipped with a stirrer for mixing and controlling the loop jacket. In each experiment, the reactor was filled with 1 L of a nitrobenzene aqueous solution (20 mg/L), and 1 g of AC or Cu/AC was added. The reactor was continuously fed with an ozonated oxygen stream. The temperature in the reactor was controlled by a thermostatic bath; it was kept constant at 20 °C. Agitation was maintained constant at 300 rpm in order to keep the reactor content perfectly mixed. Ozone was produced in a pure oxygen stream using an ozone generator with a controlled power to achieve variable O3 concentrations up to 100 mg/nL of O2. The aqueous ozone concentration was determined by the Indigo Carmin method [32] while the gaseous ozone concentration was determined by the iodometric method [33]. The residual concentrations of nitrobenzene of water samples (each being 10 mL) taken regularly from the ozonation reactor at various reaction times were determined by UV–visible spectrophotometry. The degree of mineralization was followed by TOC analyses.
For comparative purposes, both adsorption on activated carbon and ozonation experiments in the absence of AC and Cu/AC were performed in the same system, under identical experimental conditions.
3 Results and discussion
3.1 AC and Cu/AC characterization
3.1.1 Texture
The commercial Chemviron granular AC (1–1.25 mm) used in this work has a large surface area and a high porosity, making it a suitable catalyst support. The principal physical properties of the AC and the Cu/AC catalysts are summarized in Table 3. It can be noted that the Chemviron activated carbon has a microporous structure. The micropores’ volume equals 88.4% of the total pore volume, with a mean diameter from 2.0 to 2.5 nm.
Physical properties of Chemviron activated carbon and supported catalysts.
| Sample | SBET (m2/g) | Vtot (cm3/g) | Vmic (cm3/g) | Dmic (Å) |
| AC | 939 | 0.52 | 0.46 | 22.32 |
| Cu–AC2 | 942 | 0.54 | 0.47 | 23 |
| Cu–AC4 | 862 | 0.55 | 0.44 | 25 |
| Cu–AC10 | 870 | 0.51 | 0.44 | 23 |
| Cu–AC12 | 962 | 0.61 | 0.50 | 25.25 |
| Cu–AC12/350 | 926.7 | 0.47 | 0.40 | 21.8 |
| Cu–AC12/550 | 1040 | 0.53 | 0.49 | 20.6 |
| Cu–AC12/1 | 940 | 0.53 | 0.47 | 22.5 |
| Cu–AC12/3 | 857 | 0.51 | 0.42 | 23.8 |
From Table 3, it can be concluded that there is no significant effect of the impregnation rate on the specific surface area, and the porosity of the support is related to the low amount of copper inserted on the surface of AC. However, when the calcination temperature rises from 350 °C to 550 °C, the specific surface area of the catalyst increases from 926.7 m2/g to 1040 m2/g. This is mainly due to the development of the porosity of the catalyst under the effect of temperature. The largest surface area was 1040 m2/g, it was obtained when the Cu/AC was impregnated with 12% Cu loading and calcined at 550 °C for 2 h. For the calcination time it can be observed that the surface of the catalyst is constant when the heating time increases from 1 h to 2 h, whereas when the heating time increases to 3 h, the surface area decreases. This can be explained by the destruction of the structure of the catalyst under the high heating temperature.
Nitrogen adsorption–desorption isotherms presented in Fig. 1 illustrate the evolution of porosity from the raw activated carbon to the copper-loaded activated carbon.
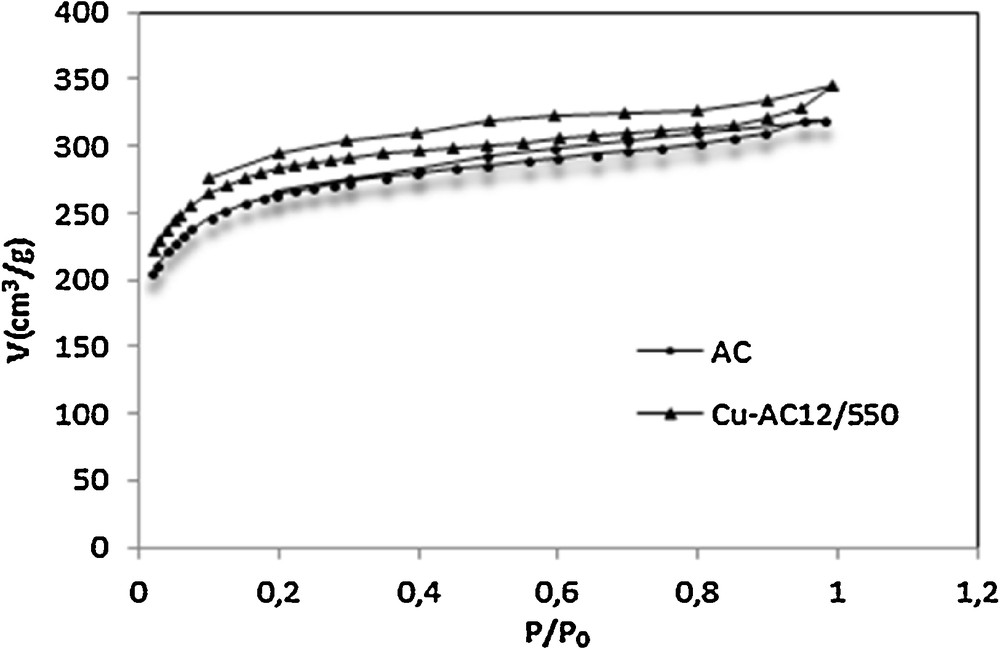
Nitrogen adsorption-desorption isotherms (77 K) on the AC and the Cu-AC12/550.
As it can be observed on Fig. 1, the raw AC exhibits a hybrid I/IV isotherm according to the IUPAC classification, which is characteristic of microporous materials with a contribution of mesoporosity [9]. The activated carbon show also a broad knee at relative pressures P/P0 = 0.2, suggesting the presence of micropores [9].
Raw AC shows a type-H4 hysteresis loop on the desorption curve related to the presence of small slit-shaped pores and to a well-developed mesoporosity [9,34].
When copper was impregnated on the surface of the activated carbon, some modifications were obtained for raw AC. It can be observed from the isotherm of Cu/AC12/550 that a relatively important porosity development was obtained. This effect is attributed to copper incorporation into the carbon matrix. The same effect was observed by Hero et al. [9], when activated carbon was impregnated by copper.
Adding copper opens widely the hysteresis, with an effect on the mesoporosity structure. At low relative pressures, the two isotherms approximately overlap; this means that microporosity seems not to be affected by copper insertion. Probably, the size of cooper ions (0.26 nm) allows this metal to access mesoporous and highly microporous structures, but not the narrow micropore diameters.
3.1.2 Surface chemistry characterization
The quantification of the acidic and basic characters of AC and Cu/AC12 resulting from Boehm's titration is shown in Fig. 2. It can be seen that after impregnation with copper, the amount of total acidic groups on the surface of activated carbon decreases by about 30%, while the amount of the total basic groups increased (30%). This indicates the good adsorption of copper on the carbonyl surface groups of activated carbon. A variety of interactions between cationic species (Cu2+) and the activated carbon surface might occur, such as formation of surface complexes, ion-exchange processes, and redox reactions [35]. Previous investigations have demonstrated that the presence of oxygenated groups on the surface of AC favors metal adsorption through the formation of metal complexes [36]. In general, this process is considered an ion-exchange reaction with the participation of strong acidic surface groups [31,32], which could be described by the following mechanism:
| (1) |
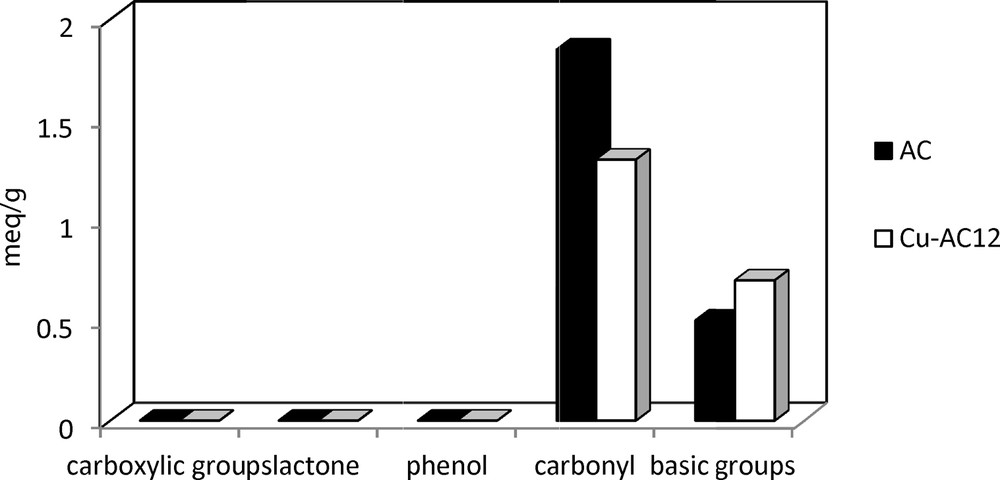
Boehm analysis of activated carbon (AC) and copper supported on activated carbon (Cu–AC)12.
The decrease of the amount of the acid groups can be explained by the ion exchange phenomenon between the surface functional groups of AC and the copper nitrate solution during the impregnation process: two hydrogen (H+) ions from the surface of the activated carbon can be replaced by a copper ion (Cu2+), which leads to a decrease in the acidity of the AC.
3.1.3 The pH of zero charge analysis: pHpzc
The piezoelectric pHs of both AC and Cu/AC12 were determined; the results are shown in Fig. 3. Copper insertion results in a pHpzc increase from 6.3 to a basic pH of 7.1, which confirms those of the Boehm analysis.
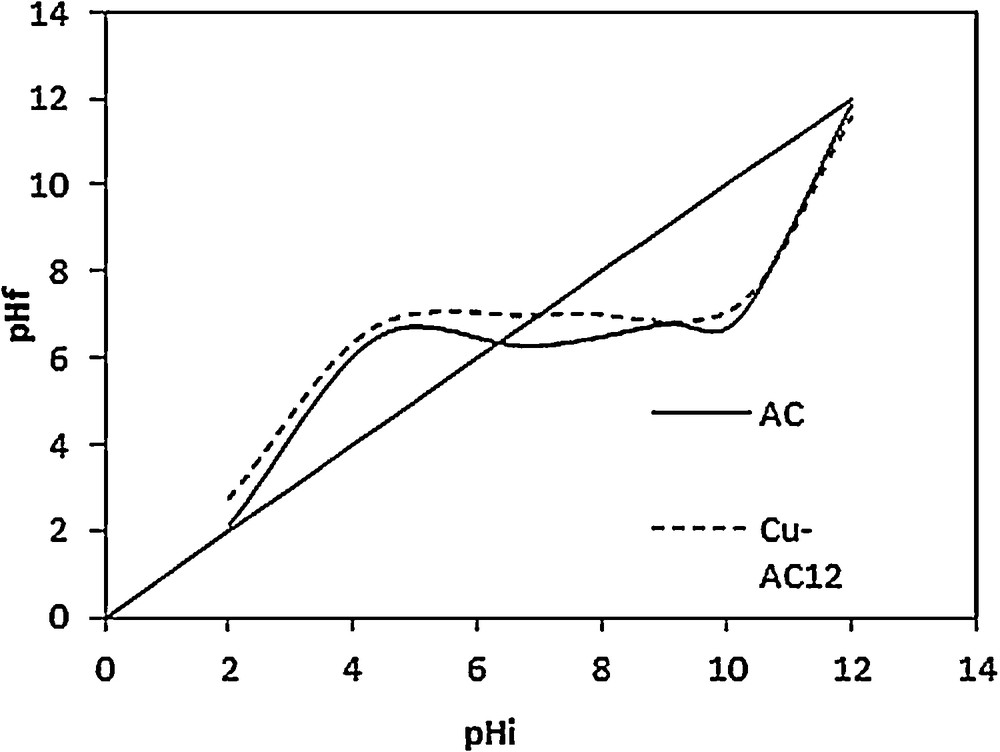
pHpzc analysis of activated carbon (AC) and copper supported on activated carbon (Cu–AC)12.
3.2 Nitrobenzene adsorption on activated carbon and the supported catalyst
3.2.1 Adsorption isotherms
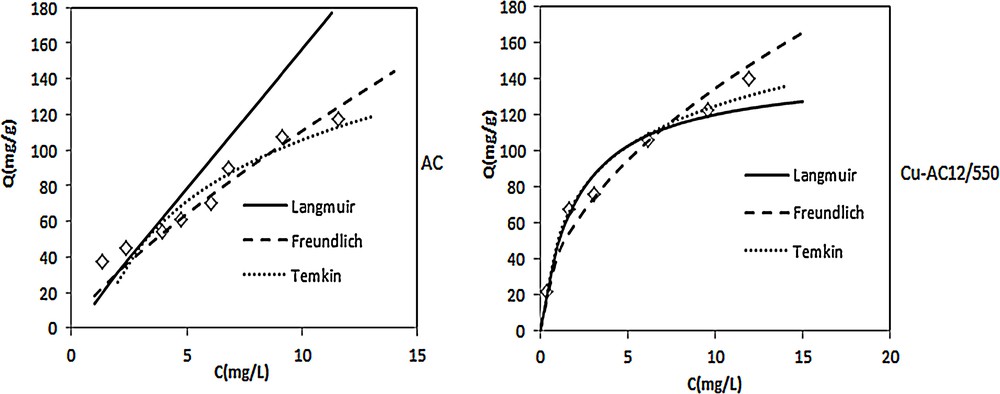
Adsorption equilibrium data, expressed by the mass of adsorbed species per unit weight of adsorbent and liquid phase equilibrium concentration of adsorbate, are usually represented by adsorption isotherms. The adsorption isotherms of nitrobenzene onto AC and the Cu/AC12/550 at 25 °C are shown in Fig. 4. The amount of NB uptake by the adsorbent was calculated using the following equation:
| (2) |
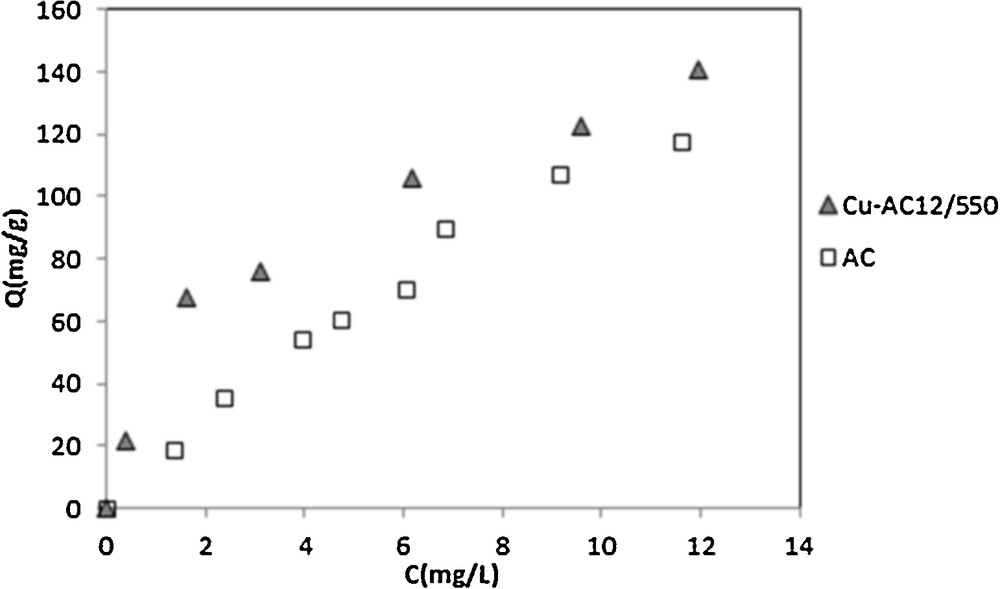
Adsorption isotherms of nitrobenzene on activated carbon (AC) and copper supported on activated carbon (Cu–AC)12/550 at 25 °C ([NB] = 20 mg/L, pH = 5.5, T = 25 °C).
The slope of NB adsorption differs between AC and Cu/AC. Without copper insertion, NB must be adsorbed following a multilayer process. After the fixation of copper, the NB is adsorbed in monolayers; this could be related to the widening effect of mesoporous structures noted on nitrogen adsorption isotherms at 77 K.
Three models were tested for their ability to describe the experimental isotherms, namely the Langmuir isotherm, the Freundlich isotherm, and the Temkin isotherm. The Langmuir adsorption model is based on the assumption that maximum adsorption corresponds to a saturated monolayer of solute molecules on the adsorbent surface, with no lateral interaction between the sorbed molecules. The linear expression of the Langmuir model [37] is given by Eq. [3]:
| (3) |
The essential characteristics of the Langmuir isotherm can be expressed in terms of a dimensionless constant separation factor RL that is given by Eq. [4] [37]:
| (4) |
The Freundlich isotherm is an empirical equation employed to describe heterogeneous systems [37–39]:
| (5) |
The Temkin isotherm [37] has generally been applied in its linear form:
| (6) |
The isotherm parameters obtained from the fitting curves by the different models using linear regression are given in Table 4.
Isotherm parameters of nitrobenzene on the AC and Cu–AC12/550.
| Langmuir | Freundlich | Temkin | ||||||||
| qm | KL | RL | R2 | Kf | nf | R2 | B | AT | R2 | |
| AC | 116.279 | 0.134 | 0.267 | 0.869 | 25.53 | 1.69 | 0.970 | 49.638 | 0.84 | 0.867 |
| Cu–AC12/550 | 144.927 | 0.48 | 0.084 | 0.995 | 38.7 | 1.88 | 0.977 | 30.427 | 4.7 | 0.973 |
The obtained results indicate that the Langmuir isotherm fits quite the experimental data of the adsorption of NB on Cu/AC and the monolayer adsorption capacity according to this model was 144.927 mg/g. The fact that the Langmuir isotherm fits the experimental data very well may be due to a homogeneous distribution of the active sites onto the surface of Cu/AC [36]. The RL value of Cu/AC was found to be 0.084, indicating that the adsorption of NB on Cu/AC is favorable. Whereas for activated carbon the Freundlich isotherm is the suitable model to describe the experimental data, Renguoat et al. also found that the Freundlich model fitted well the adsorption isotherm of NB on activated carbon compared to silica [42].
3.2.2 Adsorption kinetics
Kinetic results were fitted by both pseudo-first and pseudo-second kinetic models [39], in order to determine which model described better the experimental data (Figs. 5–7).
Adsorption isotherm of nitrobenzene (NB) on activated carbon (AC) and copper supported on activated carbon (Cu–AC)12/550 NB ([NB] = 20 mg/L, pH = 5.5, T = 25 °C).
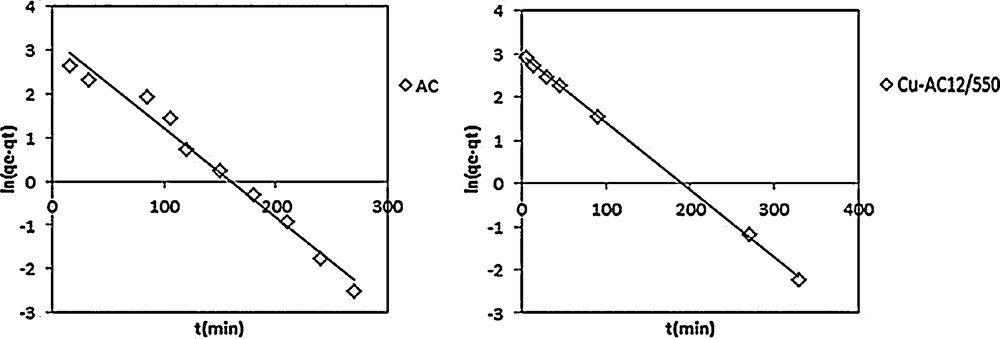
The pseudo-first order plot for nitrobenzene adsorption on AC and Cu-AC12/550 NB ([NB] = 20mg/L, pH = 5.5, T = 20 °C).
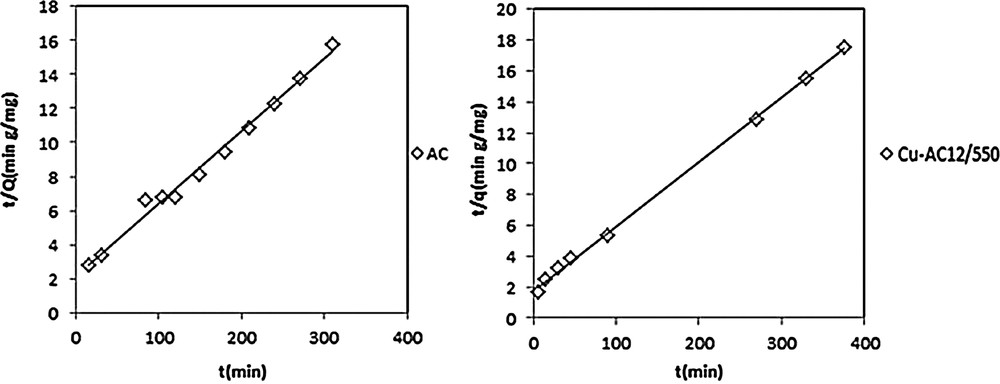
The pseudo-second order plot for nitrobenzene adsorption on AC and Cu-AC12/550 NB ([NB] = 20mg/L, pH = 5.5, T = 20 °C).
The pseudo-first-order used is that of Lagergren, given by the following equation:
| (7) |
The integration of Eq. [7] gives in the conditions (t = 0, qt = 0) and (t = t, q = qt)
| (8) |
In order to obtain the rate constants, the straight line plots of ln(qe–qt) against t has been analyzed. The rate constant, k1, and the correlation coefficients, R2, of NB adsorption on AC and Cu/AC were calculated from these plots.
The sorption kinetics may be described also by a pseudo second order. The differential equation is the following:
| (9) |
Integrating Eq. [9] for the boundary conditions t = 0 to t = t and qt = 0 to qt = qt gives:
| (10) |
Pseudo-first-order and pseudo-second-order theoretical fitting parameters are listed in Table 5. The results showed that the calculated amounts of NB adsorbed (qe,cal) by the pseudo-second-order kinetic model are very close to experimental data and that the correlation coefficient values are quite good (0.990 ≤ R2 ≤ 0.999).
Parameters of different kinetic models of the adsorption of nitrobenzene on AC and Cu–AC12/550.
| Adsorbant | C0 (mg/L) | qe,exp (mg/g) | Pseudo first order | Pseudo second order | ||||
| k1 (min−1) | qe,cal (mg/g) | R2 | k2 (103 min−1) | qe,cal (mg/g) | R2 | |||
| AC | 20 | 19.69 | 0.0197 | 21.115 | 0.980 | 0.855 | 23.42 | 0.991 |
| Cu–AC | 20 | 21.316 | 0.0157 | 19.336 | 0.999 | 0.983 | 24.038 | 0.999 |
3.2.3 Adsorption mechanism
In order to gain a deeper insight into the mechanisms and rate controlling steps affecting the kinetics of adsorption, the kinetic experimental results were fitted to the Weber–Morris model [43]. The intraparticle diffusion equation is the following:
| (11) |
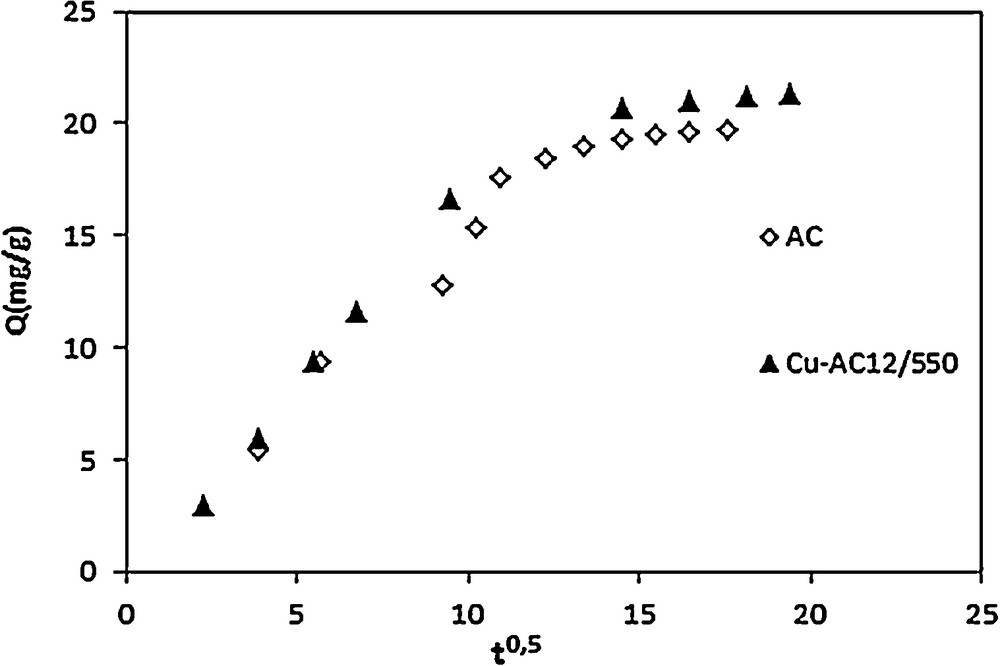
Intraparticle diffusion plots for adsorption of NB on AC and Cu-AC12/550. ([NB] = 20mg/L, pH = 5.5, T = 20 °C).
3.3 Catalyst activity of nitrobenzene ozonation
To investigate the effect of inserting copper in the surface of activated carbon on its catalyst activity, comparative kinetic experiments of nitrobenzene degradation were carried out in the same conditions (Fig. 9).
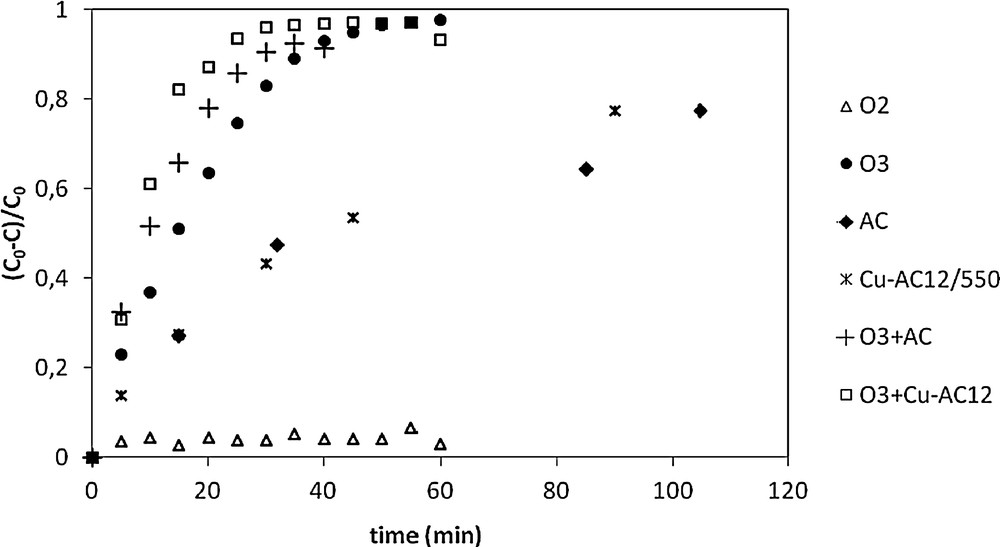
Degradation efficiency of nitrobenzene (NB) using different processes ([O3] = 14.667 mg/L, [NB] = 20 mg/L, T = 20 °C, pH = 5.5, mCu–AC12 = 1 g, mCA = 1 g).
It is interesting to highlight that after 15 min the adsorption conversion of NB on raw AC was 27.2%, and on Cu/AC12/550 it was 27.4%. The degradation of NB achieves 51% by simple ozonation while the oxidation by O2 is limited to a very low conversion rate, i.e. 2.1%. Comparing the curve of O3/Cu/AC with simple ozonation, it can be seen that the removal of NB was greatly enhanced by using ozone and the Cu/AC catalyst simultaneously. It can be observed that the insertion of Cu on AC increases significantly the degradation efficiency of NB; the generation of OH° radicals produced by the catalyst enhances the ozonation kinetics [23]. Degradation by ozone on Cu/AC12 reaches 96% of nitrobenzene conversion in 25 min, indicating an increment of 20% compared to simple ozone oxidation.
In a first approach, the evolution of the concentration can be modeled by a pseudo-first-order kinetic law, as described by Eq. [12]. The values of the corresponding kinetic constants are reported in Table 6.
| (12) |
Adsorption and ozonation pseudo-first-order constant with nitrobenzene.
| Without adsorbent | AC | Cu–AC | |||
| kO2 | kozo | kAds | kOzo | kAds | kOzo |
| 0.04 | 6.3 | 1.97 | 7.6 | 1.57 | 10.9 |
The results show that the use of Cu/AC12 for heterogeneous catalytic ozonation enhances significantly the degradation efficiency of nitrobenzene compared to ozonation alone and to the O3/AC process by about 40%.
To emphasize the results of nitrobenzene degradation efficiency by ozone using activated carbon-supported copper as a catalyst, total organic carbon (TOC) removal by different processes were experimentally investigated: ozone only, ozone combined with activated carbon and ozone combined with activated carbon-supported copper. The results are shown in Fig. 10.
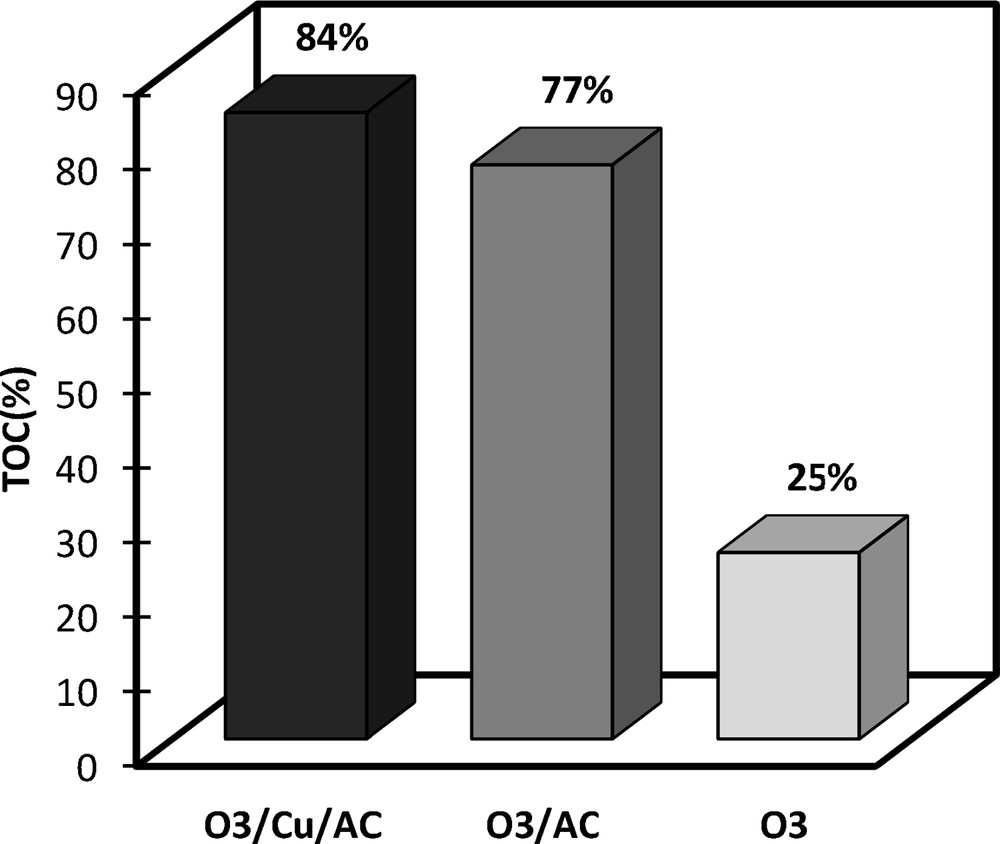
Total organic carbon removal efficiency of nitrobenzene (NB) by different processes ([O3] = 14.667 mg/L, [NB] = 20 mg/L, T = 20 °C, pH = 5.5, mCu–AC12 = 1 g, mCA = 1 g).
It can be observed that activated carbon-supported copper enhances the kinetics and the yield of nitrobenzene conversion by ozone. These results show that simple activated carbon also enhances the ozonation process of nitrobenzene, but in a lesser extent than in the presence of copper. In the latter case, the catalytic effect on nitrobenzene conversion is improved by about 10%.
4 Conclusion
The effect of adding copper on the surface of the activated carbon on its characteristics and its adsorption capacity has been investigated; the catalytic activity of the supported catalyst in the degradation of nitrobenzene using the ozonation process was examined. The results suggest that the texture of the support (activated carbon) does not change the impregnation considerably. Preparation conditions played an important role in the performance of the catalyst. It was found that the highest specific surface area was obtained when the catalyst had been calcined at 550 °C for 2 h. The study of the adsorption mechanism of nitrobenzene on AC and Cu/AC indicates that after impregnation of copper, the attraction of nitrobenzene on the surface of the carbon was improved, revealing that the distribution of active sites play an important role in the adsorption process. It was demonstrated also that the degradation efficiency of nitrobenzene in aqueous solution by ozonation alone was accelerated in the presence of activated carbon, and that the higher degradation efficiency was achieved when the ozonation process was carried out using activated carbon-supported copper as a catalyst.