

1 Introduction
During recent years, significant progress has been made regarding the knowledge on the mercury concentration level, its sources of emission and transport mechanisms in the environment. The Minamata Convention on Mercury (http://www.mercuryconvention.org/) is a global treaty to protect human health and the environment from the adverse effects of mercury. The major highlights of the Minamata Convention on Mercury include a ban on new mercury mines, control measures on air emissions, and the international regulation of the informal sector for artisanal and small-scale gold mining. The Convention draws the attention to a global and ubiquitous metal that, while naturally occurring, has broad uses in everyday objects and is released into the atmosphere, soil and water from a variety of sources. Controlling the anthropogenic releases of mercury throughout its lifecycle has been a key factor in shaping the obligations under the convention. Moreover, a system for mercury observations, called the Global Mercury Observation System, has been developed. The system includes, e.g., free tropospheric mercury measurements. This will then provide high-quality data for the validation and application of regional- and global-scale atmospheric models, to give a firm basis for a future policy of development and implementation.
Atmospheric mercury occurs in the environment in three forms: gaseous elemental mercury (GEM), gaseous oxidized mercury (HgII) compounds (GOM), and mercury associated with particulate matter (known also as total particulate mercury [TPM]). All three forms of the atmospheric mercury are released by anthropogenic sources, mainly combustion processes, as well as by a variety of natural sources and processes [1,2].
Total particulate mercury usually contributes a few percent of the total mercury in the atmosphere. On average, the TPM fraction contributes to the total mercury mass with around 2% in rural areas and ca. 6% in urbanized areas [3]. The dry and wet deposition of TPM by rain and washout and oxidation of Hg0 into HgII in particulate phase are the main processes of the self-purification of the atmosphere with mercury [4]. The lifetime of TPM in the air ranges from several hours to several days, depending on the lifetime of ambient particles [5]. The rate of particle deposition depends on their aerodynamic diameter and ranges between 0,1 and 1 cm·s−1 [6]. Coarse particles are removed near the source of emission, whereas fine particles are transported over longer distances [7,8]. The particle-bound mercury is either directly emitted or formed due to adsorption of the gaseous mercury (mainly HgII, and Hg0) onto existing particles. The processes of dissolution of the Hg compounds in the wet aerosol particles and inclusion of contained mercury minerals into the structure of particles might also occur [9,10]. Therefore, it has been suggested that atmospheric particulate matter has catalytic properties for mercury oxidation and reduction reactions [11].
Table 1 comprises the updated inventory emissions of mercury to air developed by the team of the United Nations Environmental Programme (UNEP). In accordance with the new inventory, more than 85% of these emissions originate from coal combustion for power generation and industrial processes [12].
Emission of mercury from various sectors (tonnes per year) [12].
| Sector | Emission (range) [t] | % |
| By-product or unintentional emissions | ||
| Fossil fuel burning | ||
| Coal burning (all uses) | 474 (304–678) | 24 |
| Oil and natural gas burning | 9.9 (4.5–16.3) | 1 |
| Mining, smelting, and production of metals | ||
| Primary production of ferrous metals | 45.5 (20.5–241) | 2 |
| Primary production of non-ferrous metals (Al, Cu, Pb, Zn) | 193 (82–660) | 10 |
| Large-scale gold production | 97.3 (0.7–247) | 5 |
| Mine production of mercury | 11.7 (6.9–17.8) | <1 |
| Cement production | 173 (65.5–646) | 9 |
| Oil refining | 16 (7.3–26.4) | 1 |
| Contaminated sites | 82.5 (70–95) | 4 |
| Intentional uses | ||
| Artisanal and small-scale gold mining | 727 (410–1040) | 37 |
| Chlor-alkali industry | 28.4 (10.2–54.7) | 1 |
| Consumer product waste | 95.6 (23.7–330) | 5 |
| Cremation (dental amalgam) | 3.6 (0.9–11.9) | <1 |
| Grand total | 1960 (1010–4070) | 100 |
The authors of the report for the United Nations Environmental Programme point out the sectors for which emissions of mercury are currently not quantified: biofuel production and combustion, vinyl-chloride monomer production, secondary metals and production of ferroalloys, oil and gas extraction, transport and processing other than refinery emissions, industrial and hazardous waste incineration and disposal, sewage sludge incineration, preparation of dental amalgam fillings and disposal of removed fillings containing mercury [12]. The sum of emission from ‘by-product’ sectors, and the conservative emission estimates from intentional use of mercury in products and artisanal mining, and emission associated with cremations result in a global anthropogenic mercury emission equal to 1960 tonnes for the reference year 2010.
Multiple studies on the negative impact of ambient particulate matter were conducted [13–18]. Major components represent several percent of the total mass of the PM, whereas trace elements usually represent less than 1% of the PM [19]. Sulphate, nitrate and ammonium ions originate predominantly from gaseous precursors: sulphur dioxide, nitrogen oxides and ammonia, respectively. Thus, they are considered as secondary aerosols. Their ambient concentrations are not necessarily proportional to the quantity of gas emissions, since the formation pathways and the gas/particle equilibrium may be controlled by factors other than the concentration of the precursor gas [17,20–25].
Carbonaceous particles (organic carbon [OC], elemental carbon [EC] and carbonate carbon [CC]) account for up to 50% of the total mass of the PM10. Elemental carbon is emitted into the atmosphere, as a primary aerosol, mainly during incomplete combustion of fossil fuels (traffic, industry, domestic heating, and refuse burning) and biomass, and is therefore treated as a direct indicator of urban pollution and traffic intensity [26,27]. Moreover, elemental carbon is considered to act as a carrier of mercury as both EC and Hg have an origin in coal combustion [11]. Organic carbon can be present in both primary and secondary aerosols. Primary OC is formed during combustion processes, including unleaded gasoline combustion, biomass burning and agricultural activity, as well as emitted from natural sources (plant debris, pollen or fungi). Furthermore OC is formed during oxidation and gas-to-particle conversion of volatile organic compounds (VOC) emitted by anthropogenic or natural processes [28–30].
The goal of this study was to determine the total particulate mercury concentration in the urban area of Krakow, Poland, in the winter of 2011. Moreover, the study presents data for organic and elemental carbon as well as of inorganic ion concentrations in PM10 measured during the sampling campaign and discusses the relations between the measured parameters.
The authors of the paper do not assess the level of pollution of Krakow, indicating particulate mercury as a tracer for air pollution in the city. They are aware that TPM contributes only a few percent of the total mercury balance in the atmosphere. But in association with augmented concentrations of PM10 in Krakow (which is a really serious problem in Krakow), the problem is significant especially for human health. Chemical composition of particulate matter, as well as their size can influence human health. The smallest particles, especially those containing toxic metals, pose serious threats to human health. Mercury has been recognized as one of the most toxic anthropogenic pollutants. Mercury associated with airborne particulate matter can reach up to the lungs where they undergo some reactions leading to changes in the autoimmune system. Besides that, TPM may be deposited together with particulate matter within dry or wet deposition. These are mechanisms of self-cleaning up of atmosphere. As a result of these processes, the concentration of mercury increases in lakes, rivers, seas, etc. In conductive conditions, mercury is then reemitted into the atmosphere.
So far there has not been research concerning the presence of mercury in atmospheric aerosols in Krakow. The authors want to emphasize that the present work constitutes a preliminary study for Krakow, in order to estimate the concentration of mercury in atmospheric aerosols.
2 Experimental
2.1 Sampling
The sampling site was located in the centre of Krakow (50°04’01“N; 19°54’47”E), in the Krowodrza district. This built-up area represents a typical urban location characterized by high traffic intensity, on the one hand, and a settlement area with a big park, on the other hand. A low-volume sampler LVS-3 working with a flow of 2.3 m3·h−1 was placed on the roof of a three-storey building (AGH University of Science and Technology). The PM10 fraction was collected in 24-h intervals during nine days from 22 February to 3 March 2011 on quartz fibre filters (Whatman QMA). All quartz fibre filters had been preheated for 6 h at 550 °C and then maintained at T = 20 ± 1 °C and RH = 50 ± 5% for at least 24 h prior to weighting and sampling. In order to determine the mass of collected PM10, the pre-conditioned filters were weighted with an A&D HM-202-EC microbalance, with an accuracy of 0.01 mg. The masses of the filters before and after sampling were obtained as the average of three measurements.
2.2 Meteorological data
The meteorological data used in the study (air temperature, wind speed, humidity and precipitation volume, pressure) was obtained from the online platform (http://www.meteo.ftj.agh.edu.pl/) providing the results of the meteorological measurements of the AGH University of Science and Technology. The meteorological measurement station Vaisala WXT520 is located on the roof of the building where the samples were collected. The collected data are presented in Table 2.
Meteorological data during the study period.
| Date | Wind velocity (m·s−1) | Temperature (°C) | Humidity (%) | Pressure (hPa) | Precipitation (mm) |
| 22 Feb 2011 | 2.45 | –8.68 | 85 | 1019 | 0.2 |
| 23 Feb 2011 | 1.85 | –8.46 | 82 | 1025 | 0 |
| 24 Feb 2011 | 1.75 | –7.13 | 86 | 1030 | 0.2 |
| 25 Feb 2011 | 2 | –6.64 | 86 | 1031 | 0 |
| 27 Feb 2011 | 2.17 | –3.03 | 86 | 1019 | 0 |
| 28 Feb 2011 | 2.5 | –4.53 | 82 | 1026 | 0 |
| 1 Mar 2011 | 2.53 | –2.47 | 76 | 1034 | 0 |
| 2 Mar 2011 | 2.51 | –2.32 | 68 | 1036 | 0 |
| 3 Mar 2011 | 1.83 | –1.13 | 66 | 1032 | 0 |
In order to determine the backward trajectory of air masses, the hybrid single-particle Lagrangian integrated trajectory (HYSPLIT) model was used. HYSPLIT is a complete system for computing simple air parcel trajectories to complex dispersion and deposition simulations. A detailed description of the model can be found at webpage: http://www.ready.arl.noaa.gov/HYSPLIT_traj.php [31].
2.3 Determination of the mercury content in the PM10
The concentration of the total particulate mercury (TPM) was determined using mercury analyser MA-3000, Nippon Instrument Corporation (Japan). It enables the direct measurement of the amount of mercury in solid (e.g., in coal), liquid, and gas samples using the method of thermal decomposition. The sample is burnt in an oven; the exhaust gas is passed through the gold sorbent, where chemisorption and thus pre-concentration of mercury occurs. The created amalgamate is heated, and mercury is desorbed and determined by cold-vapour atomic absorption spectrometry (CVAAS).
Mercury determination was repeated twice for each sample. Two punches (Ø 7 mm) per sample were used for analysis. The accuracy of the method was assessed by the analysis of the mercury content in the reference material NIST 2692c (Hg content = 0.179 μg·g−1). For n = 6, the average mercury content was equal to 0.172 μg·g−1; the relative standard deviation = 14%. The linear correlation between absorbance and mercury content (y = 0.08 x + 0.0165, R2 = 0.9992) was used for calibration and determination of the mercury content in the PM10 samples. The limit of detection of the method is equal to 0.046 ng·m−3.
2.4 Determination of the organic and elemental carbon in the PM10 samples
Organic and elemental carbon concentrations were determined using a thermal-optical method (Sunset Lab OC/EC Aerosol Analyser, Sunset Lab. Inc.) developed for atmospheric samples [32], using the quartz.par temperature protocol and a laser in the transmission mode. Circular filter aliquots with a diameter of 10 mm were cut from the filters and analysed without any sample pre-treatment. Each sample is quantified due to calibration with He/CH4 calibration gas (Air Liquide, Austria). The limits of detection for TC, OC and EC are equal to 0.32 μg·m−3, 0.32 μg·m−3, 0.01 μg·m−3, respectively.
The reproducibility of the total carbon determination was regularly checked with a reference material (PM10 collected on quartz fibre filter). The relative standard deviation for the reference material was equal to 5%.
2.5 Determination of the inorganic ions in the PM10 samples
The concentration of the inorganic anions and cations were analysed with isocratic ion chromatography): Na+, K+, Mg2+, Ca2+, NH4+, NO3–, Cl–, SO42–. Two circular filter aliquots (Ø 10 mm) per sample were extracted under ultrasonic agitation for 20 min, in either 2 ml of extra pure water (Milli-Qplus 185, Millipore, 18.2 MΩ), or in 3 mL of the 12 mM methanesulphonic acid (MSA) for anion and cation determination, respectively.
IC-analysis was performed on a DX-3000 instrument (Thermo Scientific) equipped with ion-exchange columns (Ion Pac AS17A for anions mobile phase: 1.8 mM Na2CO3 + 1.7 mM NaHCO3; CS12A for cations), mobile phase: 12 mM MSA). After electrochemical suppression, quantification was performed with a conductivity detector.
Calibration was performed against external standards diluted from stock solutions supplied by Merck. The limit of detection (defined as 3 × the standard deviation for the field blank samples) of the method for atmospheric samples is equal to 0.1 μg·m−3 for Na+ and Cl–and 0.01 μg·m−3 for the other ions.
3 Results and discussion
3.1 Mass concentrations
The samples were collected during a short winter campaign and analysed for particulate mercury and major PM constituents. Table 3 gives the concentrations of components of interest, stressing the difference with the period between 22 February and 2 March 2011.
Statistical characteristic of PM10, particulate mercury and other components concentrations.
| Study period/date | PM10 (μg·m−3) | TPM (ng·m−3) | OC (μg·m−3) | EC (μg·m−3) | EC/OC (--) | Cations (μg·m−3) | Anions (μg·m−3) |
| 22 Feb–2 Mar 2011 | |||||||
| Mean | 78.9 | 0.22 | 22.1 | 3.2 | 0.15 | 9 | 22.4 |
| Max | 89.6 | 0.28 | 29.6 | 4.2 | 0.23 | 10.7 | 28.4 |
| Min | 63.7 | 0.18 | 15.7 | 2.5 | 0.1 | 6.6 | 15.6 |
| Median | 82 | 0.21 | 21.9 | 2.8 | 0.15 | 9.2 | 21.4 |
| SD | 10 | 0.04 | 5 | 1 | 0.04 | 1 | 4.3 |
| 3 Mar 2011 | 205.3 | 0.49 | 72.9 | 11.1 | 0.15 | 18 | 36.1 |
The variations of the PM10 concentration during the sampling campaign in 2011 are depicted in Fig. 1. The daily limit for PM10 set by the European Commission (50 μg·m−3, directive No. 2008/50/EC) was exceeded for every sampling day. The highest PM10 concentration (205 μg·m−3) was observed on 3 March 2011, and differed significantly from the average observed for the rest of the days. The observations in the paper are confirmed by the values of PM10 measured by the Voivodeship Inspectorate for Environmental Protection in Krakow at Krasinskiego Avenue (data were downloaded from http://www.krakow.pios.gov.pl/). The station is placed near the main street in Krakow at the height of ca. 2 m. The difference of location resulted in a different PM10 concentration. However, the most visible is an increase in the PM10 amount in the last day of the study period. Fig. 1 also shows the variations of organic (OC) and elemental carbon (EC) in the batch of analysed samples. The average OC and EC contribution to the total PM10 mass equals 29%, varying between 21 and 49%, and 4%, varying between 3 and 5%, respectively. Furthermore the EC/OC ratio is rather, constant with an average of 0.15, and minimum and maximum values ranging from 0.10 to 0.23). The small variation of these ratios gives an evidence for similar emission patterns during the sampling period.
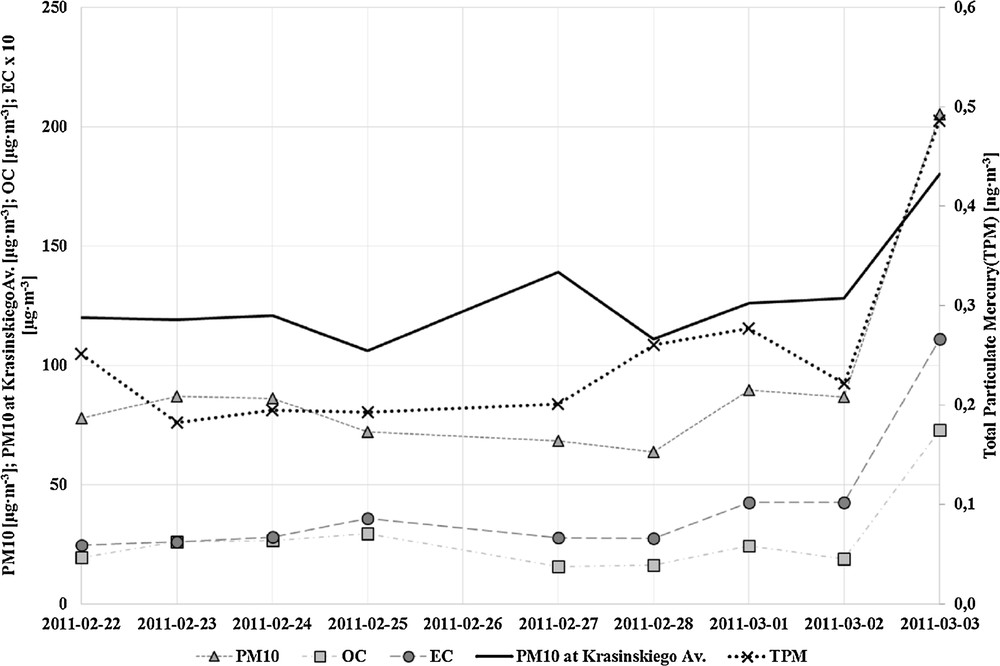
Variations of the PM10, OC, EC and TPM concentration in the measurement campaign.
3.2 Particulate mercury concentrations
The concentration of the particulate mercury ranged between 0.18 and 0.49 ng·m−3. The last day of the sampling campaign was characterized by the highest concentrations of PM10 and its constituents. PM10 exceeded the limit value over 3 times. TPM was twice as high as a day before. The results presented in this paper are comparable with the concentration of the TPM in other parts of Europe, with elevated TPM concentrations, e.g. in Slovakia (0.080–0,960 ng·m−3) [3]. Amounts of the TPM during the discussed sampling period are higher in comparison to the samples collected in northern Poland (Gdynia), where the average TPM concentration was equal to 0.020 ng·m−3 [33]. In Germany (on the northern coast), TPM concentration accounted for 0.005–0.200 ng·m−3; in Swedish stations, the amounts of PM were below 0.010 ng·m−3; in Mace Head (Ireland), less than 0.005 ng·m−3 (which reflects that the Atlantic air is free from particulate mercury) [34]. The results obtained by researchers in Lichwin (a city 100 km away from Krakow) during the winter campaign in 2004 are higher than those reported in the paper: 1.050 ± 0.18 ng·m−3 [35]. It must be indicated that results from Slovakia, Germany, Sweden and Ireland had been presented ca. 10 years ago. The level of air contamination by mercury has drastically changed.
The last day (3 March) of the sampling campaign in Krakow is the most interesting episode in terms of quality and quantitative compositions of the PM10, which are not comparable with the characteristic parameters of the rest of the days. The elevation of the PM10 concentration in the atmosphere was also observed at monitoring stations of the Voivodeship Inspectorate of Environmental Protection in Krakow. Table 4 presents the concentration of PM10 measured at three different locations of Krakow by the Inspectorate of Environmental Protection and at the AGH on 3, 4 and 5 March.
Concentrations of fraction PM10 in three locations of Krakow noted by the Voivodeship Inspectorate of Environmental Protection and at the AGH from 3 to 5 March.
| Date | AGH (ug·m−3) | Krasinskiego Av. (ug·m−3) | Nowa Huta (ug·m−3) | Kurdwanow (ug·m−3) | Humidity (%) | Wind velocity (m·s−1) |
| 3 Mar | 205 | 180 | 144 | – | 66 | 2.83 |
| 4 Mar | – | 271 | 223 | – | 55 | 2.8 |
| 5 Mar | – | 121 | 95 | 108 | 57 | 6.99 |
Additionally, Table 4 presents parameters of humidity and wind velocity in these days. It may be noticed that on 4 March the concentration of PM10 is much higher than on 3 March. Conversely, on 5 March the concentration is decreasing. Comparing this situation with weather conditions, it may be concluded that pollutions were strongly accumulated above Krakow city during the last day of sampling. Very low humidity, relatively increasing temperature of air and low wind velocity caused a stoppage of air mass movements and ventilation. On 5 March, the wind was blowing with a higher strength. Due to that, pollution was dispelled, which results in a decreasing concentration of PM10 on that day.
In the whole period of sampling, the wind was blowing in a northeastern direction. The average temperature during the whole study period was estimated to –5 °C (Table 2). The elevated levels of pollutants may have their origin in the long-range transport of air masses. In order to confirm or exclude this possibility, the backward trajectories for three chosen days of the study period are presented in Fig. 2. Trajectories were evaluated for time = 72 h and height = 500 m. It is remarkable that in all cases the influx of air comes from the southeast: it goes through Ukraine to Slovakia and reaches finally Krakow at the end. On 23 February, the air masses came from northern Ukraine, and on this day the lowest concentration of the TPM was demonstrated, whereas when air masses come from southern Ukraine, the concentration of TPM increases. Anyway, such slight differences are not significant for further considerations.
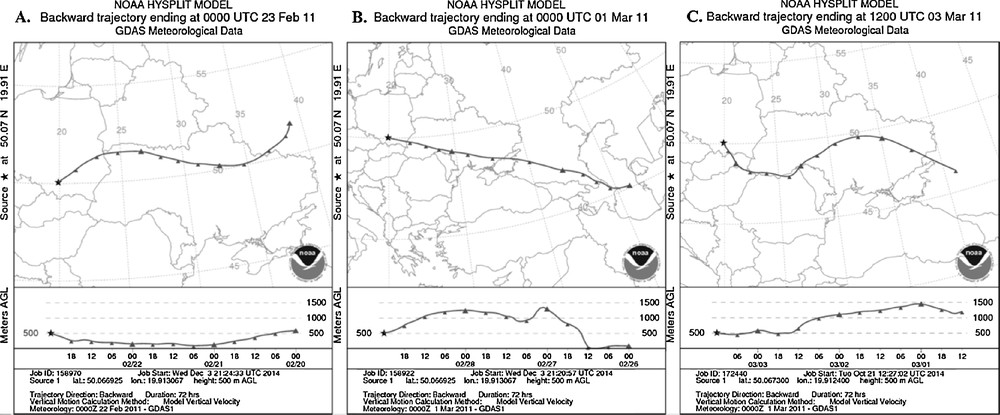
Backward trajectories of air masses at the height of 500 m on three days. A. On 2 February 2011. B. On 1 March 2011. C. On 3 March 2011.
During the whole study period, there were no rainfalls. The temperature was increasing, which could point out the flow of warm fronts. The aforementioned factors might have provoked an accumulation of pollutions by inversion layer, which resulted then in an increase in PM10 concentration. The inversion occurs in the vicinity of warm fronts with sufficient humidity and whenever radiation from the surface of the earth exceeds the amount of radiation received from the sun, which is characteristic of the winter season. The inversion layer is significant because it blocks the flow of air masses. This can then result in various types of weather patterns. More importantly, though, areas with heavy pollution are prone to unhealthy air and to an increase in smog when an inversion is present because they trap pollutants at the ground level, preventing them from circulating away. Besides that, pollution could be transported by the wind to the city centre from the steelwork and from the power plant, which are located in the northeastern part of Krakow.
3.3 Cross correlations between measured parameters
Fig. 3 presents the distribution of inorganic ions, which were determined in PM10 samples. The highest values were observed for secondary pollutants NO3– and SO42– and NH4+, which can either be produced on a local and a regional scale, or can come from long-range transport. Their presence point to anthropogenic emission sources such as fossil fuels combustion, e.g., from transport and industry. Regarding ammonium, agriculture can contribute as well. Fig. 4 presents the dependence of the sum of the equivalent concentrations of nitrate and sulphate ions on the equivalent concentration of the ammonium ions. The correlation coefficient is estimated at R2 = 0.9824. It confirms that these ions are associated with each other and derive their common origin from the total mass of PM10.
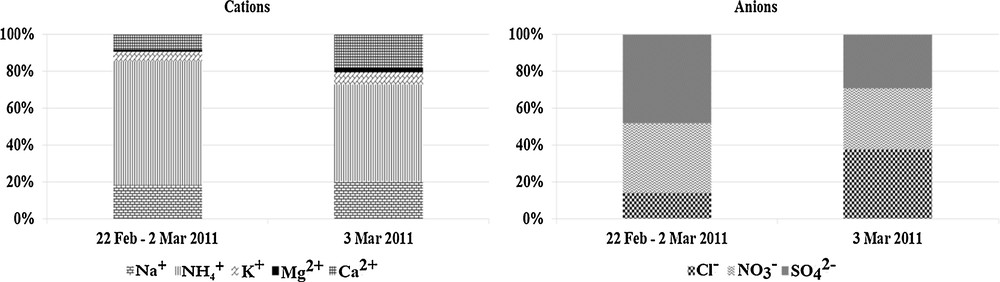
The contribution of the particular cations and anions separately for the period: 2 February, 2 March 2011, 3 March 2011.
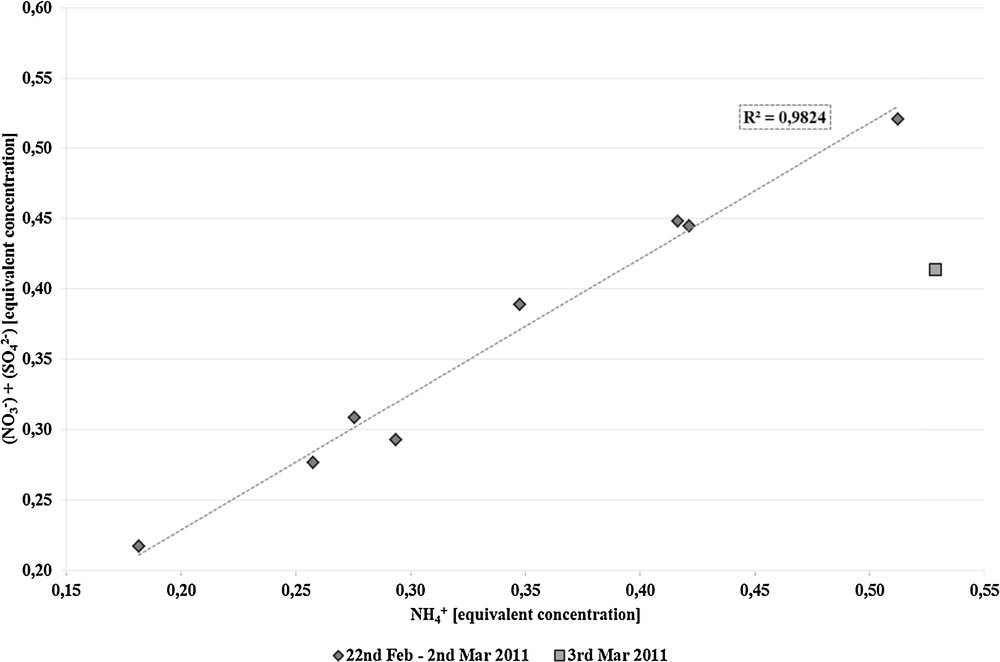
Dependence of the equivalent concentration of nitrate and sulphate ions on the equivalent concentration of ammonium ions.
Furthermore, the concentrations of particulate chloride are elevated. The overall chloride concentrations are above average when compared to data collected at sites without an influence of coal combustion [36], while data for particulate matter affected by emissions from coal combustion are more similar [37]. This is especially pronounced on 3 March when chloride becomes the most concentrated ion and again depicts the special conditions during that day. In Fig. 5A, the correlation between the concentration of the chloride and sodium ions is depicted. It is noticeable that some points (marked in circles) do not suit the trend line. It indicates an excess of the concentration of chloride ions. The dependence of the excess of chloride ions on TPM concentration is depicted in Fig. 5B. The correlation coefficient is estimated at R2 = 0.9518. It points out the high imbrication of coal combustion and mercury chloride emission.
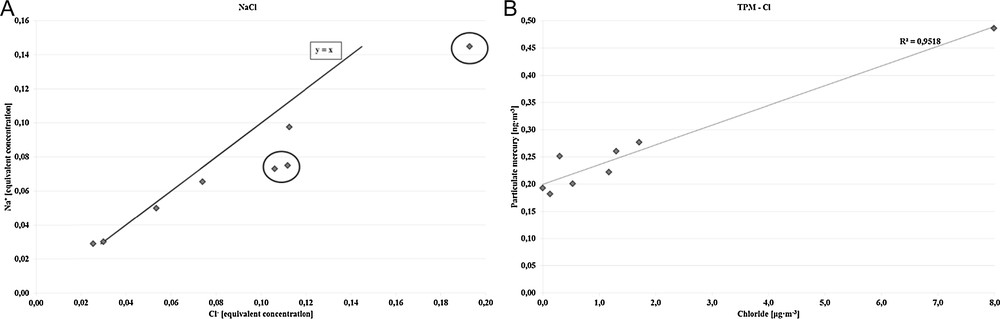
A. The correlation of chloride and sodium equivalent concentrations. B. The dependence of the chloride ions concentrations on the concentration of TPM.
Table 5 presents the Spearman rank correlation coefficients calculated for the amount of the TPM, carbon parameters and selected inorganic ions. The highest values of the coefficient were obtained for correlations between elemental carbon and TPM and between chloride ions and TPM. The Spearman coefficients prove that particulate mercury can be associated both with EC and Cl–. Higher correlation between EC and TPM confirms that Hg is associated with EC as they both have their origin in coal combustion. In accordance with the values presented in Table 5, TPM correlates more significantly with EC than with OC, whereas the value of Spearman's rank correlation coefficient (0.38) is still low. Such situation may be caused by the small number of samples. In order to check whether the correlation is significant at the significance level α = 0.05, the calculated Spearman coefficients were compared with the critical factor in relation to the table of Spearman's critical factors [38]. The critical factor for n = 9 and for α = 0.05 is estimated at rcrit = 0.70. Summing up, only the Spearman coefficient for chloride ion (rs = 0.86) is statistically significant and reliable.
Spearman's rang correlation coefficients for the TPM, carbon parameters and selected inorganic ions.
| n = 9 | OC | EC | Cl− | NO3− | SO42− |
| TPM | −0.09 | 0.38 | 0.86 | 0.03 | −0.46 |
3.4 Deposition of particulate mercury
Once aerosols containing mercury are released into the atmosphere, they undergo atmospheric transportation, degradation and deposition to the surface. Atmospheric deposition is an important process in the introduction of aerosols and pollutants to aquatic environments. The air–water exchange of TPM contributes significantly to the mercury budget of the environment. As no precipitation occurred during the period of observation, only dry deposition can be evaluated. The dry deposition flux of mercury was calculated using the formula given by the Seinfeld and Pandis equation [39]:
| (1) |
The deposition velocity was calculated on the basis of equation (2):
| (2) |
| (3) |
The aforementioned method is based on the consideration of Slinn and Slinn [40], who assumed that in the lower layer, near the interface, atmospheric turbulence has a negligible but direct influence on particle transportation, as well as the particle radius. Assuming that the height of wind velocity measurement is equal to the reference height (10 m a. s. l.), the friction velocity was calculated with the use of the equation (4):
| (4) |
The dry deposition flux determined for particulate matter ranged from 29.1 to 77.0 ng·m−2·d−1, when daily averages were considered. This is in agreement with the data given in the literature [6]. The day-to-day variations are shown in Fig. 6 and reflect the wind velocity determined at the sampling site. The lowest flux of deposition contributes on the third day of sampling, when wind velocity was the lowest. The mercury flux is very much driven by the deposition velocity on all days despite the last two, especially on 3 March, when concentrations rise up strongly. The given values of the dry deposition flux of particulate mercury are higher by one order of magnitude than the results obtained in Gdynia [41], where the highest dry deposition flux calculated for March 2006 was estimated at 322 ng·m−2·month−1, whereas in Krakow the average TPM dry deposition flux was equal to 1418 ng·m−2·month−1. As the deposition velocity in Gdynia (∼0.004 m·s−1) was comparable to the one evaluated for Krakow (∼0.005 m·s−1), such a difference may be due to interactions of two factors:
- • continental and maritime air masses that occur in northern Poland;
- • a higher concentration of particulate mercury in Krakow (TPMmax(Krakow) = 490 pg·m−3; TPMmax(Gdynia) = 142 pg·m−3).

Particulate mercury and EC fluxes and deposition velocity in Krakow in February–March, 2011.
The obtained results for TPM deposition fluxes are significantly higher than those obtained in Toronto [42] from June to December 2004. The flux of particulate mercury dry deposition in the PM2.5 fraction ranged between 170 and 1110 ng·m−2·month−1, reaching a maximum in June 2004. The average concentration of particulate mercury was equal to 70.3 pg·m−3, and deposition velocity ranged between 0.016 and 0.044 m·s−1. The difference between results from Krakow and Toronto can be assigned to the number of samples that were taken under the consideration for both sites.
4 Conclusions
The goal of this study was to determine the degree of contamination of particulate matter by mercury, in Krakow. The study was enriched by the analysis of the total carbon and inorganic ions and by the calculation of the dry deposition flux of particulate mercury. The augmented concentration of the PM10 in Krakow points to the necessity of a constant control of the mercury level, as well as a reduction of PM10 emissions. Even if the concentrations of mercury are not high (up to ten pg·m−3), together with episodes of high PM10 it might result in adverse impact on human health. The significant association of chloride ions with particulate mercury was found. This indicates one common emission source, which is coal combustion, where mercury might come from. For that reason, modernizations aiming at mercury emission reduction are a necessity in Krakow. Krakow deserves particular consideration as the topography of that city facilitates the accumulation of pollutions.
The authors of this paper are aware that the performed studies refer to a short period of time and that sampling of PM10 samples was conducted only in one location in Krakow. Nevertheless, these results confirm the presence of mercury in this city. This preliminary study evidences a high concentration of mercury in particulate matter in comparison to other regions of Poland, which can indicate higher environmental risk and health problems.
Acknowledgements
The authors acknowledge the financial support of OeaD and of the Ministry of Science and Higher Education (Poland) in the frame of project WTZ (Wissenschaftlich–Technische Zusammenarbeit), No. PL06/2013. This work was also supported by the AGH university grant No. 11.11.210.244.
The International Atomic Energy Agency, project No. RER/1/008, together with the Polish Ministry of Science and Higher Education and its grants for Scientific Research, partially financed this work. The authors gratefully acknowledge the NOAA Air Resources Laboratory (ARL) for the provision of the HYSPLIT transport and dispersion model and/or the READY website (http://www.ready.noaa.gov) for the data used in this publication.